. 2023 Aug 12;14(1):4874.
doi: 10.1038/s41467-023-40410-x.

Identification of a drug binding pocket in TMEM16F calcium-activated ion channel and lipid scramblase

Affiliations

Identification of a drug binding pocket in TMEM16F calcium-activated ion channel and lipid scramblase

Shengjie Feng et al. Nat Commun. .

Abstract

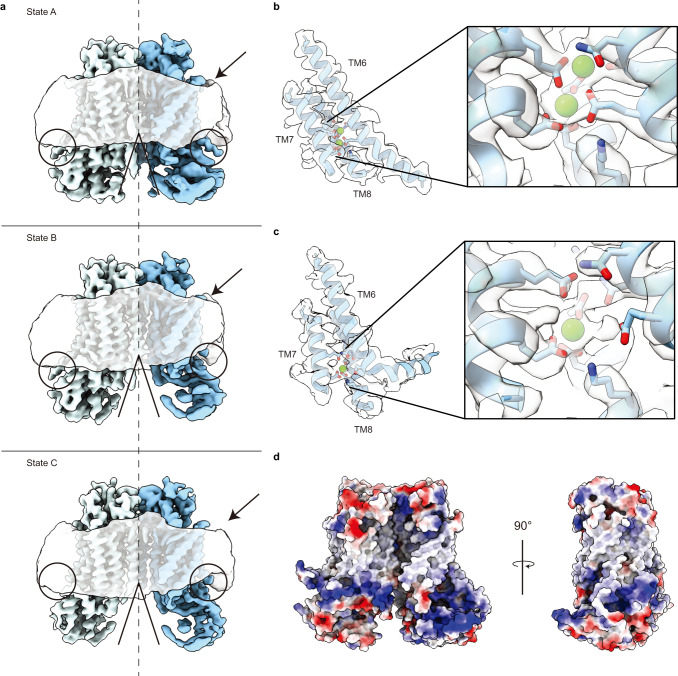
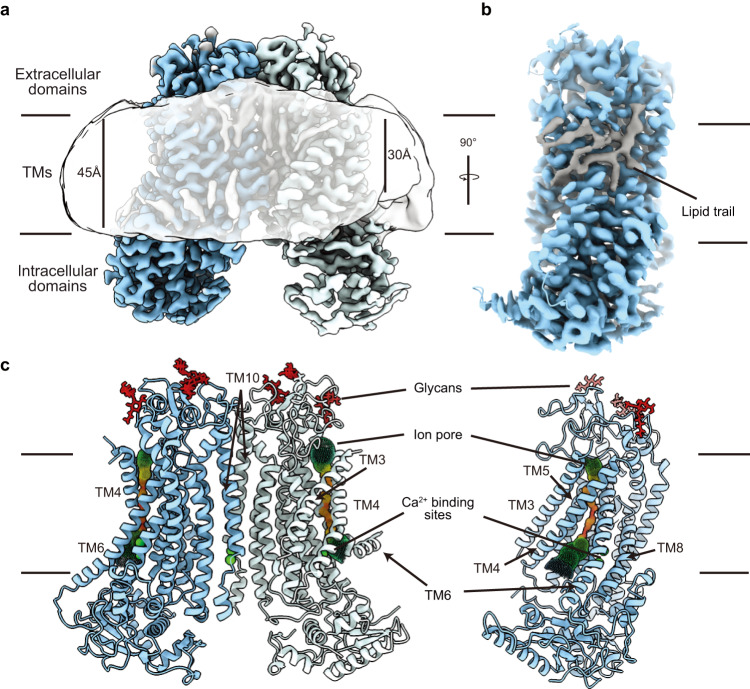
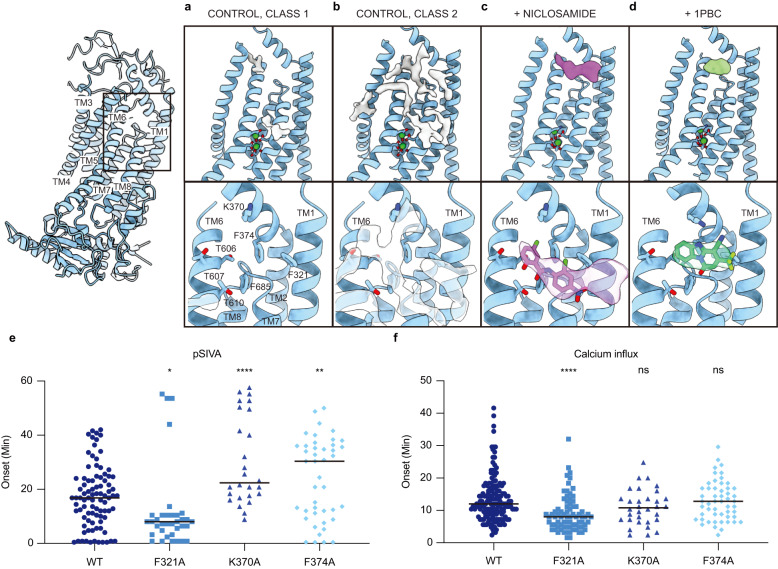
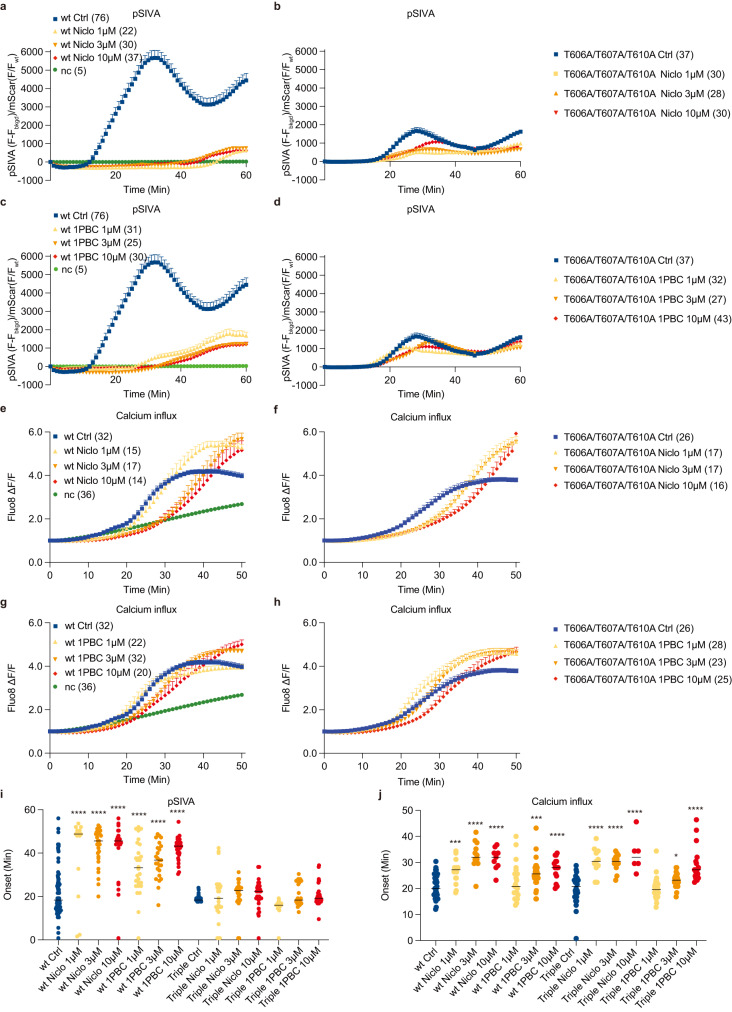
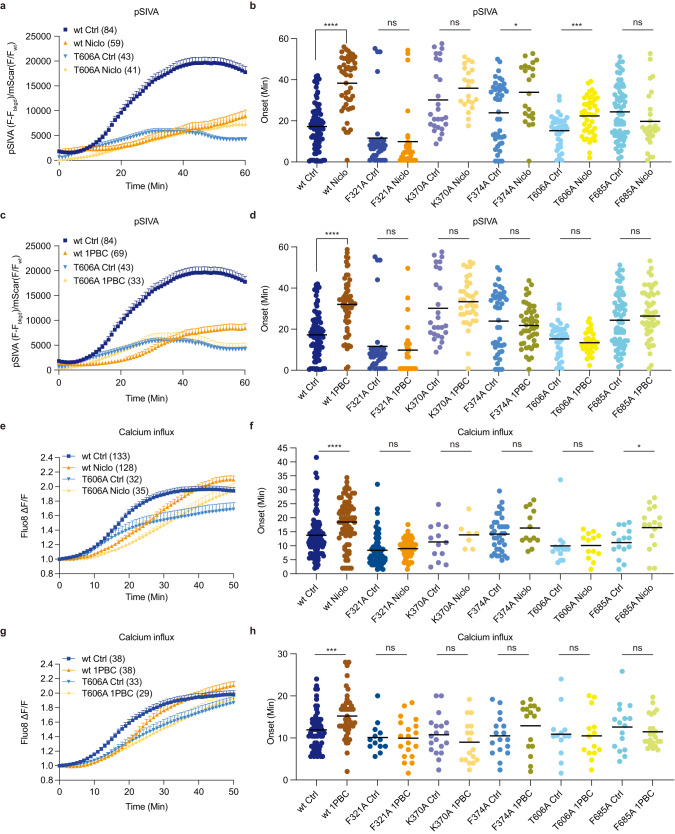
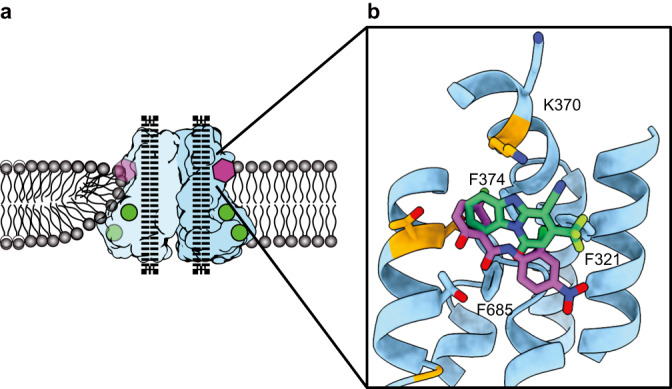
The dual functions of TMEM16F as Ca2+-activated ion channel and lipid scramblase raise intriguing questions regarding their molecular basis. Intrigued by the ability of the FDA-approved drug niclosamide to inhibit TMEM16F-dependent syncytia formation induced by SARS-CoV-2, we examined cryo-EM structures of TMEM16F with or without bound niclosamide or 1PBC, a known blocker of TMEM16A Ca2+-activated Cl- channel. Here, we report evidence for a lipid scrambling pathway along a groove harboring a lipid trail outside the ion permeation pore. This groove contains the binding pocket for niclosamide and 1PBC. Mutations of two residues in this groove specifically affect lipid scrambling. Whereas mutations of some residues in the binding pocket of niclosamide and 1PBC reduce their inhibition of TMEM16F-mediated Ca2+ influx and PS exposure, other mutations preferentially affect the ability of niclosamide and/or 1PBC to inhibit TMEM16F-mediated PS exposure, providing further support for separate pathways for ion permeation and lipid scrambling.


Conflict of interest statement

The authors declare no competing interests.

Figures

Fig. 1
Fig. 1. Identification of three distinct states in drug-free TMEM16F.
a Gaussian filtered density of the nanodisc and unsharpened density of the protein dimer. Unsharpened cryo-EM density and atomic model for three states with different conformations of TM6. Right, Ca2+ binding sites, with sharpened cryo-EM density in semitransparent outline and the residues depicted as sticks colored by heteroatom, in (b) monomer with extended TM6 and (c) monomer with kinked TM6. d Electrostatic surface of the asymmetric TMEM16F dimer, where white represents hydrophobic areas and blue and red correspond to positively and negatively charged regions, respectively.
Fig. 2
Fig. 2. Cryo-EM analysis reveals asymmetry of the TMEM16F dimer.
a Cryo-EM density of the asymmetric state of the TMEM16F dimer with the monomers colored blue and light blue, respectively, and the lipid densities in grey. The gaussian filtered cryo-EM density (semitransparent) reveals distortion of the lipid nanodisc. b Side view of a TMEM16F monomer (blue) highlighting the trail of lipids (grey) covering the TM region. c Front and side view of the atomic model of the asymmetric state of TMEM16F with Ca2+ atoms and glycans shown in green and red, respectively. The ion conduction channel identified by HOLE is represented by spheres colored in rainbow scale based on the local width of the channel, where red <1.5 Å and blue >7.5 Å.
Fig. 3
Fig. 3. Niclosamide and 1PBC in the same hydrophobic groove of TMEM16F.
Atomic model of the TM1-TM6 region of (a) Class 1 and (b) Class 2 of the drug-free TMEM16F, (c) niclosamide-bound TMEM16F and (d) 1PBC-bound TMEM16F. In each case, the additional cryo-EM densities found in the area are shown. Below, zoom into the TM1-TM6 groove with the residues shown as sticks and colored by heteroatom and the additional density found within the pocket shown in semitransparent outline. Structures of niclosamide and 1PBC as determined by computational docking using Glide are shown in purple and green, respectively. Bottom panels, differential effects of K370A and F374A mutations on TMEM16F-mediated (e) PS exposure (n = 84 for WT; 35 for F321A; 26 for K370A and 43 for F374A) and (f) Ca2+ influx (n = 162 for WT; 76 for F321A; 32 for K370A and 52 for F374A). At least three independent experiments have been performed for each condition, each with distinct cell populations to assess biological rather than technical variability. The mean ± SEM is shown along with the statistical significance determined by unpaired t-test (two-tailed) for each mutant as compared to the wildtype control (F321A: p = 0.0254; K370A: p < 0.0001; F374A: p = 0.0051 in (e) and F321A: p < 0.0001; K370A: p = 0.1003; F374A: p = 0.9862 in (f), p < 0.05; ∗∗p < 0.01; ∗∗∗p < 0.001; ∗∗∗∗p < 0.0001).
Fig. 4
Fig. 4. Functional validation of the drug binding site in TMEM16F.
Representative curves of live imaging of TMEM16F-dependent PS exposure (ad); and Ca2+ influx (eh). NC is negative control with stable cell line expressing mScarlet rather than TMEM16F tagged with mScarlet. Data are represented as mean ± SEM. Scattered dot plots of time of onset of TMEM16F-dependent PS exposure (i) n = 76 for wt Ctrl; 14 for wt Niclo 1 μM; 29 for wt Niclo 3 μM; 25 for wt Niclo 10 μM; 28 for wt 1PBC 1 μM; 25 for wt 1PBC 3 μM; 29 for wt 1PBC 10 μM; n = 23 for Triple Ctrl; 25 for Triple Niclo 1 μM; 22 for Triple Niclo 3μM; 30 for Triple Niclo 10 μM; 28 for Triple 1PBC 1 μM; 25 for Triple 1PBC 3 μM; 42 for Triple 1PBC 10 μM and Ca2+ influx (j) n = 31 for wt Ctrl; 15 for wt Niclo 1 μM; 12 for wt Niclo 3 μM; 9 for wt Niclo 10 μM; 22 for wt 1PBC 1 μM; 31 for wt 1PBC 3 μM; 15 for wt 1PBC 10 μM; n = 24 for Triple Ctrl; 11 for Triple Niclo 1 μM; 13 for Triple Niclo 3 μM; 6 for Triple Niclo 10 μM; 28 for Triple 1PBC 1 μM; 23 for Triple 1PBC 3 μM; 17 for Triple 1PBC 10 μM. Time of onset could not be determined for time courses with a linear rather than sigmoidal rise. At least three independent experiments have been performed for each condition, each with distinct cell populations to assess biological rather than technical variability. The mean ± SEM is shown along with the statistical significance determined by unpaired t-test (two-tailed) for wildtype or mutant with 1PBC or Niclo as compared to its vehicle control (wt Niclo 1 μM: p < 0.0001; wt Niclo 3 μM: p < 0.0001; wt Niclo 10 μM: p < 0.0001; wt 1PBC 1 μM: p < 0.0001; wt 1PBC 3 μM: p < 0.0001; wt 1PBC 10 μM: p < 0.0001; Triple Niclo 1 μM: p = 0.8613; Triple Niclo 3 μM: p = 0.3651; Triple Niclo 10 μM: p = 0.1865; Triple 1PBC 1 μM: p < 0.0001; Triple 1PBC 3 μM: p = 0.1166; Triple 1PBC 10 μM: p = 0.3885 in (i) and wt Niclo 1 μM: p = 0.0004; wt Niclo 3 μM: p < 0.0001; wt Niclo 10 μM: p < 0.0001; wt 1PBC 1 μM: p = 0.3469; wt 1PBC 3 μM: p = 0.0003; wt 1PBC 10 μM: p < 0.0001; Triple Niclo 1 μM: p < 0.0001; Triple Niclo 3 μM: p < 0.0001; Triple Niclo 10 μM: p < 0.0001; Triple 1PBC 1 μM: p = 0.8231; Triple 1PBC 3 μM: p = 0.0161; Triple 1PBC 10 μM: p < 0.0001 (j), ∗p < 0.05; ∗∗p < 0.01; ∗∗∗p < 0.001; ∗∗∗∗p < 0.0001). Triple: T606A/T607A/T610A.
Fig. 5
Fig. 5. Functional validation of the drug binding site in TMEM16F.
Representative curves of live imaging of TMEM16F-dependent PS exposure (a) and (c); and Ca2+ influx (e) and (g). Data are represented as mean ± SEM. Scattered dot plots of time of onset of TMEM16F-dependent PS exposure [(b) and (d)] n = 84 for wt Ctrl; 47 for wt Niclo; 58 for wt 1PBC; 35 for F321A Ctrl; 30 for F321A Niclo; 24 for F321A 1PBC; 26 for K370A Ctrl; 21 for K370A Niclo; 38 for K370A 1PBC; 43 for F374A Ctrl; 33 for F374A Niclo; 48 for F374A 1PBC; 39 for T606A Ctrl; 41 for T606A Niclo; 33 for T606A 1PBC; 69 for F685A Ctrl; 27 for F685A Niclo; 50 for F685A 1PBC, and Ca2+ influx [(f) n = 103 for wt Ctrl; 77 for wt Niclo; 63 for F321A Ctrl; 58 for F321A Niclo; 13 for K370A Ctrl; 7 for K370A Niclo; 35 for F374A Ctrl; 13 for F374A Niclo; 14 for T606A Ctrl; 13 for T606A Niclo; 15 for F685A Ctrl and 16 for F685A Niclo and (h) n = 59 for wt Ctrl; 48 for wt 1PBC; 13 for F321A Ctrl; 19 for F321A 1PBC; 19 for K370A Ctrl; 17 for K370A 1PBC; 17 for F374A Ctrl; 16 for F374A 1PBC; 13 for T606A Ctrl; 14 for T606A 1PBC; 16 for F685A Ctrl; 23 for F685A 1PBC] after chemical induction via 25 mM paraformaldehyde (PFA) and 2 mM dithiothreitol (DTT), in the absence (Ctrl) or presence of 3 μM niclosamide (Niclo) or 3 μM 1PBC. Time of onset could not be determined for time courses with a linear rather than sigmoidal rise. At least three independent experiments have been performed for each condition, each with distinct cell populations to assess biological rather than technical variability. The mean ± SEM is shown along with the statistical significance determined by unpaired t-test (two-tailed) for wildtype or each mutant with 1PBC or Niclo as compared to its vehicle control (wt Niclo: p < 0.0001; wt 1PBC: p < 0.0001; F321A Niclo: p = 0.6599; F321A 1PBC: p = 0.6372; K370A Niclo: p = 0.1682; K370A 1PBC: p = 0.3624; F374A Niclo: p = 0.0127; F374A 1PBC: p = 0.4348; T606A Niclo: p = 0.0003; T606A 1PBC: p = 0.2603; F685A Niclo: p = 0.1268; F685A 1PBC: p = 0.1766 in (b) and (d), wt Niclo: p < 0.0001; F321A Niclo: p = 0.8285; K370A Niclo: p = 0.3827; F374A Niclo: p = 0.2960; T606A Niclo: p = 0.9689; F685A Niclo: p = 0.0300 in (f) and wt 1PBC: p = 0.0008; F321A 1PBC p = 0.9213; K370A 1PBC: p = 0.2893; F374A 1PBC: p = 0.2048; T606A 1PBC: p = 0.8562; F685A 1PBC: p = 0.4550 in (h), ∗p < 0.05; ∗∗p < 0.01; ∗∗∗p < 0.001; ∗∗∗∗p < 0.0001). Niclo: Niclosamide.
Fig. 6
Fig. 6. The drug binding pocket identified in TMEM16F.
a Schematic representation of the TMEM16F dimer (light blue and blue) embedded in a lipid bilayer (grey), where Ca2+ atoms are shown as green circles and the inhibitors as a purple polygon and dotted black lines represent the closed ion conduction pore. b Structure of the drug binding pocket in TMEM16F with the side chains of the surrounding residues shown as sticks and the non-conserved residues highlighted in orange. Computationally docked structures of niclosamide and 1PBC are shown in purple and green, respectively. All atoms are colored by heteroatom.

Update of

References

    1. Suzuki J, Umeda M, Sims PJ, Nagata S. Calcium-dependent phospholipid scrambling by TMEM16F. Nature. 2010;468:834–838. - PubMed
    1. Yang H, et al. TMEM16F forms a Ca2+-activated cation channel required for lipid scrambling in platelets during blood coagulation. Cell. 2012;151:111–122. - PMC - PubMed
    1. Watanabe R, Sakuragi T, Noji H, Nagata S. Single-molecule analysis of phospholipid scrambling by TMEM16F. Proc. Natl Acad. Sci. USA. 2018;115:3066–3071. - PMC - PubMed
    1. Alvadia C., et al. Cryo-EM structures and functional characterization of the murine lipid scramblase TMEM16F. Elife8. 10.7554/eLife.44365 (2019). - PMC - PubMed
    1. Fujii T, Sakata A, Nishimura S, Eto K, Nagata S. TMEM16F is required for phosphatidylserine exposure and microparticle release in activated mouse platelets. Proc. Natl Acad. Sci. USA. 2015;112:12800–12805. - PMC - PubMed

Publication types