. 2023 Oct;22(5):1751-1772.
doi: 10.1007/s10237-023-01752-z. Epub 2023 Aug 13.

Computational study of the mechanical behavior of the astrocyte network and axonal compartments in the mouse optic nerve head

Affiliations

Computational study of the mechanical behavior of the astrocyte network and axonal compartments in the mouse optic nerve head

Yik Tung Tracy Ling et al. Biomech Model Mechanobiol. 2023 Oct.

Abstract

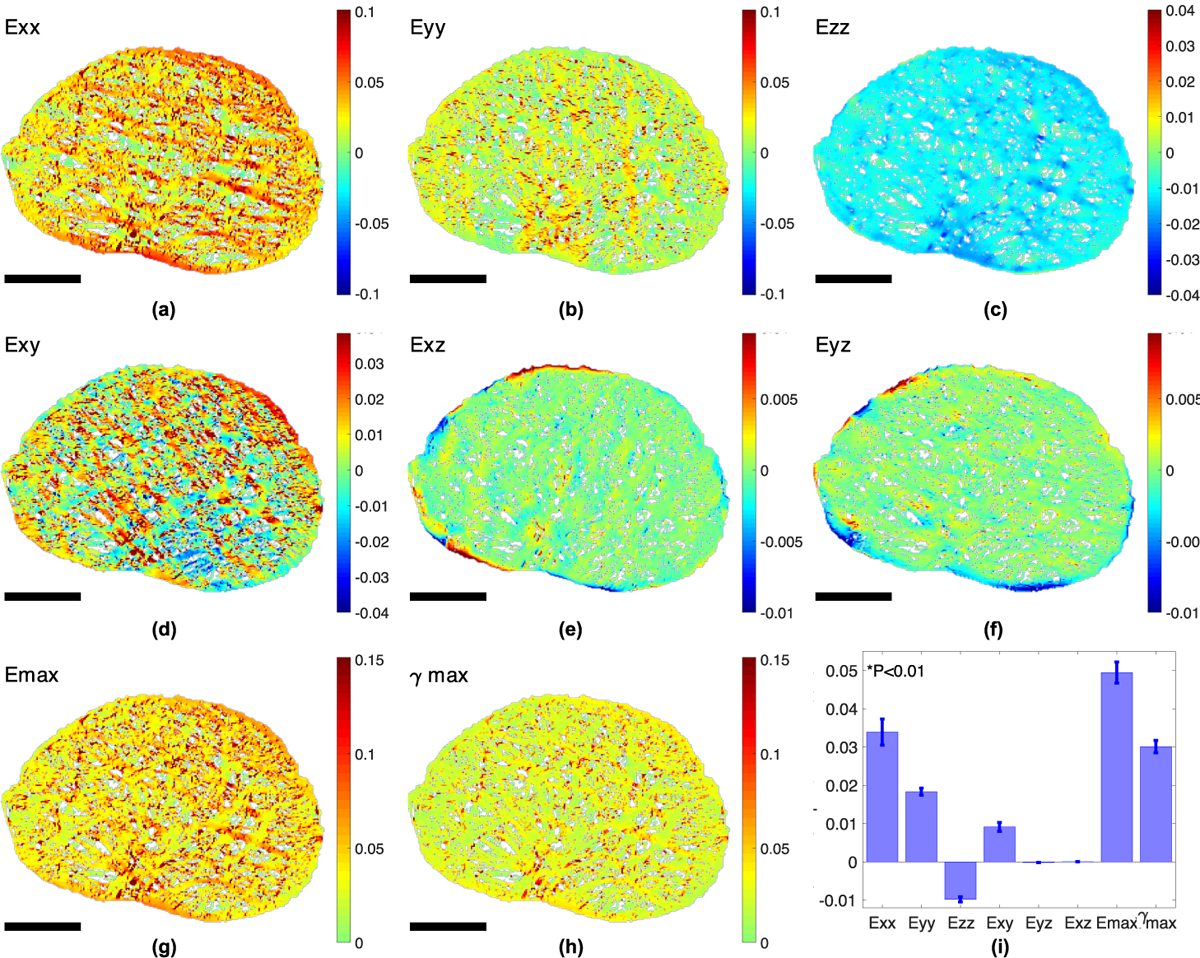
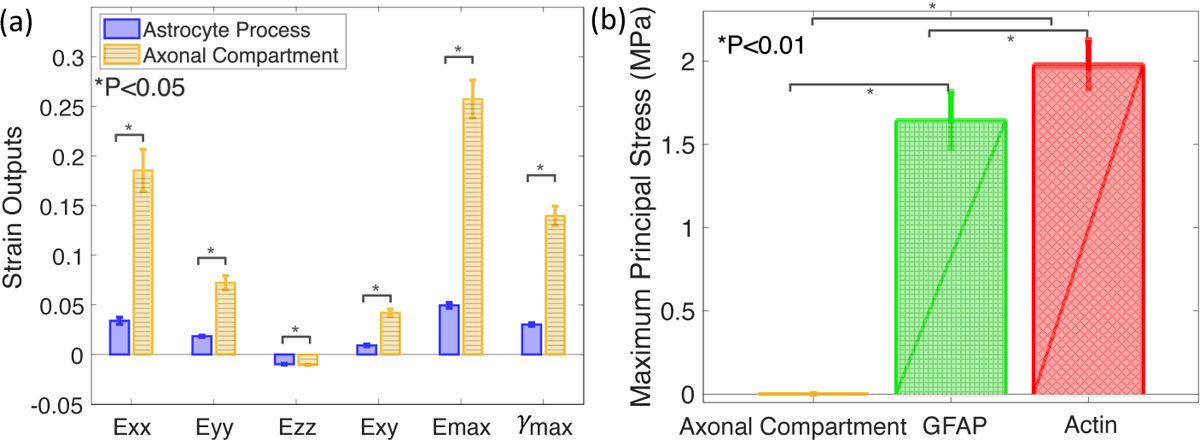
Glaucoma is a blinding disease characterized by the degeneration of the retinal ganglion cell (RGC) axons at the optic nerve head (ONH). A major risk factor for glaucoma is the intraocular pressure (IOP). However, it is currently impossible to measure the IOP-induced mechanical response of the axons of the ONH. The objective of this study was to develop a computational modeling method to estimate the IOP-induced strains and stresses in the axonal compartments in the mouse astrocytic lamina (AL) of the ONH, and to investigate the effect of the structural features on the mechanical behavior. We developed experimentally informed finite element (FE) models of six mouse ALs to investigate the effect of structure on the strain responses of the astrocyte network and axonal compartments to pressure elevation. The specimen-specific geometries of the FE models were reconstructed from confocal fluorescent images of cryosections of the mouse AL acquired in a previous study that measured the structural features of the astrocytic processes and axonal compartments. The displacement fields obtained from digital volume correlation in prior inflation tests of the mouse AL were used to determine the displacement boundary conditions of the FE models. We then applied Gaussian process regression to analyze the effects of the structural features on the strain outcomes simulated for the axonal compartments. The axonal compartments experienced, on average, 6 times higher maximum principal strain but 1800 times lower maximum principal stress compared to those experienced by the astrocyte processes. The strains experienced by the axonal compartments were most sensitive to variations in the area of the axonal compartments. Larger axonal compartments that were more vertically aligned, closer to the AL center, and with lower local actin area fraction had higher strains. Understanding the factors affecting the deformation in the axonal compartments will provide insights into mechanisms of glaucomatous axonal damage.

Keywords: Astrocytes; Axons; Gaussian process regression; Glaucoma; Optic nerve head.


Conflict of interest statement

Competing interests: Not application

Figures

Fig. 1:
Fig. 1:
Development of a specimen-specific model of the mouse AL. The model was developed from (a) a confocal microscope image of a thin section from the unmyelinated region of the mouse ON. The thin section was labeled for GFAP (green) and actin (red). The non-actin and non-GFAP labeled regions were marked as axonal compartments. (b) The image was downsampled and the actin (red), GFAP (green), axonal compartment (yellow), and overlapping actin and GFAP (purple) regions of the downsampled image were segmented into material regions. An FE model of the AL was created by turning each voxel into a trilinear hexahedral element (HEX8). A 26 μm × 26 μm area is enlarged to better visualize the mesh. (c) The ux(θ) and uy(θ) displacement components obtained from ex vivo inflation tests were applied on the side surface (blue surface). The uz(r, θ, z) displacements were applied on the anterior and posterior surfaces to represent the out-of-plane movement (red surfaces). (d) The resulting contour plot of the uz displacement component obtained from FE simulation, the displacement was enlarged by 10 times for visualization.
Fig. 2:
Fig. 2:
Determining the displacement boundary conditions from ex vivo inflation test data. (a) A contour plot of the thickness averaged ux response to a 20 mmHg IOP increase calculated by DVC. The x and y directions are aligned with the NT and IS axes of the AL, respectively. (b) An 8 μm-thick ring was traced along the boundary of the DVC correlation volume. The boundary region is overlaid onto the maximum intensity projection of a two-photon fluorescent image volume of the AL of the inflation-tested specimen. The ring was divided into 360 sector volumes. The volume-averaged displacement components were calculated for each sector and the result was normalized by the average diameter of the AL. (c) A fourth-order polynomial function was fit to the average normalized ûx (θ), while (d) a fifth-order polynomial function was fit to the average normalized ûy (θ).
Fig. 3:
Fig. 3:
Determining the z-displacement boundary conditions from ex vivo inflation test data. (a) A contour plot of the uz displacement of an inflation-tested specimen with the lowest uz error at a distance 30μm from the most anterior point calculated by DVC. (b) The uz at z = 30μm and z = 34μm were interpolated using the least square method to fill in areas removed by the low correlation coefficient, the x and y directions were constrained to align with the NT and IS axes, respectively, of the test specimen. The uz was stored in polar coordinates as uz(r, θ, z). (c) The uz(r, θ, z) map was resized to match the size of an AL model by multiplying the r-coordinates by the ratio between the average diameter of the AL model and that of the inflation test specimen. The resulting scaled ûz(r, θ, z) at z = 30μm was applied to each node on the anterior surface of the AL models according to the r and θ direction. The ûz(,θ, z) at z = 34μm was applied to the posterior surface of the AL models in the same manner.
Fig. 4:
Fig. 4:
Input and output variables for the Gaussian process regression model.
Fig. 5:
Fig. 5:
Comparison of the normal strains from the FE simulations for the AL of mouse 1 for Poisson’s ratio ν of (a) 0.2, (b) 0.3, (c) 0.4 and (d) 0.495 to the experimental DVC strain calculations (red). The in-plane strain Exx and Eyy were not sensitive to ν. The Ezz became more compressive with larger ν and was closest to the experimental median when ν = 0.2. The box plots included data points from elements of the astrocyte processes of mice 1 that were within 3 times the interquartile range.
Fig. 6:
Fig. 6:
Color contour plots of the strain field in the astrocyte processes from FE simulations for mouse 1, showing (a) Exx, (b) Eyy, (c) Ezz, (d) Exy, (e) Eyz, (f) Exz, (g) Emax, and (h) γmax averaged through the thickness. (i) Bar chart comparing the 8 average strain outcomes (n = 6). All strain outcomes were significantly different from Exx (p < 0.01). Higher Exx occurred in horizontally aligned processes (a), while higher Eyy occurred in long vertically aligned processes (b). Higher Emax and γmax appeared at regions directly adjacent to the axonal compartments. Scale bar = 50 μm.
Fig. 7:
Fig. 7:
Color contour plots of (a) Emax, (b) γmax, (c) σmax, and (d) τmax for a 26 × 26 μm2 region near the center of the AL as indicated in Figure 1b.
Fig. 8:
Fig. 8:
Comparison between the specimen-averaged mechanical responses in the axonal compartments (blue) and the astrocyte processes (yellow, n = 6). Bar charts showing (a) the magnitudes of Exx, Eyy, Ezz, Exy, Emax, γmax were higher in the axonal compartments than in the astrocyte processes (p <0.05). (b) The maximum principal stress, σmax, in the axonal compartments was on average 1800 times and 2100 times lower than in the GFAP and actin materials (p < 0.01).
Fig. 9:
Fig. 9:
Goodness of fit for the structure-strain models. (a) The Emax in the axonal compartments from FE simulation of the AL of mouse 1. (b) Plot of the maximum Emax in each axonal compartment from FE simulations of the 6 ALs and from the structure-strain model to evaluate the goodness of fit for the structure-strain model. The solid line has a slope of 1 to denote a perfect fit.
Fig. 10:
Fig. 10:
The effect of structural features on the pressure-induced strains in the axonal compartments from the GPR structure-strain fit to the 6 FE models of the AL. (a) Emax increased by more than 14 times as area of the axonal compartment increased by 21 times. (b) Orienting the major axis of the axonal compartments to the 90° IS axis instead of the 0° NT axis increased Exx by 231% but (c) decreased Eyy by 160%. (d) Increasing local actin area fraction from 41% to 90% decreased Emax by 187%. (e) Axonal compartments that were closest to the center of the AL experienced 16% higher γmax than those that were at the boundary of the AL. (f) Axonal compartments in a 21% larger AL experienced 42% larger γmax.
Fig. 11:
Fig. 11:
The effect of structural features on the strains in the axonal compartments from GPR structure-strain fit to the FE model of the AL of mouse 1. (a) Emax increased by 4.8 times as the area of the axonal compartment increased by 16 times. (b) Orienting the major axis of the axonal compartments to the 90° IS axis instead of the 0° NT axis increased Exx by 245% but (c) decreased Eyy by 148%. (d) Increasing local actin area fraction from 52% to 87% decreased Emax by 98%. (e) Axonal compartments that were closest to the center of the AL experienced 53% higher γmax than those that were at the boundary of the AL.
Fig. 12:
Fig. 12:
The effect of structural features on the pressure-induced strains and stresses in the axonal compartments from the GPR structure-strain fit to the 6 incompressible FE models AL. (a) Emax increased by more than 21 times as the area of the axonal compartment increased by 21 times. (b) Orienting the major axis of the axonal compartments to the 90° IS axis instead of the 0° NT axis increased Exx by 606% but (c) decreased Eyy by 362%. (d) Increasing local actin area fraction from 41% to 90% decreased Emax by 137%. (e) Axonal compartments that were closest to the center of the AL experienced 13% higher γmax than those that were at the boundary of the AL. (f) Axonal compartments in a 21.4% larger AL experienced 3.2% larger γmax.

Similar articles

References

    1. Bar-Kochba E, Toyjanova J, Andrews E, et al. (2015) A fast iterative digital volume correlation algorithm for large deformations. Exp Mech 55(1):261–274
    1. Bellezza A, Hart R, Burgoyne C (2000) The optic nerve head as a biomechanical structure: initial finite element modeling. Invest Ophthalmol Vis Sci 41(10):2991–3000 - PubMed
    1. Bonet J, Wood R (1997) Nonlinear continuum mechanics for finite element analysis. Cambridge university press
    1. Burgoyne C (2015) The morphological difference between glaucoma and other optic neuropathies. J Neuroophthalmol 35(0 1):S8. - PMC - PubMed
    1. Campbell I, Coudrillier B, Mensah J, et al. (2015) Automated segmentation of the lamina cribrosa using frangi’s filter: a novel approach for rapid identification of tissue volume fraction and beam orientation in a trabeculated structure in the eye. J R Soc Interface 12(104):20141,009 - PMC - PubMed