. 2023 Sep:65:102838.
doi: 10.1016/j.redox.2023.102838. Epub 2023 Aug 9.

Regulation of DNA damage and transcriptional output in the vasculature through a cytoglobin-HMGB2 axis

Affiliations

Regulation of DNA damage and transcriptional output in the vasculature through a cytoglobin-HMGB2 axis

Clinton Mathai et al. Redox Biol. 2023 Sep.

Abstract

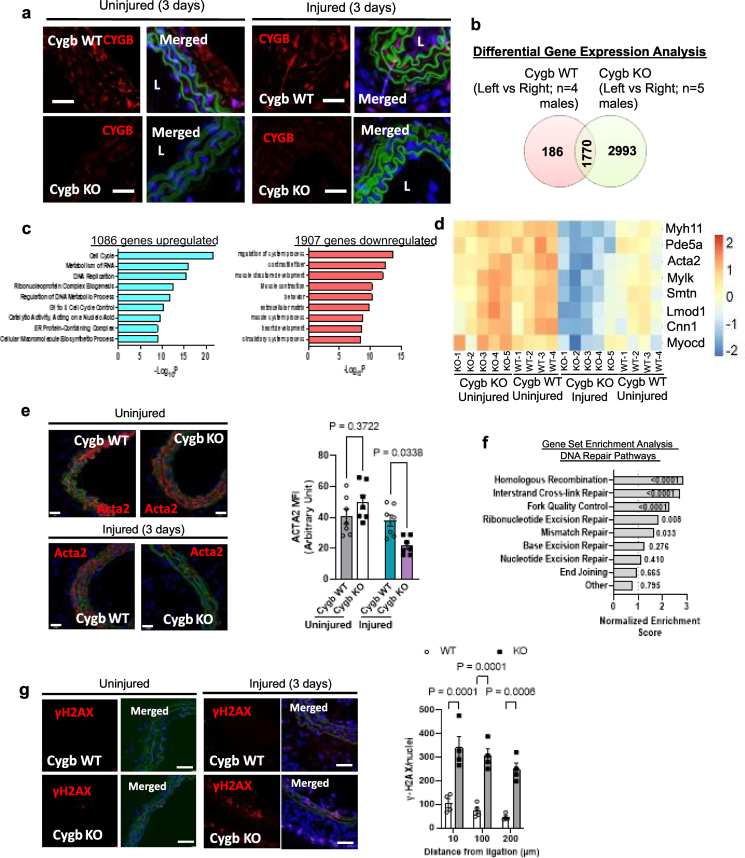
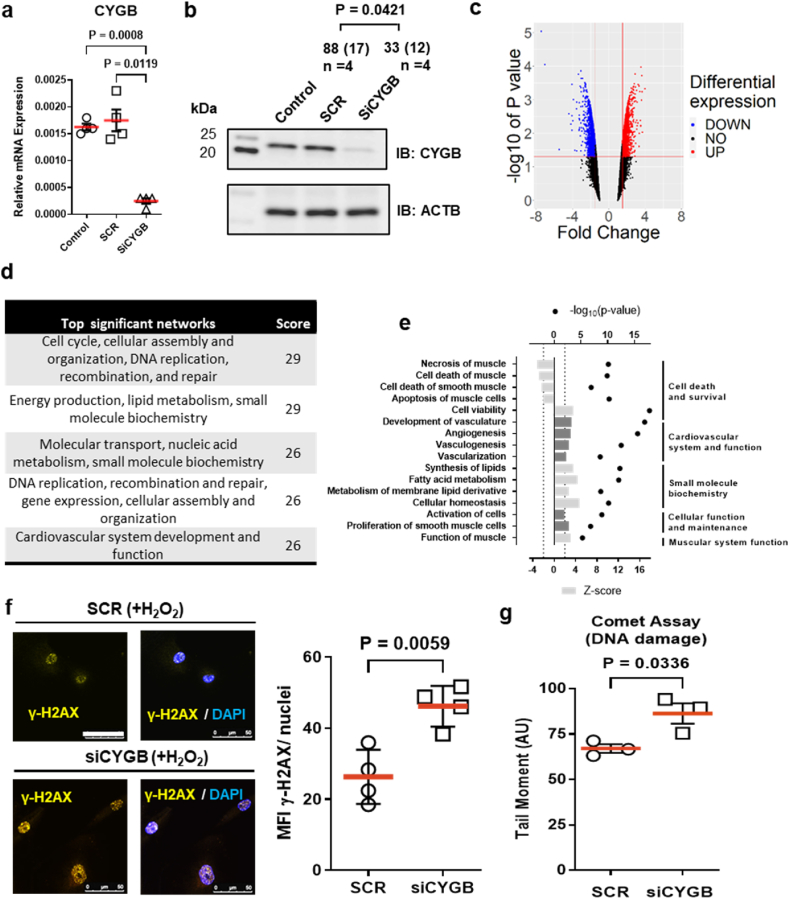
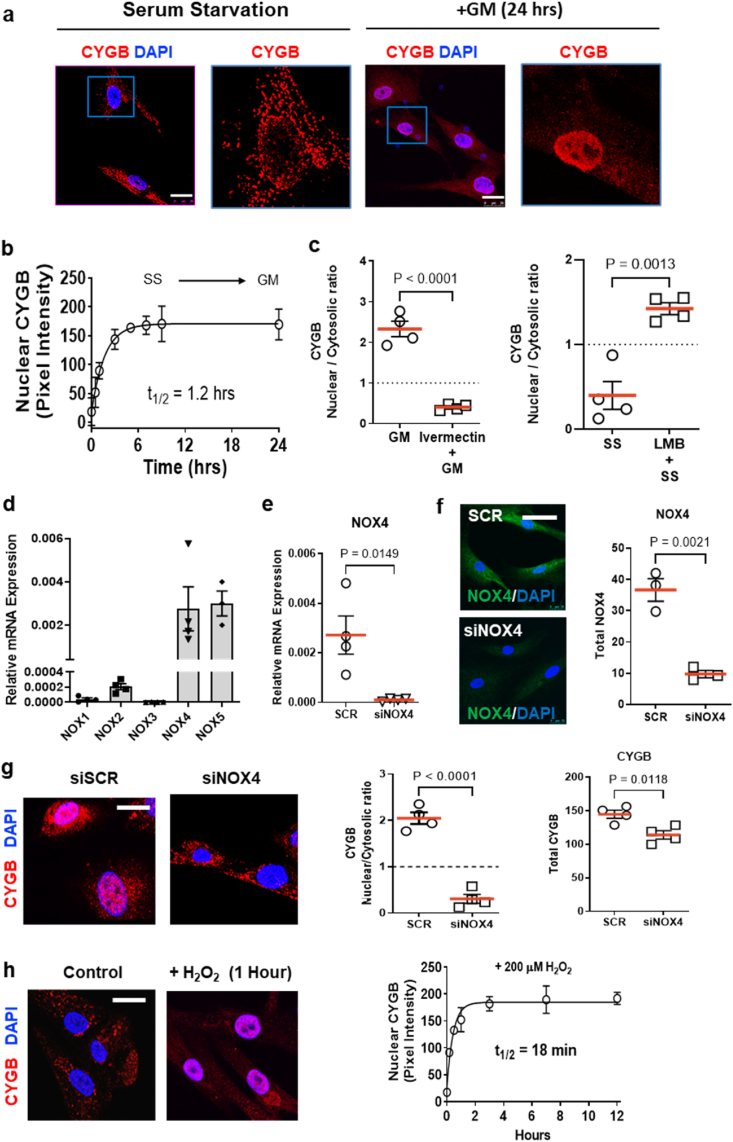
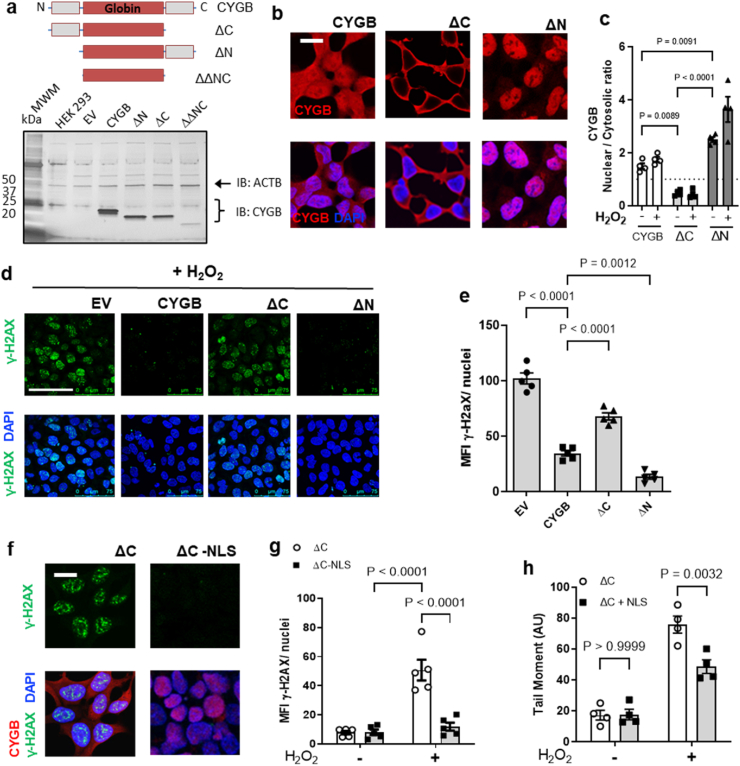
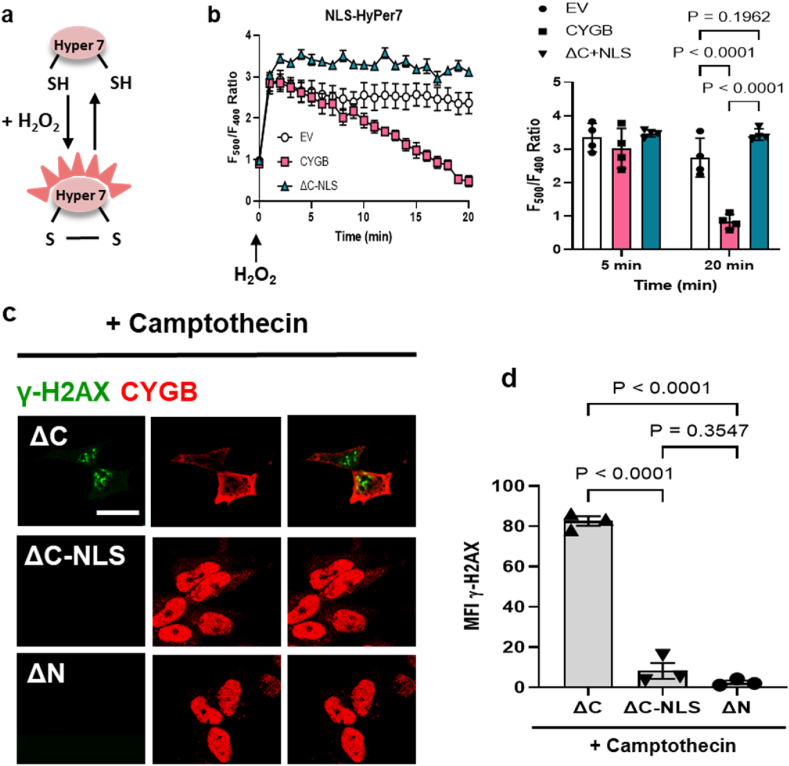
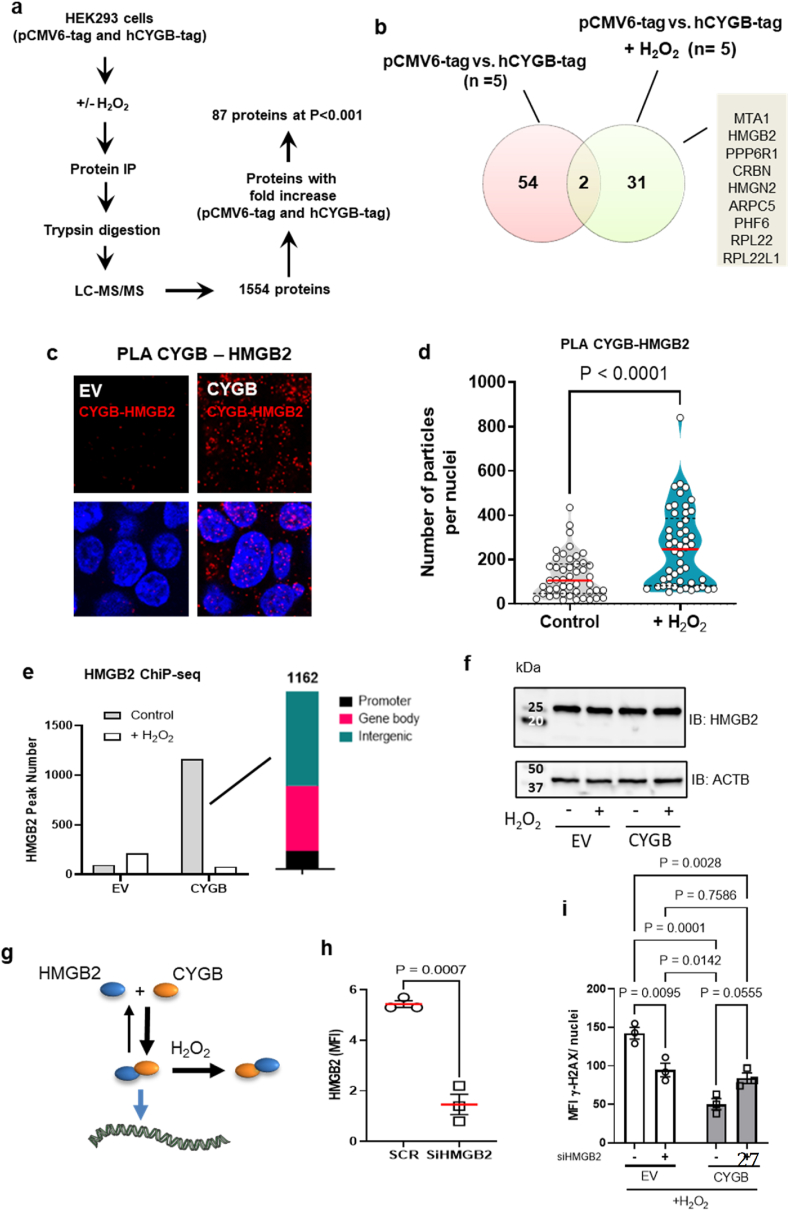
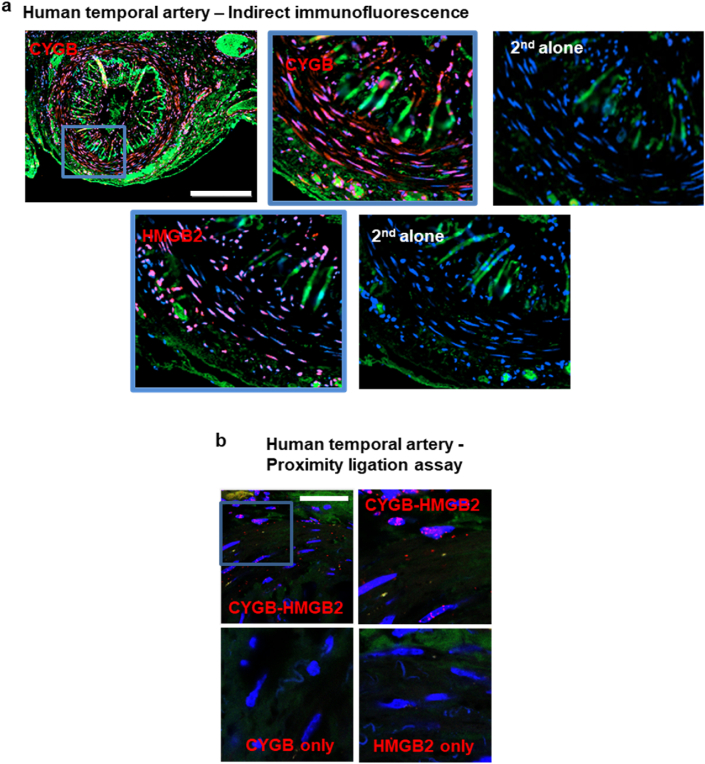
Identifying novel regulators of vascular smooth muscle cell function is necessary to further understand cardiovascular diseases. We previously identified cytoglobin, a hemoglobin homolog, with myogenic and cytoprotective roles in the vasculature. The specific mechanism of action of cytoglobin is unclear but does not seem to be related to oxygen transport or storage like hemoglobin. Herein, transcriptomic profiling of injured carotid arteries in cytoglobin global knockout mice revealed that cytoglobin deletion accelerated the loss of contractile genes and increased DNA damage. Overall, we show that cytoglobin is actively translocated into the nucleus of vascular smooth muscle cells through a redox signal driven by NOX4. We demonstrate that nuclear cytoglobin heterodimerizes with the non-histone chromatin structural protein HMGB2. Our results are consistent with a previously unknown function by which a non-erythrocytic hemoglobin inhibits DNA damage and regulates gene programs in the vasculature by modulating the genome-wide binding of HMGB2.

Keywords: Carotid artery; Cytoglobin; DNA damage; DNA repair pathways; Hemoglobin; Hydrogen peroxide; Reactive oxygen species; Redox signal; Smooth muscle.


Conflict of interest statement

Declaration of competing interest JJC is a consultant for Thermo Fisher Scientific, 908 Devices, and Seer.

Figures

Fig. 1
Fig. 1
Global deletion of cytoglobin in the mouse accelerates the decrease in smooth muscle contractile genes and activation of DNA repair pathways in the carotid artery ligation model. (a) Representative immunofluorescence staining of the right (uninjured) and left (injured) common carotid arteries of cytoglobin wildtype (WT) and knockout (KO) littermate mice 3-days post-ligation, harvested and analyzed for cytoglobin content (red – CYGB, blue – DAPI, green – autofluorescence marking elastic lamina). Cytoglobin immunostaining was evident in the media and adventitia (top) and lost in the KO mice; scale bar, 40 μm. (b) Results from bulk RNA-Seq analysis of the entire left (injured) and right (uninjured) common carotid arteries from mice that underwent left common artery ligation for 3 days. 2993 genes differentially changed in the injured cytoglobin knockout mice (n = 5) were isolated from differential gene expression analysis of wildtype injured (Left) and uninjured (Right) vessels (n = 4) and cytoglobin knockout injured and uninjured (n = 5; 1.5 - fold change FDR <0.05). (c) Top down- and up-regulated pathways from gene ontology analysis of the 2993 genes altered in the differential gene expression analysis. (d) Heat map comparing smooth muscle cell contractile genes in CYGB-WT and CYGB-KO mice 3 days after left common carotid artery ligation. Each individual square represents the z-score value of the count obtained for the selected gene from one individual mouse using the combined bulk RNA-seq results from the right (uninjured) and left (injured) common carotid arteries of cytoglobin wildtype (WT, n = 4) and knockout (KO, n = 5) littermate mice 3-days post-ligation. (e) Representative immunofluorescence images and fluorescence quantitation from CYGB-WT and CYGB-KO carotids probing for ACTA2, 3 days after ligation; scale bar, 50 μm. (f) Gene set enrichment analysis based on a curated set of 197 DNA damage factors associated with DNA repair pathways; The number for each bar represents the nominal P value for each pathway. (g) Indirect immunofluorescence staining for the marker of DNA repair activation γH2AX (phosphorylated histone 2AX) of uninjured (right common) and injured (left common) mouse carotid arteries 3-days post ligation (red – γH2AX, blue – DAPI, green – autofluorescence marking elastic lamina); scale bar, 100 μm. Right panel, quantitation of results. For statistical analysis throughout the figure, results were analyzed by two-way ANOVA, followed by Tukey's post hoc test. (For interpretation of the references to color in this figure legend, the reader is referred to the Web version of this article.)
Fig. 2
Fig. 2
Decrease in cytoglobin expression in human smooth muscle cells alters gene expression and increases hydrogen peroxide-induced DNA damage in vitro. (a) Quantitative reverse transcriptase polymerase chain reaction (qRT-PCR) results showing the relative expression of cytoglobin (CYGB) in sub-cultured human vascular smooth muscle cells following silencing of cytoglobin. Human smooth muscle cells were electroporated with scrambled SiRNA (SCR) or siRNA mix targeting CYGB (SiCYGB). Results from non-transfected cells are also shown (Control). (b) Western blot shows protein levels of CYGB using conditions described in (a); values represent the mean and (SEM) of the percentage change in CYGB immunoreactivity compared with non-transfected conditions (Control) using ACTB as an internal reference (n = 4). (c) Volcano plot of the differential gene expression analysis following silencing of CYGB in human vascular smooth muscle cells. (d) Top 5 significant networks for disease and function from transcriptomic results following CYGB silencing in sub-cultured human vascular smooth muscle cells was generated with QIAGEN Ingenuity Pathway Analysis (IPA). (e) The IPA regulation z-score was used to identify diseases and functions that are either increased (z-score ≥ 2) or decreased (z-score <=-2) and the p-value calculated with the Fischer's exact test indicates the likelihood that the association between a set of genes and a biological function is significant. (f) Representative immunofluorescence images of yH2AX (yellow) without (left) or with (right) DAPI staining in human vascular smooth muscle cells electroporated with scrambled SiRNA (SCR) or siRNA mix targeting CYGB (SiCYGB) for 72 h followed by treatment with hydrogen peroxide for 10 min; scale bar 50 μm. The right-side figure is quantification of results from 4 independent experiments. (g) Comet assay was performed under alkaline unwinding/neutral electrophoresis conditions and quantified (n = 3). Throughout the figure, data are presented as mean±SEM; p values were determined by Student's t-test or one way ANOVA. Red bars represent the mean for each condition. (For interpretation of the references to color in this figure legend, the reader is referred to the Web version of this article.)
Fig. 3
Fig. 3
The hydrogen peroxide producing NADPH oxidase 4 (NOX4) promotes the active trafficking of cytoglobin to the nucleus in human vascular smooth muscle cells. (a) Representative confocal immunofluorescence images of sub-cultured human vascular smooth muscle cells following 0-, and 24-h stimulation with 5% serum containing growth media (Blue – DAPI, red – CYGB). Cells were then fixed and analyzed by indirect immunofluorescence using an antibody against cytoglobin; scale bars, 25 μm. (b) Time course of cytoglobin nuclear import following the addition of 5% serum containing growth media. The solid line represents the non-linear regression obtained from a single exponential model yielding a half-life 1.2 h; n = 4. (c) Quantitative analysis of the ratio of nuclear to cytosolic cytoglobin (CYGB) pixel intensity after pre-treatment with ivermectin (nuclear import inhibitor, left panel) or Leptomycin B (right panel, LMB – nuclear export inhibitor). A ratio greater than 1 is indicative of nuclear accumulation. (d) Quantitative reverse transcriptase polymerase chain reaction (qRT-PCR) results showing the relative expression for NADPH oxidase (NOX) isoforms in sub-cultured human vascular smooth muscle cells. (e) Quantitative reverse transcriptase polymerase chain reaction (qRT-PCR) results showing the relative expression of NADPH oxidase 4 (NOX4). Human smooth muscle cells were electroporated with scrambled SiRNA (SCR) or siRNA mix targeting NOX4. Each individual symbol represents an independent experiment. (f) Left panel, representative indirect immunofluorescence pictures of human vascular smooth muscle cells stained for NOX4 following silencing of NOX4 as described in panel (e); bar scale, 50 μm. Right panel, quantitation of experiments shown in left panel. (g) Left panel, representative indirect immunofluorescence pictures of human vascular smooth muscle cells stained for cytoglobin following silencing of NOX4 as described in panel (e); bar scale 20 μm. Center panel, quantitative pixel analysis of the ratio of nuclear to cytosolic cytoglobin (CYGB) pixel intensity following silencing of NOX4. Right panel, quantitative pixel analysis of total cytoglobin (CYGB) pixel intensity following silencing of NOX4. (h) Right panel, representative indirect immunofluorescence pictures of serum-starved (control) human vascular smooth muscle cells stained for cytoglobin following treatment with 200 μM hydrogen peroxide (+H2O2) for 1 h. Right panel, time course of cytoglobin nuclear import following the addition 200 μM hydrogen peroxide as described for left panel. The line represents the non-linear regression derived from a single exponential model yielding a half-life 18 min; n = 4; p values were determined by Student's t-test or one way ANOVA, followed by Tukey's post hoc test. Red bars represent the mean for each condition and error bars represent SEM. (For interpretation of the references to color in this figure legend, the reader is referred to the Web version of this article.)
Fig. 4
Fig. 4
Nuclear cytoglobin is sufficient to inhibit DNA damage. (a) Top panel, schematic of the primary sequence of cytoglobin composed of a central globin domain and two unique 20 amino acid C- and N-terminal ends. Cytoglobin expression plasmids were generated for full length cytoglobin, and the N and C terminal truncated variants. Expression from the different plasmid in HEK293 was examined by Western blot. The double truncated variant did not express consistently. ACTAB is shown as a loading control. (b) Indirect immunofluorescence staining using an antibody directed against cytoglobin (red). (c) Quantitative analysis of the ratio of nuclear to cytosolic cytoglobin (CYGB) pixel intensity in HEK293 with plasmids expressing cytoglobin or empty plasmid (pcDNA) and treated with hydrogen peroxide. (d) Representative immunofluorescence images of γ-H2AX (green) staining in HEK293 expressing cytoglobin or empty plasmid following treatment with 200 μM hydrogen peroxide. (e) Quantitation of the mean fluorescence intensity of γ-H2AX per nuclei following 200 μM hydrogen peroxide treatment. (f) Representative immunofluorescence images of HEK293 cells expressing cytoglobin with C-terminal truncation and C-terminal truncation + nuclear localization sequence (NLS) exposed to 200 μM hydrogen peroxide and stained for γ-H2AX (green), DAPI (blue) and CYGB (red). (g) Quantitative analysis of γ-H2AX pixel intensity from results described in (f). Each point represents an independent experiment. (h) Quantitation of COMET tail moment from alkaline COMET assay in HEK C-terminal truncation and HEK C-terminal truncation + NLS exposed to 200 μM hydrogen peroxide. For statistical analysis throughout the figure, results were analyzed by one-way or two-way ANOVA followed by Tukey's post hoc test for multiple comparisons. (For interpretation of the references to color in this figure legend, the reader is referred to the Web version of this article.)
Fig. 5
Fig. 5
Cytoglobin inhibits DNA damage independent of its reductive activity. (a) Schematic representation of the hydrogen peroxide sensor Hyper7. It contains a pair of cysteine residues that can be reversibly oxidized by hydrogen peroxide leading to changes in its fluorescence properties (b) HEK293 cells stably transfected with pcDNA (empty vector), hCYGB (human cytoglobin) and ΔC-NLS (C-terminal truncation with nuclear localization sequence) plasmids were transiently transfected with HyPer7 with targeted NLS. Cells were then treated with 200 μM bolus hydrogen peroxide and Hyper7 oxidation was measured over 20 min. Right panel, bar graph of fluorescence ratios for Hyper7, 5 and 20 min after the addition of hydrogen peroxide. (c) Representative immunofluorescence images of C-terminal truncated, C-terminal truncated + NLS and N-terminal truncated CYGB variants pre-treated with 50 μM camptothecin (CPT – topoisomerase inhibitor, oxidant-independent inducer of DNA damage) for 1 h and immunostained for γ-H2AX (green) and CYGB (red); scale bar, 40 μm. (d) Quantitative analysis of γ-H2AX pixel intensity. Each point represents one independent experiment. For statistical analysis throughout the figure, results were analyzed by two-way ANOVA, or one way ANOVA followed by Tukey's post hoc test. (For interpretation of the references to color in this figure legend, the reader is referred to the Web version of this article.)
Fig. 6
Fig. 6
Cytoglobin regulates HMGB2 genome wide binding. (a) Schematic of the immunoprecipitation and mass spectrometry approach used to identify cytoglobin-interacting proteins in HEK293 cells stably expressing empty (pCMV6-tag) and hCYGB-tag vectors. (b) Venn diagram showing limited overlap of cytoglobin protein interactors between control and hydrogen peroxide treated samples. 54 proteins were interacting with CYGB before hydrogen peroxide addition and 31 proteins after hydrogen peroxide treatment. Subsequent analysis yielded several cytoglobin nuclear-associated proteins obtained from Co-IP MS/MS in hydrogen peroxide treated conditions. (c) Representative immunofluorescence images of proximity ligation assay for CYGB and HMGB2 in HEK293 cells with or without stable expression of cytoglobin (hCYGB); scale bar, 30 μm. (d) Quantitation of proximity ligation assay signal (number of nuclear particles per nuclei) of HEK293 cells stabling expressing empty vector (pCDNA) and human cytoglobin (hCYGB) following hydrogen peroxide treatment for 10 min. (e) HMGB2 ChiP-seq in pCDNA and hCYGB HEK 293 cells with or without treatment with hydrogen peroxide showing increase in HGMB2-genome wide binding in the presence of cytoglobin and loss of binding after treatment with hydrogen peroxide. Right panel: Peak position (in % peaks) of the ChiP analysis of HMGB2 (f) Western blot analysis of lysates from pCDNA (empty vector) and human cytoglobin (hCYGB) with and without hydrogen peroxide treatment probed for HMGB2 (24 kDa and β-Actin (ACTB, loading control, 40 kDa). (g) Cytoglobin heterodimerization is associated with an increase in HMGB2 genome-wide binding. Hydrogen peroxide (H2O2) increases cytoglobin-HMGB2 heterodimerization but inhibits HMGB2 genome-wide binding. (h) Quantitative analysis of HMGB2 mean fluorescence intensity (MFI) following HMGB2 silencing with siRNA targeting HMGB2 (SiHMGB2) or scrambled siRNAs (SCR); data are presented as±SEM; p values were determined by unpaired Student's t-test. (i) HMGB2 was silenced in pCDNA (empty vector) and hCYGB (CYGB expressing) HEK cells, treated with 200 μM bolus hydrogen peroxide, and quantitated for %cells positive with γ-H2AX. Data are presented as±SEM; p values were determined by two-way ANOVA followed by Tukey's post hoc test for multiple comparisons.
Fig. 7
Fig. 7
Cytoglobin and HMGB2 heterodimerizes in human vessels. (a) Human temporal artery samples were obtained, and indirect confocal immunofluorescence was performed for CYGB and HMGB2. Bar scale, 300 μm. (b) Proximity ligation assay for CYGB and HMGB2 from human temporal arteries; scale bar, 50 μm.

Update of

References

    1. Schechter A.N. Hemoglobin research and the origins of molecular medicine. Blood. 2008;112:3927–3938. doi: 10.1182/blood-2008-04-078188. - DOI - PMC - PubMed
    1. Qiu Y., Sutton L., Riggs A.F. Identification of myoglobin in human smooth muscle. J. Biol. Chem. 1998;273:23426–23432. - PubMed
    1. Straub A.C., et al. Endothelial cell expression of haemoglobin alpha regulates nitric oxide signalling. Nature. 2012;491:473–477. doi: 10.1038/nature11626. - DOI - PMC - PubMed
    1. Halligan K.E., Jourd'heuil F.L., Jourd'heuil D. Cytoglobin is expressed in the vasculature and regulates cell respiration and proliferation via nitric oxide dioxygenation. J. Biol. Chem. 2009;284:8539–8547. doi: 10.1074/jbc.M808231200. - DOI - PMC - PubMed
    1. Smagghe B.J., Trent J.T., 3rd, Hargrove M.S. NO dioxygenase activity in hemoglobins is ubiquitous in vitro, but limited by reduction in vivo. PLoS One. 2008;3 doi: 10.1371/journal.pone.0002039. - DOI - PMC - PubMed

Publication types

LinkOut - more resources