. 2023 Oct 15:280:120312.
doi: 10.1016/j.neuroimage.2023.120312. Epub 2023 Aug 11.

Quantitative MRI reveals widespread, network-specific myelination change during generalized epilepsy progression

Affiliations

Quantitative MRI reveals widespread, network-specific myelination change during generalized epilepsy progression

Gustavo Chau Loo Kung et al. Neuroimage. .

Abstract

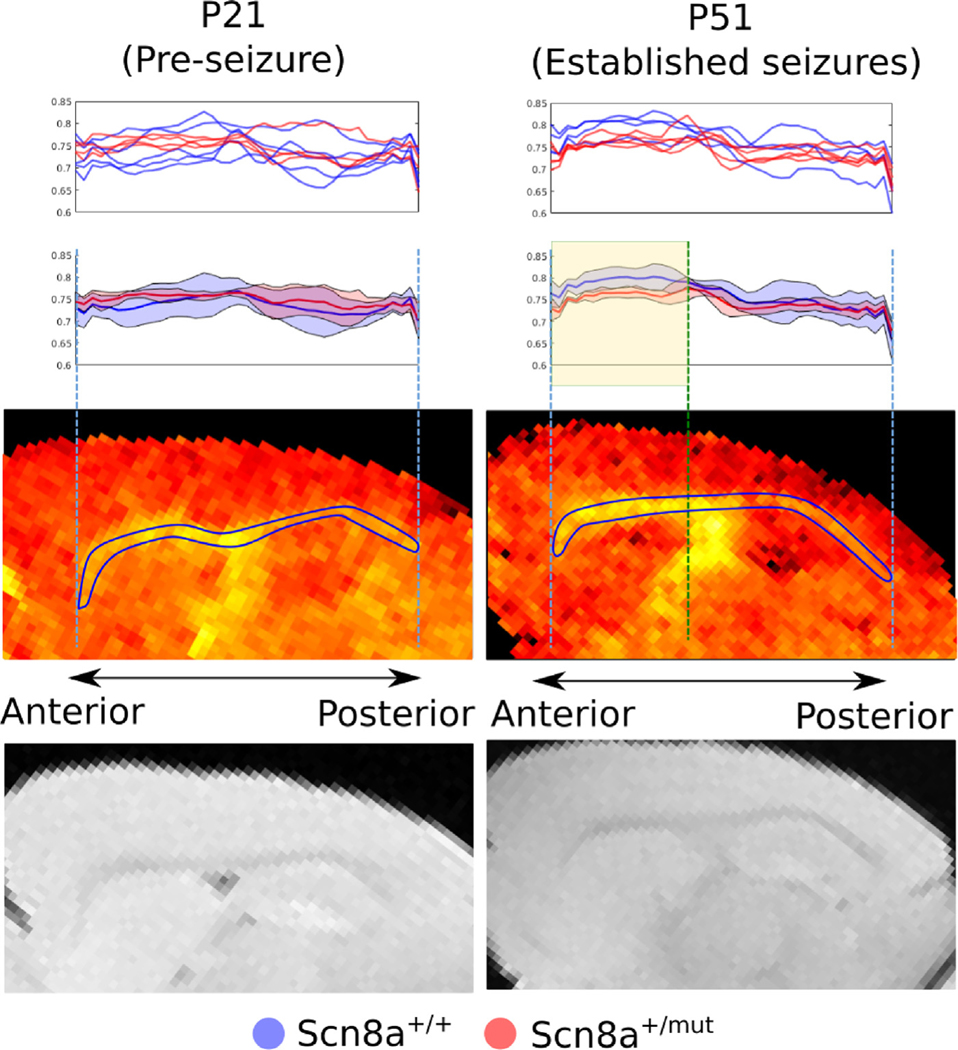
Activity-dependent myelination is a fundamental mode of brain plasticity which significantly influences network function. We recently discovered that absence seizures, which occur in multiple forms of generalized epilepsy, can induce activity-dependent myelination, which in turn promotes further progression of epilepsy. Structural alterations of myelin are likely to be widespread, given that absence seizures arise from an extensive thalamocortical network involving frontoparietal regions of the bilateral hemispheres. However, the temporal course and spatial extent of myelin plasticity is unknown, due to limitations of gold-standard histological methods such as electron microscopy (EM). In this study, we leveraged magnetization transfer and diffusion MRI for estimation of g-ratios across major white matter tracts in a mouse model of generalized epilepsy with progressive absence seizures. EM was performed on the same brains after MRI. After seizure progression, we found increased myelination (decreased g-ratios) throughout the anterior portion (genu-to-body) of the corpus callosum but not in the posterior portion (body-splenium) nor in the fornix or the internal capsule. Curves obtained from averaging g-ratio values at every longitudinal point of the corpus callosum were statistically different with p<0.001. Seizure-associated myelin differences found in the corpus callosum body with MRI were statistically significant (p = 0.0027) and were concordant with EM in the same region (p = 0.01). Notably, these differences were not detected by diffusion tensor imaging. This study reveals widespread myelin structural change that is specific to the absence seizure network. Furthermore, our findings demonstrate the potential utility and importance of MRI-based g-ratio estimation to non-invasively detect myelin plasticity.

Keywords: Myelination; Quantitative MRI; Seizure; g-ratio.


Conflict of interest statement

Declaration of competing interest None.

Figures

Fig. 1.
Fig. 1.
Summary of MRI processing pipeline. Abbreviations: MT: Magnetization transfer, SR: Saturation-recovery, BPF: Bound pool fraction, AVF: Axon volume fraction, MVF: Myelin volume fraction, fiso: isotropic fraction, fic: intraneurite fraction, NODDI: neurite orientation and dispersion density imaging.
Fig. 2.
Fig. 2.
Regions of interest that were analyzed with MRI and/or EM.
Fig. 3.
Fig. 3.
White matter tracts evaluated with MRI are shown in relation to cortical and thalamic regions that are involved in the absence seizure network. These schematics wereResults created using the Scalable Brain Atlas (Bakker et al., 2015) and Allen mouse brain atlas (Allen, 2009).
Fig. 4.
Fig. 4.
Sample images showing MRI-derived g-ratio maps for a P51 Scn8a+/+ mouse (a) and a P51 Scn8a+/mut mouse (c). The region of the callosal body from which EM samples were taken is indicated with a blue square. Representative EM images are shown for Scn8a+/+ (b) and Scn8a+/mut mice (d), respectively.
Fig. 5.
Fig. 5.
Top: Correlation plots for MRI-derived g-ratios and EM-derived g-ratios for genu, body and splenium of the corpus callosum of P51 mice. Scn8a+/+ mice are shown in blue and Scn8a+/mut mice in red. The best fit line is shown (black, dashed line) with the concordance correlation coefficient (ρc) and 95% confidence intervals. Bottom: Bland-Altman plots showing the agreement between measurements in the three regions. Scn8a+/+ mice are shown in blue and Scn8a+/mut mice in red.
Fig. 6.
Fig. 6.
MRI and EM measurements of g-ratio in the genu, body and splenium at P51 with Scn8a+/+ mice in blue (n = 4) and Scn8a+/mut mice with established seizures shown in red (n = 5). Each dot represents the mean g-ratio for one mouse; bars represent the mean and one standard deviation. P-values obtained with a two-tailed t-test comparing Scn8a+/+ and Scn8a+/mut group g-ratios are shown. Adjusted significance thresholds are 0.017 for MRI and 0.025 for EM.
Fig. 7.
Fig. 7.
Correlation between MRI-derived MVF and EM-derived myelin sheath thickness in the genu, body and splenium of the corpus callosum of P51 mice. Scn8a+/+ mice are shown in blue and Scn8a+/mut mice in red. The best fit line is shown (black, dashed line) along with the concordance correlation coefficient (ρ) and 95% confidence intervals.
Fig. 8.
Fig. 8.
Comparison of EM-derived myelin sheath thickness and MRI-derived MVF in the genu, body and splenium at P51 (established seizure timepoint) with Scn8a+/+ mice in blue (n = 4) and Scn8a+/mut mice in red (n = 5) (Each dot represents the mean for one mouse; bars indicate group means and one standard deviation). P-values obtained by comparing means for Scn8a+/+ and Scn8a+/mut groups with two-tailed t-tests are shown. Adjusted significance threshold is 0.017 for both MRI and EM.
Fig. 9.
Fig. 9.
MRI measurements of g-ratio across multiple white matter tracts in mice with established seizures P45/P51 (top panels) or prior to seizure onset P21 (bottom panels). Each dot represents the mean g-ratio for one mouse, and the bars indicate the group mean and one standard deviation. P-values obtained with a two-tailed t-test comparing Scn8a+/+ and Scn8a+/mut groups are shown for values below 0.05. Adjusted significance threshold is 0.013 for P51 and 0.01 for P21.
Fig. 10.
Fig. 10.
Mean and standard deviation curves of MRI measurements of g-ratio across the longitudinal extent of midline corpus callosum before seizures (P21) and after established seizures (P51). Representative brain slices are shown for spatial reference with the corpus callosum outlined in blue. The yellow highlight indicates the approximate anterior region where the g-ratio of Scn8a+/mut mice is lower. Corresponding T1 images are shown for reference at the bottom. The P51 brain corresponds to a Scn8a+/+ mouse and the P21 corresponds to a Scn8a+/mut mouse.
Fig. 11.
Fig. 11.
Mean and standard deviation curves of MRI measurements across the longitudinal extent of the corpus callosum for P51 mice with established seizures.

References

    1. Allen P, 2009. Allen Mouse Brain Atlas. Allen Institute for Brain Science.
    1. Altman D, Bland J, 1983. Measurement in medicine: the analysis of method comparison studies. J. R. Stat. Soc. Ser. D (Stat.) 32 (3), 307–317.
    1. Bakker R, Tiesinga P, Kötter R, 2015. The scalable brain atlas: instant web-based access to public brain atlases and related content. Neuroinformatics 13, 353–366. - PMC - PubMed
    1. Baudo M, Colombo E, Pérez M, Rahn S, Domenech N, Chuang J, Forlizzi V, Buosi P, Baldoncini M, Bendersky M, 2022. Three-dimensional anatomy of the anterior commissure: tractography and anatomical study. World Neurosurg. 159, e365–e374. - PubMed
    1. Brodovskaya A, Batabyal T, Shiono S, Sun H, Kapur J, 2022. Distinct roles of rodent thalamus and corpus callosum in seizure generalization. Ann. Neurol 91 (5), 682–696. - PMC - PubMed

Publication types