The two-step cargo recognition mechanism of heterotrimeric kinesin
- PMID: 37575008
- PMCID: PMC10626431
- DOI: 10.15252/embr.202356864
The two-step cargo recognition mechanism of heterotrimeric kinesin
Abstract
Kinesin-driven intracellular transport is essential for various cell biological events and thus plays a crucial role in many pathological processes. However, little is known about the molecular basis of the specific and dynamic cargo-binding mechanism of kinesins. Here, an integrated structural analysis of the KIF3/KAP3 and KIF3/KAP3-APC complexes unveils the mechanism by which KIF3/KAP3 can dynamically grasp APC in a two-step manner, which suggests kinesin-cargo recognition dynamics composed of cargo loading, locking, and release. Our finding is the first demonstration of the two-step cargo recognition and stabilization mechanism of kinesins, which provides novel insights into the intracellular trafficking machinery.
Keywords: Cargo binding; Intracellular transport; KIF3; Kinesin; Protein dynamics.
© 2023 The Authors.
Conflict of interest statement
The authors declare that they have no conflict of interest.
Figures

- A
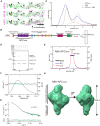
Cartoon representation of the structure of the KIF3/KAP3 complex (upper panel); schematic diagrams showing the major constructs used for biochemical analysis (bottom panel), which are tagged by 6 × His or GST for different uses. ACT: KIF3A residues 481–701; BCT: KIF3B residues 472–747.
- B
SEC‐MALS analysis of the KIF3/KAP3 complex. ABK indicates the reconstructed KIF3/KAP3 (KIF3‐ACT/BCT/KAP3) protein. The MW of the complex was found to be 145 kDa, which is close to the theoretical calculation with a 1:1:1 binding ratio. The SDS–PAGE result of the reconstructed complex is shown on the right side.
- C
Rg and I(0) versus number of diffraction frames from SEC‐SAXS experiment measuring the ABK. Rg is indicated by open circles, within which the green spots indicate the data range used for subsequent modeling analysis.
- D
Evaluation of the experimental (colored in green) and theoretical (colored in black) SAXS profiles with the χ2 value of 0.107 for ABK.
- E
SAXS‐based structural outline of ABK. Dmax was examined to be 270 Å. ABK exhibited an elongated conformation with the coiled‐coil domain shown on the lower side and the KIF3 tail‐KAP3 region (Docking domain) shown on the upper side. Potential cargo‐binding pocket was observed in the docking domain.

- A–C
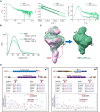
Experimental profiles (A), Guinier plots (B) and dimensionless Kratky plots (C) of the SAXS measurements of ABK comparing the ascent and decent sides of the peak. The chromatogram results show that the Rg between the ascent and descent sides of the peak are different. The shape of the scattering profile on the ascent side of the peak differs from that of the descent side of the peak, where the Rg value is stable. Guinier plot indicates a rise of the scattering profile on the small angle region. Based on the above results, the ascent side of the peak contains an oligomeric component, making it difficult to obtain a single structure. Thus, we calculated the structure using only the descent side of the peak.
- D
Results of the DAMMIF modeling of ABK using the data from the descent side of the peak. The DAMMIF process involved calculating 20 individual structural models, which were then superimposed and analyzed using cluster analysis. One of the structures was excluded from subsequent calculations based on the normalized spatial discrepancy (NSD) score obtained during the superimposition process. Consequently, the remaining 19 models are presented. All the structures obtained here exhibited a characteristic formation of a C‐shaped upper part and a rod‐like lower part. These structures were averaged, and the excess portions of each structure relative to the average structure were filtered out to create an initial structure. This initial structure was used for the final DAMMIN calculation. The resulting structure from this process was considered as the final model.
- E
Docking simulation of APC armadillo‐repeat domain and β‐catenin structures (PDB codes: 3NMZ and 1I7X) into the possible cargo‐binding cavity of the ABK SAXS model. ABK: KIF3‐ACT/BCT/KAP3 complex.

- A
Colocalization analysis of KIF3A/B/KAP3 with APC by immunostaining of hippocampal primary neurons. Image of each channel before merging is presented in Fig EV2A.
- B
Diagrams showing functional domains of APC and the construct used in the biochemical assays. The SDS–PAGE result of the purified APCARM protein was shown in the right side.
- C
Analytic SEC analysis of the ABK‐APCARM binding.
- D
Pull‐down analysis of the binding of APCARM with KIF3/KAP3.
- E
SEC‐MALS evaluation of ABK‐APCARM complex.
- F
Rg and I(0) versus number of diffraction frames from SEC‐SAXS experiment measuring the ABK‐APCARM. Rg is indicated by open circles, within which the green spots indicate the data range used for subsequent modeling analysis.
- G
Evaluation of the experimental (colored in green) and theoretical (colored in black) SAXS profiles with the χ2 value of 0.075 for ABK‐APCARM.
- H
SAXS‐based structural outline of ABK‐APCARM. Dmax was examined to be 195 Å. APCARM: The armadillo‐repeat domain of APC.

- A
Representative images of the immunostaining of KIF3A, KIF3B, KAP3 and APC in the dendrite region of hippocampal primary neurons. Arrows indicate representative colocalizations between KIF3A/B/KAP3 complex and APC. Images shown here are used to generate merged images in Fig 2A.
- B
Pull‐down assay assessing the binding capability of KIF3/KAP3 complexes with APCARM. GST‐AA, GST‐BB, and GST‐AB indicate the GST‐tagged homodimeric ACT (KIF3A 481–701), homodimeric BCT (KIF3B 472–747), and heterodimeric ACT/BCT, respectively. The results were evaluated by CBB staining (top panel), and Western blot (bottom panel) using an anti‐6His antibody to probe His‐tagged KAP3 and APCARM.
- C
Results of the DAMMIF modeling of ABK‐APCARM. The DAMMIF process involved calculating 20 individual structural models, which were then superimposed and analyzed using cluster analysis. One of the structures was excluded from subsequent calculations based on the NSD score obtained during the superimposition process. Consequently, the remaining 19 models are presented. The molecular shapes obtained here all exhibit approximately spherical structures. These structures were averaged, and the excess portions of each structure relative to the average structure were filtered out to create an initial structure. This initial structure was used for the final DAMMIN calculation. The resulting structure from this process was considered the final model.

- A
Experimental profiles, Guinier plots, and dimensionless Kratky plots of the SAXS measurements of ABK and ABK‐APCARM complexes.
- B
Pair distribution function P(R) of the ABK and ABK‐APCARM complexes calculated using SAXS data.
- C
Superposition of SAXS models of ABK and ABK‐APCARM. Asterisks indicate the major structural discrepancy, and the arrowhead indicates the possible conformational change of the KIF3 coiled‐coil region upon APCARM binding.
- D
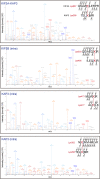
XL‐MS analysis of the interaction sites between KIF3/KAP3 and APCARM. Two crosslinked site pairs were found to correspond to the possible KIF3/KAP3‐APCARM binding region marked by asterisks in C. Cartoon diagrams, sequence alignment and LC–MS data are shown with crosslinked sites highlighted.


- A
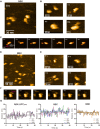
HS‐AFM imaging of KIF3/KAP3‐APC particles.
- B
Time lapse HS‐AFM images of a representative ABK‐APCARM particle with a continuous tapping force.
- C
Representative HS‐AFM images of ABK‐APCARM illustrating the dissociation dynamic. Continuous tapping of AFM triggered the dissociation of APCARM from ABK. Red arrows indicate the binding interface between ABK and ABK‐APCARM.
- D
Statistical analysis of the AFM‐based ABK and ABK‐APCARM particle conformations. Two hundred frames extracted from three independent AFM movies of ABK and ABK‐APCARM were used for the analysis. Distance from the coiled coil distal tip to the docking domain (length of the protrusion as shown by the dotted lines) was calculated and shown as violin plots. Data derived from each of the three movies were indicated by circles, triangles and rectangles, respectively. Based on the distal‐center distance, particle conformations were classified into three forms, L (cargo‐locked globular form), T (Transitional curved form) and D (cargo‐docked elongated form). Unpaired t‐test was used to evaluate the statistical significance. The solid and dotted lines indicate the median and quartiles, respectively. The AFM images shown here are re‐used in Fig 5A.

- A, B
HS‐AFM observation and representative particle images of ABK.
- C
Time lapse HS‐AFM images of a representative ABK particle.
- D, E
HS‐AFM observation and representative particle images of BBK.
- F
Time lapse HS‐AFM images of a representative BBK particle.
- G
Statistical analysis of the AFM‐based ABK, BBK and ABK‐APCARM particle conformations. Distance from the coiled coil distal tip to the docking domain (as shown in Fig 4D) was calculated and plotted against time. Data derived from each of the three movies were indicated by different colors. The dotted lines indicate the averages of each group. BBK: KIF3‐BCT/BCT/KAP3 complex.

- A
Integrated structural analysis of ABK and ABK‐APCARM using SEC‐SAXS, HS‐AFM and cryoEM. Similar structural outlines of the cargo‐free ABK from the three distinct analyses are shown in the left side, and the cargo‐binding cavity is marked by black arrowhead. Paralleled conformations of ABK‐APCARM corresponding to forms D, T and L, which are also presented in Fig 4D, are shown in the right side. Unfilled arrowheads indicate the APC‐binding pocket region of ABK.
- B
Model representation of the potential two‐step APC‐binding process of KIF3A/KAP3 including cargo recruiting by the KIF3 tail, docking into the specific binding cavity formed by KIF3 tail and KAP3, and locking by the KIF3 coiled coil for stabilization and subsequent transport.

- A
Left: representative cryoEM image of ABK‐APCARM. Right: 2D class averages of ABK‐APCARM from cryoEM single particle analysis. 2D class averages were classified into four major groups with distinct conformations. HS‐AFM observation and representative particle images of ABK‐APCARM. Scale bars: 100 nm (left), 10 nm (right).
- B
Left: representative cryoEM image of ABK. Right: 2D class averages of ABK‐APCARM from cryoEM single particle analysis. Scale bars: 100 nm (left), 10 nm (right).
References
-
- Ando T (2019) High‐speed atomic force microscopy. Curr Opin Chem Biol 51: 105–112 - PubMed
Publication types
MeSH terms
Substances
LinkOut - more resources
Full Text Sources

