. 2023 Jul 27:14:1241038.
doi: 10.3389/fimmu.2023.1241038. eCollection 2023.

Cross-reactive humoral and CD4+ T cell responses to Mu and Gamma SARS-CoV-2 variants in a Colombian population

Affiliations

Cross-reactive humoral and CD4+ T cell responses to Mu and Gamma SARS-CoV-2 variants in a Colombian population

Fabiola Martel et al. Front Immunol. .

Erratum in

Abstract

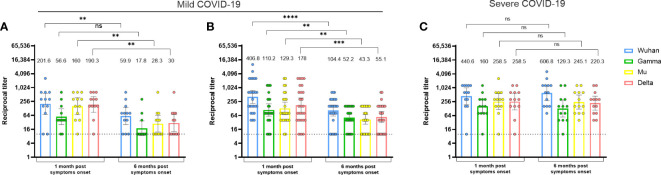
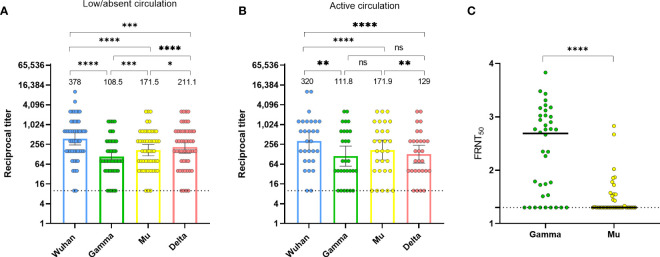
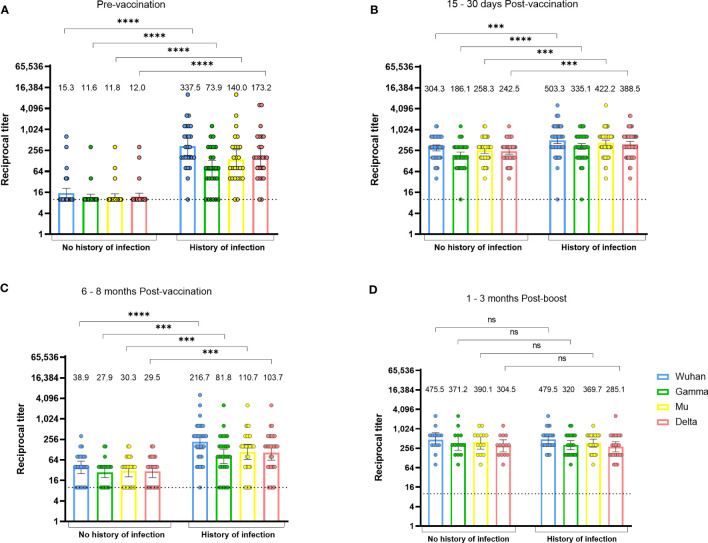
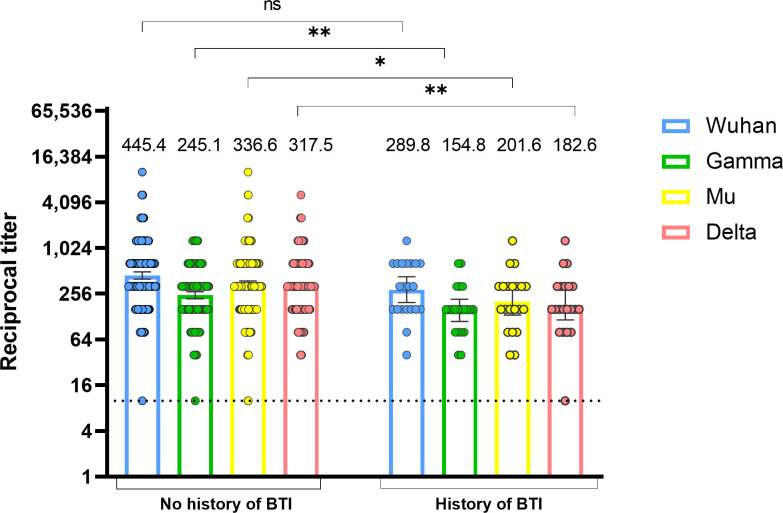
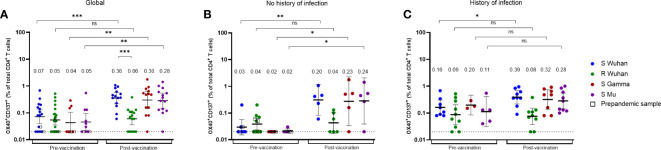
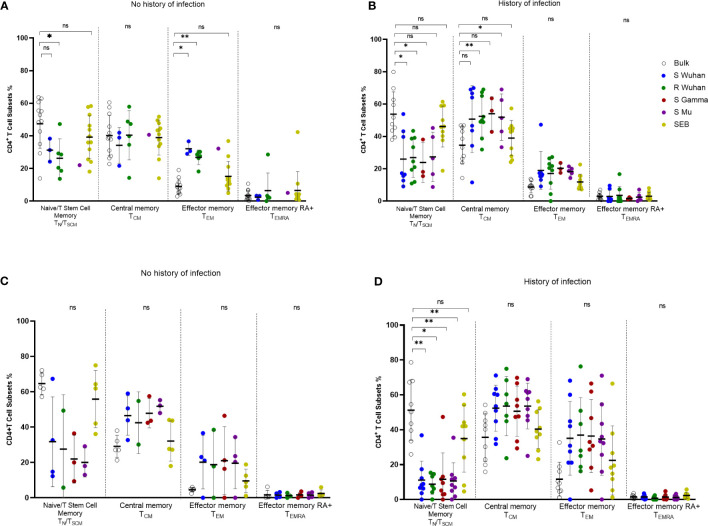
The SARS CoV-2 antibody and CD4+ T cell responses induced by natural infection and/or vaccination decline over time and cross-recognize other viral variants at different levels. However, there are few studies evaluating the levels and durability of the SARS CoV-2-specific antibody and CD4+ T cell response against the Mu, Gamma, and Delta variants. Here, we examined, in two ambispective cohorts of naturally-infected and/or vaccinated individuals, the titers of anti-RBD antibodies and the frequency of SARS-CoV-2-specific CD4+ T cells up to 6 months after the last antigen exposure. In naturally-infected individuals, the SARS-CoV-2 antibody response declined 6 months post-symptoms onset. However, the kinetic observed depended on the severity of the disease, since individuals who developed severe COVID-19 maintained the binding antibody titers. Also, there was detectable binding antibody cross-recognition for the Gamma, Mu, and Delta variants, but antibodies poorly neutralized Mu. COVID-19 vaccines induced an increase in antibody titers 15-30 days after receiving the second dose, but these levels decreased at 6 months. However, as expected, a third dose of the vaccine caused a rise in antibody titers. The dynamics of the antibody response upon vaccination depended on the previous SARS-CoV-2 exposure. Lower levels of vaccine-induced antibodies were associated with the development of breakthrough infections. Vaccination resulted in central memory spike-specific CD4+ T cell responses that cross-recognized peptides from the Gamma and Mu variants, and their duration also depended on previous SARS-CoV-2 exposure. In addition, we found cross-reactive CD4+ T cell responses in unexposed and unvaccinated individuals. These results have important implications for vaccine design for new SARS-CoV-2 variants of interest and concern.

Keywords: CD4+ T cell; SARS-CoV-2; antibody; breakthrough infections; hybrid immunity; natural infection; vaccination; variants.


Conflict of interest statement

AS is or has been a consultant for Arcturus, Cell Carta/Caprion, Oxford Immunotech, Repertoire and Pfizer, Moderna, AstrZeneca, Flowpharma, Qiagen, EmerVac and Gritstone. La Jolla Institute has filed for patent protection for various aspects of T cell epitope and vaccine design work. The remaining authors declare that the research was conducted in the absence of any commercial or financial relationships that could be construed as a potential conflict of interest.

Figures

Figure 1
Figure 1
The durability of cross-reactive anti-RBD antibody responses upon natural infection is impacted by disease severity. Anti-RBD antibody titers against the Wuhan, Gamma, Mu, and Delta variants, in naturally-infected individuals who developed mild (A, B) or severe disease (C). Each circle represents an individual sample. The height of the bars and the numbers over them indicate the geometric mean titer. The 95% CI is also shown. The Wilcoxon test was performed. The dotted line represents the limit of detection of the assay. In (A), the Javeriana cohort is shown (n=12). In (B), the Andes cohort is shown (1-month n=26 and 6-month PSO n=21). In (C), the El Rosario cohort is shown (n=13). ns, Not statistically significant. *p-value <0.05; **p-value <0.01; ***p-value <0.001.
Figure 2
Figure 2
Divergence between the binding and neutralization potential of human sera against SARS-CoV-2 Mu and Gamma. (A) Anti-RBD antibody titers against the Wuhan ancestral strain, as well as Gamma, Mu, and Delta variants, in naturally-infected individuals (n=50, both mild and severe disease) at 1-month PSO between June and December 2020 (period of low/absent circulation of Gamma and Mu). (B) Anti-RBD antibody titers against the Wuhan ancestral strain, as well as Gamma, Mu, and Delta variants in samples from 29 individuals (Los Andes cohort) who were seronegative up to December 2020 and seroconverted 6 months later in May 2021, during an active circulation of Gamma and Mu variants. Each circle represents an individual sample. The height of the bars and the numbers over them indicate the geometric mean titer. The 95% CI is also shown. The Friedman test was performed. ns, Not statistically significant. (C) Neutralization of infectious SARS-CoV-2 by human sera was determined by Focus Neutralization Reduction Test (FRNT). FRNT50 values for SARS-CoV-2 Gamma and Mu were determined by non-linear regression analysis for SARS-CoV-2 naturally-infected subjects (samples at 1-month PSO). Each circle represents an individual sample. The bars indicate the geometric mean. The Wilcoxon test was performed. The dotted lines represent the limit of detection of the assays. *p-value <0.05; **p-value <0.01; ***p-value <0.001; ****p-value <0.0001.
Figure 3
Figure 3
The durability of vaccine-induced anti-RBD antibodies depends on the history of natural infection. Anti-RBD antibody titers against the Wuhan, Gamma, Mu, and Delta variants, in BNT162b2-vaccinated individuals with or without history of natural infection. Data from individuals from the Javeriana cohort 2 (n=57) at the pre-vaccination (A), 15-30 days post-vaccination (B), and 6-8 months post-vaccination period (C), or 1-3 months after a vaccine boost in individuals from the Rosario cohort 2 (n=38; D), are shown. Each circle represents an individual sample. The height of the bars and the numbers over them indicate the geometric mean titer. The 95% CI is also shown. The Mann-Whitney test was performed. The dotted line represents the limit of detection of the assay. ns, Not statistically significant. ***p-value <0.001; ****p-value <0.0001.
Figure 4
Figure 4
Lower vaccine-induced anti-RBD antibody titers are associated with the development of SARS-CoV-2 BTI. Anti-RBD antibody titers against the Wuhan, Gamma, Mu, and Delta variants were measured at 15-30 days after the second BNT162b2 vaccine dose in individuals with or without a history of BTI (n=21). BTI were determined by clinical records or seroconversion in nucleoprotein antibodies measured 6-8 months after the second vaccine dose. Each circle represents an individual sample. The height of the bars and the numbers over them indicate the geometric mean titer. The 95% CI is also shown. The Mann-Whitney test was performed. The dotted line represents the limit of detection of the assay. ns, Not statistically significant; BTI, Breakthrough infection. *p-value <0.05; **p-value <0.01.
Figure 5
Figure 5
The magnitude of vaccine-induced SARS-CoV-2 specific CD4+ T cell responses depends on the history of natural infection. Frequencies of Wuhan S or R-specific CD4+ T cells, as well as Gamma and Mu S-specific CD4+ T cells, evaluated by the AIM assay (OX40+CD137+ CD4+ T cells), at the pre-vaccination or post-vaccination period, in all the individuals analyzed (A), or in those without (B) or with history of natural infection (C). Each symbol represents an individual sample and open squares represent samples obtained from individuals before the beginning of the pandemic. Cells were stimulated with one or more peptide pools depending on the availability of cells per sample. The geometric mean and 95% CI are shown. The Mann-Whitney test was performed. The dotted line represents the threshold of positivity. ns, Not statistically significant. *p-value <0.05; **p-value <0.01; ***p-value <0.001.
Figure 6
Figure 6
Changes in the phenotype of SARS-CoV-2 specific CD4+ T cells according to the history of antigen exposure. Phenotype of SARS-CoV-2-specific CD4+ T cells evaluated by the AIM assay (OX40+CD137+ CD4+ T cells) in pre-vaccination (A, B) or post-vaccination (C, D) samples from individuals without (A, C) or with history of SARS-CoV-2 natural infection (B, D). Each symbol represents an individual sample. The geometric mean and 95% CI are shown. The Kruskal-Wallis and Dunn post-hoc tests were performed. ns, Not statistically significant. *p-value <0.05; **p-value <0.01.

References

    1. Sette A, Crotty S. Immunological memory to SARS-CoV-2 infection and COVID-19 vaccines. Immunol Rev (2022) 310:27–46. doi: 10.1111/imr.13089 - DOI - PMC - PubMed
    1. Krammer F. SARS-CoV-2 vaccines in development. Nature (2020. 2020) 586586:516–27:7830. doi: 10.1038/s41586-020-2798-3 - DOI - PubMed
    1. Tarke A, Sidney J, Methot N, Yu ED, Zhang Y, Dan JM, et al. . Impact of SARS-CoV-2 variants on the total CD4+ and CD8+ T cell reactivity in infected or vaccinated individuals. Cell Rep Med (2021) 2:100355. doi: 10.1016/J.XCRM.2021.100355 - DOI - PMC - PubMed
    1. Tarke A, Coelho CH, Zhang Z, Dan JM, Yu ED, Methot N, et al. . SARS-CoV-2 vaccination induces immunological T cell memory able to cross-recognize variants from Alpha to Omicron. Cell (2022) 185:847–59.e11. doi: 10.1016/j.cell.2022.01.015 - DOI - PMC - PubMed
    1. Yu ED, Wang E, Garrigan E, Goodwin B, Sutherland A, Tarke A, et al. . Development of a T cell-based immunodiagnostic system to effectively distinguish SARS-CoV-2 infection and COVID-19 vaccination status. Cell Host Microbe (2022) 30:388–99.e3. doi: 10.1016/j.chom.2022.02.003 - DOI - PMC - PubMed

Publication types

Supplementary concepts