. 2023 Jul 27:14:1158493.
doi: 10.3389/fimmu.2023.1158493. eCollection 2023.

Chitinase-3-like 1 regulates TH2 cells, TFH cells and IgE responses to helminth infection

Affiliations

Chitinase-3-like 1 regulates TH2 cells, TFH cells and IgE responses to helminth infection

Miranda L Curtiss et al. Front Immunol. .

Abstract

Introduction: Data from patient cohorts and mouse models of atopic dermatitis, food allergy and asthma strongly support a role for chitinase-3-like-1 protein (CHI3L1) in allergic disease.

Methods: To address whether Chi3l1 also contributes to TH2 responses following nematode infection, we infected Chi3l1 -/- mice with Heligmosomoides polygyrus (Hp) and analyzed T cell responses.

Results: As anticipated, we observed impaired TH2 responses in Hp-infected Chi3l1 -/- mice. However, we also found that T cell intrinsic expression of Chi3l1 was required for ICOS upregulation following activation of naïve CD4 T cells and was necessary for the development of the IL-4+ TFH subset, which supports germinal center B cell reactions and IgE responses. We also observed roles for Chi3l1 in TFH, germinal center B cell, and IgE responses to alum-adjuvanted vaccination. While Chi3l1 was critical for IgE humoral responses it was not required for vaccine or infection-induced IgG1 responses.

Discussion: These results suggest that Chi3l1 modulates IgE responses, which are known to be highly dependent on IL-4-producing TFH cells.

Keywords: IL-4; IgE (immunoglobulin E); T follicular helper (T cell FH; T helper 2 (Th2) cells; enteric; germinal center; germinal center (GC) B cells; helminth.


Conflict of interest statement

The authors declare that the research was conducted in the absence of any commercial or financial relationships that could be construed as a potential conflict of interest.

Figures
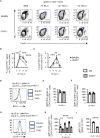
Figure 1
Figure 1
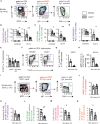
Chi3l1 regulates TFH responses to Hp infection. (A–H) Enumeration and characterization of msLN TFH cells from uninfected (n=5/group) or Hp-infected BALB/c (white bars) and Chi3l1 -/- (grey bars) mice (n=5/group). (A–C) TFH response to Hp infection with flow plots (A) showing CXCR5+PD-1+ TFH cells between D0 (uninfected) and D25 post-Hp with frequency (B) and number (C) of TFH cells. Kinetics of the msLN response (enumeration of total msLN cells, CD19 B cells, CD4 T cell and activated CD44hiCD62Llo) shown in Figures S1A–F . Cytokine production by CD44hi CD4 T cells shown in Figure S2 . (D–H) TFH phenotype in msLN of uninfected (D0) and Hp-infected mice. Bcl-6 (D, E), SLAM (F) and ICOS (G, H) expression by TFH on D8 (D–G) or between D0-D14 (H). Flow cytometry plots for Bcl-6 (D) and ICOS (G) are shown. Expression levels of Bcl-6 (E), SLAM (F) or ICOS (G) in TFH cells presented as the geometric Mean Fluorescence Intensity (gMFI). (I) gMFI of ICOS expression by purified splenic CD4+ T cells from uninfected BALB/c (white bars) and Chi3l1 -/- (grey bars) mice (n=4/group) that were stimulated in vitro for 48 hours in triplicate with anti-CD3 plus anti-CD28 in the presence of rIL-6 plus anti-IL-2. Data representative of 2 (D–F) or ≥ 3 independent experiments (all others). (A–H) Data displayed as the mean ± SD of each group with individual animals depicted as circles or triangles. (I) Data displayed as the mean ± SD of each group with individual animals (assayed in triplicate) depicted as circles or triangles. Statistical significance determined using unpaired 2-tailed student’s t test. *p≤0.05, **p≤0.01, ***p≤0.001, ****p≤0.0001.
Figure 2
Figure 2
Chi3l1 expressing hematopoietic cells are necessary and sufficient for TFH and TH2 responses to Hp. Enumeration of T cell responses in msLNs of D8 Hp-infected BM chimeric mice (n=5 mice/group) that were generated (A) by reconstituting lethally-irradiated BALB/c recipient mice with BALB/c (white bars) or Chi3l1 -/- (grey bars) BM. msLN CD4+ CD62LloCD44hi cells from D8 Hp-infected chimeric mice were analyzed directly ex vivo (C–F) or following restimulation for 4 hours with anti-CD3 in the presence of BFA (G–K). (B–E) Number (B) of activated CD4 T cells in msLN from D8 Hp-infected mice. Representative flow cytometry plot (C) showing CXCR5+PD-1+ TFH cells in D8 msLNs with the percentages (D) and numbers (E) of TFH cells and ICOS expression levels (F) by TFH cells represented as gMFI. (G–K) IL-4 and IL-13 production by resting and anti-CD3 stimulated msLN cells. Representative flow plot (G) showing IL-4 and IL-13 expression by CD44hi CD4 cells from D8 Hp-infected chimeras with the percentage and number of IL-4+IL-13neg (H–I) and IL-4+IL-13+ (J–K) producers. Analysis of TFH responses and CD4 T cell responses in reciprocal BM chimeras is shown in Figure S3 . Data representative of ≥ 3 independent experiments displayed as mean ± SD of each group with cells from individual animals depicted as circles or triangles. Unpaired 2-tailed student’s t-test was used to assess statistical significance. *p≤0.05, **p≤0.01, ***p≤0.001, ****p≤0.0001.
Figure 3
Figure 3
Chi3l1 regulates TFH development and expansion via a cell-extrinsic mechanism. Enumeration of T and B cell responses in mLNs from Hp-infected mixed 50:50 BM chimeras that were generated (A) by reconstituting lethally-irradiated BALB/c recipient mice with a 1:1 ratio (B, C) of BALB/c (CD45.1+, teal bars) and Chi3l1 -/- (CD45.2+, orange bars) BM. Chimeras were analyzed before infection (n=4/group), on D8 (n=6/group) or on D14 (n=5/group) post-Hp infection. Cells were analyzed directly ex vivo. (D–I) Flow plots (D) showing BALB/c CD45.1+ (teal) and Chi3l1 -/- CD45.2+ (orange) donor-derived msLN CD4 T cell populations before and on D8 post-infection. Frequency (E) and number (F) of CD4 cells of each genotype derived from each animal at each timepoint. Flow plots (G) showing both donor-derived TFH populations in uninfected and D8 post-infection with frequency (H) and number (I) of TFH cells of each genotype derived from each animal at each timepoint. (J–L) Flow plots (J) showing BALB/c CD45.1+ (teal) and Chi3l1 -/- CD45.2+ (orange) donor-derived msLN B220+ B cell populations before and on D8 post-infection. Frequency (K) and number (L) of B220+ B cells of each genotype derived from each animal at each timepoint. Analysis of B cell development in BM and spleen in 50:50 chimeras is shown in Figure S4 . Data representative of ≥3 independent experiments. Data displayed as mean ± SD in triplicate shown as bars (C) or as cell populations derived from each genotype from individual animals shown as paired lines (E–L). Statistical analysis was performed with unpaired 2-tailed student’s t-test (C) or paired 2-tailed student’s t-test (all others). *p≤0.05, **p≤0.01, ***p≤0.001, ****p≤0.0001. *p≤0.05, **p≤0.01, ***p≤0.001, ****p≤0.0001.
Figure 4
Figure 4
Chi3l1 regulates cytokine production and ICOS expression in T cells by a cell intrinsic mechanism. (A–G) CD4 T responses in mLNs from Hp-infected mixed 50:50 BM chimeras that were generated as described in Figure 3 with 50% BALB/c (CD45.1+) BM plus 50% Chi3l1 -/- (CD45.2+) BM. (A–D) Cytokine production by anti-CD3 restimulated donor D8 BALB/c CD45.1+ (teal) and Chi3l1 -/- CD45.2+ (orange) CD44hi CD4 cells. Flow plots showing IL-4 (A) and IFNγ (C) production with the percentage of IL-4 (B) and IFNγ (D) producers of each genotype derived from each D8 Hp-infected animal. (E–G) ICOS expression by donor BALB/c CD45.1+ (teal) and Chi3l1 -/- CD45.2+ (orange) CXCR5+PD-1+ TFH cells on D8 and D14 post-Hp infection. Flow plots (E) showing ICOS expression by D14 TFH cells. gMFI of ICOS expression levels on D8 (F) and D14 (G) post-infection by BALB/c or Chi3l1 -/- donor-derived TFH cells from the same animal. (H) gMFI of ICOS expression by purified splenic CD4+ T cells from uninfected BALB/c CD45.1+ mice (teal bars) that were co-cultured in triplicate at a 1:1 ratio with CD4 T cells from Chi3l1 -/- CD45.2+ (orange bars) mice (n=3/group) and stimulated for 48 hours with anti-CD3 plus anti-CD28. Data representative of ≥3 (A-G) or 2 (H) independent experiments. Data in (A–G) represent cell populations derived from each genotype from individual animals shown as paired lines. Data in (H) displayed as the mean ± SD of each group with individual animals (assayed in triplicate) depicted as circles or triangles. Statistical analysis was performed with paired 2-tailed student’s t-test (A–G) or unpaired 2-tailed student’s t-test (H). **p≤0.01, ***p≤0.001, ****p≤0.0001.
Figure 5
Figure 5
Chi3l1 regulates B cell responses to Hp infection and alum-adjuvanted protein immunization. Enumeration of B cell responses in BALB/c (white bars) and Chi3l1 -/- (grey bars) mice following infection with Hp (A–D) or vaccination with NS1 protein in alum (E–N). (A–D) Characterization of B cell responses in msLNs of uninfected (n=5/group) and D14 Hp-infected (n=7/group) BALB/c and Chi3l1 -/- mice. Flow plots (A) showing the gating strategy to identify B220loCD138hi ASCs (blue gate), total B cells (red gate), IgDnegIgMneg isotype-switched B cells (purple gate), naïve B cells (cerulean gate) and PNAhiCD38lo GCB cells (green gate). Numbers of isotype-switched B cells (B), GCB cells (C), and ASCS (D) in msLNs of uninfected and D14 Hp-infected mice are shown. Additional analyses of msLN B cell and ASC responses in Hp-infected WT and Chi3l1 -/- mice ( Figure S5 ) and 50:50 BM chimeras ( Figure S6 ) are provided. (E–N) Analysis of splenic CD4 T cell (E–H) and B cell (F–N) responses in BALB/c and Chi3l1 -/- mice (n=5-6/group) at baseline and on D12 post-immunization with influenza NS1 protein adsorbed to alum. Enumeration (E) of splenic CD4 T cells with representative flow plots showing the gating strategy (F) to identify and quantitate (G) splenic CXCR5+PD-1+ TFH cells. ICOS expression (H) by TFH cells reported as gMFI. Representative gating of splenic B cell subsets (I) and enumeration of total splenic B cells (J) from immunized mice. Enumeration of total splenic IgD-IgM- isotype-switched B cells (K) and PNA+CD38- GCB cells (L). Numbers of NS1+ isotype-switched cells (M) and NS1+ GCB cells (N). Representative flow plots with gating strategy to identify B cell subsets and NS1-specific B cells in spleens of control and NS1-immunized WT and Chi3l1 -/- mice provided in Figure S7 . Data is representative of 3 independent experiments. Data displayed as the mean ± SD of each group with individual animals depicted as circles or triangles. Statistical analysis was performed with unpaired 2-tailed student’s t-test. *p≤0.05, **p≤0.01, ****p≤0.0001.
Figure 6
Figure 6
Chi3l1 regulates IgE responses to infection and immunization. Evaluation of IgE and IgG1 antibody responses in Hp-infected (A–E), naïve (F–G) and NP-OVA immunized (H–J) BALB/c (white bars) and Chi3l1 -/- (grey bars) mice. (A–C) Quantitation of D14 IgE-expressing ASCs (A–C) from Hp-infected mice (n=7 mice/group). Representative flow plots showing msLN IgE-expressing ASCs (A) with the frequency (B) and number (C) of IgE-expressing ASCs. Hp-induced IgE+ ASCs in 50:50 BM chimeras are shown in Figures S6L–N . (D, E) Serum antibody levels in Hp-infected mice. ELISA quantitation of D21 total serum IgE (D) and Hp-specific IgG1 (E). (F, G) Serum IgE (F) and IgG1 (G) antibody levels in uninfected mice (n=8/group). (H–J) Serum antibody levels in mice immunized with NP-OVA adsorbed to alum (n=13/group). Data is reported in μg/ml for total IgE (H) and OD values for NP-specific IgE (I, serum at 1:10 dilution) and NP-OVA specific IgG1 (J, serum diluted 1:200 to 1:1600). Data representative of 1 (G), 2 (H–J), 3 (A–E), or 5 (F) independent experiments. Data displayed as the mean ± SD of each group with individual animals depicted as circles or triangles. Statistical analysis was performed with unpaired 2-tailed student’s t-test (A–H) or 2-way ANOVA (J). P values of (J) is not significant (P > 0.05). **p≤0.01, ***p≤0.001, ****p≤0.0001.
Figure 7
Figure 7
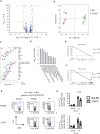
Chi3l1 regulates TFH4 programming. (A–G) RNA-seq analysis of sorted-purified CXCR5+PD-1+ msLN TFH isolated from D14 Hp-infected WT and Chi3l1 -/- mice (n=9 independently pooled samples/group). See Table S1 for gene expression levels. (A) Volcano plot showing 9853 expressed genes (defined as genes with at least 3 RPM in all samples of either the WT and/or Chi3l1 -/- TFH). 1465 genes were expressed at significantly different levels (FDR q<0.05) between WT and Chi3l1 -/- TFH cells. Of those, genes meeting criteria of >1 RPKM in at least one group and log2FC of ±0.3785 (193 genes) are indicated with blue or red symbols. Red symbols indicate the 24 genes meeting a threshold of abs(log2FC) of ±1, blue indicate the 169 genes with abs(log2FC) between 0.3785 and 1.0. (B) Principal component analysis of 193 genes with > 1 mean RPKM in at least one group, ± 0.3785 log2FC (1.3-fold) and FDR q<0.05. (C) Absolute expression values of 24 genes with > 1 mean RPKM in at least one group, ± 1.0 log2FC (2-fold) and FDR q<0.05. (D) The gene list containing 193 genes > 1 RPKM in at least one group meeting an FDR q< 0.05 and ± 0.3785 log2FC cutoff were imported into Ingenuity Pathway Analysis (IPA, QIAGEN Digital Insights) to identify significant predicted signaling pathways. 182 genes were analyzed by IPA. Pathways with a Benjamini-Hochberg (B–H) corrected overlap p< 0.05 are shown. (E, F) Gene set enrichment analysis (GSEA) (50) using the ranked gene list of WT and Chi3l1 -/- TFH cells and DEG identified as up in IL4+IL-21neg TFH cells (TFH4, panel E) or up in IL-4negIL-21+ TFH cells (TFH21, panel F) isolated from Nippostrongylus brasiliensis-infected mice (40). pnom and NES are provided. (G–I) Cytokine production by D14 Hp-infected WT and Chi3l1 -/- TFH cells (N=5 mice/group) following in vitro PMA+ionomycin restimulation. Flow plots (G) measuring IL-4 production and the percentage (H) and number (I) of TFH4 cells in each culture. Data representative of 3 independent experiments (G–I) or one experiment (A–F) with 9 independent RNA-seq samples/group. Data in (G–I) displayed as the mean ± SD of each group with individual animals depicted as circles or triangles. Statistical tests for RNA-seq data described in the legends. Statistical analysis for (G–I) was performed with unpaired 2-tailed student’s t-test. *p≤0.05, ***p≤0.001.

References

    1. Hazebrouck S, Canon N, Dreskin SC. The effector function of allergens. Front Allergy (2022) 3:818732. doi: 10.3389/falgy.2022.818732 - DOI - PMC - PubMed
    1. Matsumura Y. Role of allergen source-derived proteases in sensitization via airway epithelial cells. J Allergy (Cairo) (2012) 2012:903659. doi: 10.1155/2012/903659 - DOI - PMC - PubMed
    1. Tharanathan RN, Kittur FS. Chitin–the undisputed biomolecule of great potential. Crit Rev Food Sci Nutr (2003) 43:61–87. doi: 10.1080/10408690390826455 - DOI - PubMed
    1. Foster JM, Zhang Y, Kumar S, Carlow CK. Parasitic nematodes have two distinct chitin synthases. Mol Biochem Parasitol (2005) 142:126–32. doi: 10.1016/j.molbiopara.2005.03.011 - DOI - PubMed
    1. Da Silva CA, Pochard P, Lee CG, Elias JA. Chitin particles are multifaceted immune adjuvants. Am J Respir Crit Care Med (2010) 182:1482–91. doi: 10.1164/rccm.200912-1877OC - DOI - PMC - PubMed

Publication types