. 2023 Jul 28:14:1223264.
doi: 10.3389/fimmu.2023.1223264. eCollection 2023.

Lipedema stage affects adipocyte hypertrophy, subcutaneous adipose tissue inflammation and interstitial fibrosis

Affiliations

Lipedema stage affects adipocyte hypertrophy, subcutaneous adipose tissue inflammation and interstitial fibrosis

Philipp Kruppa et al. Front Immunol. .

Abstract

Introduction: Lipedema is a painful subcutaneous adipose tissue (SAT) disease characterized by adipocyte hypertrophy, immune cell recruitment, and fibrosis in the affected areas. These features are thought to contribute to the development and progression of the condition. However, the relationship between lipedema disease stage and the associated adipose tissue changes has not been determined so far.

Methods: SAT biopsies of 32 lipedema patients, ranging across the pathological stages I to III, and 14 BMI- and age-matched controls were harvested from lipedema-affected thighs and non-symptomatic lower abdominal regions. Histological and immunohistochemical (IHC) staining and expression analysis of markers for adipogenesis, immunomodulation, and fibrosis were performed on the tissue biopsies.

Results: Lipedema patients showed increased adipocyte areas and a stage-dependent shift towards larger cell sizes in the thighs. Lipedema SAT was linked with increased interstitial collagen accumulation in the thighs, but not the lower abdominal region when compared to controls. There was a trend toward progressive SAT fibrosis of the affected thighs with increasing lipedema stage. Elevated gene expression levels of macrophage markers were found for thigh SAT biopsies, but not in the abdominal region. IHC staining of lipedema thigh biopsies confirmed a transiently elevated macrophage polarization towards an M2-like (anti-inflammatory) phenotype.

Conclusions: In summary, lipedema SAT is associated with stage-dependent adipocyte hypertrophy, stage-progressive interstitial fibrosis and elevated proportion of M2-like macrophages. The character of the inflammatory response differs from primary obesity and may possess an essential role in the development of lipedema.

Keywords: adipose tissue; fibrosis; inflammation; lipedema; lipoedema; macrophages.


Conflict of interest statement

The authors declare that the research was conducted in the absence of any commercial or financial relationships that could be construed as a potential conflict of interest.

Figures

Figure 1
Figure 1
Adipocyte hypertrophy occurs in later stages of lipedema progression. (A) Representative images of hematoxylin and eosin (H&E) staining of adipose tissue sections from the abdominal and thigh regions of lipedema patients and BMI and age matched controls (100x magnification; scale bar 100 µm). (B) Quantification of average adipocyte size, expressed as area in µm2, in lipedema patients (n = 30; grey bars) and control subjects (n=14; white bars) in the abdominal and thigh regions. (C–E) Adipocyte size distribution in abdominal region (panels on left and thigh (panels on right) in the indicated lipedema stage I [black lines; n=9; (C)], stage II [n= 16; (D)] and stage III [n=9; (E)] as percentage of total counted number of cells, compared to the same group of control subjects in each panel (n=14; gray line). Representative images of stage dependent H&E stained adipose tissue sections are depicted in Supplementary Figure S1 . Data are presented as mean ± SEM. Statistical significances are indicated as *p<0.05; ***p<0.0005; ****p<0.0001 using unpaired, two-tailed t-test with Welch correction for B and nonparametric multiple t-test for (C–E).
Figure 2
Figure 2
Fibrosis occurs as an early sign of lipedema and presents only in SAT of affected extremities. (A) Representative images of Sirius red-stained interstitial fibrosis in abdomen and thigh SAT sections (200x magnification; scale bar 100 µm) in lipedema patients and control subjects matched for age and BMI. (B) Quantification of fibrosis areas as percentage of total area comparing sections derived from controls (n=14; white bars) and lipedema patients (n=30; grey bars). (C) Stage dependent analysis of fibrosis area as percentage of total area in control patients (n=14; white bars) compared to stage I (SI; n=9; light grey), stage II (SII; n=16; grey), stage III (SIII; n=5; dark grey) lipedema patients in sections of abdominal and thigh adipose tissue. Representative images of stage dependent H&E stained adipose tissue sections are depicted in Supplementary Figure S2 . Data are presented as mean ± SEM. *p<0.05; **p<0.005; ***p<0.0005; ****p<0.0001 using unpaired, two-tailed t-test with Welch correction.
Figure 3
Figure 3
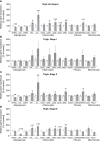
Stage-dependent gene expression patterns show increased inflammation-linked processes in thigh SAT of lipedema patients. (A) Gene expression analysis of marker genes related to adipogenesis, inflammation, fibrosis and mitochondrial function in thigh SAT of lipedema patients (n=32, grey bars) depicted as relative gene expression of all non-lipedema control subjects (n=14, white bars). (B) Analysis similar to panel A comparing all controls (n=14; white bars) to stage I lipedema thigh SAT (n=9; grey bars). (C) Analysis similar to panel A comparing all controls (n=14; white bars) to stage II lipedema thigh SAT (n=16; grey bars). (D) Analysis similar to panel A comparing all controls (n=14; white bars) to stage III lipedema thigh SAT (n=7; grey bars). All data are represented as mean ± SEM. *p<0.05; **p<0.005; ***p<0.0005 using unpaired, two-tailed t-test with Welch correction.
Figure 4
Figure 4
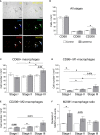
Impairment of macrophage polarization during pathogenesis of lipedema. (A) Representative bright field analysis (BF) and bright field merged with immunofluorescent signals (BF MERGE) of macrophage infiltration in thigh adipose tissue of lipedema patients. Representative images of immunofluorescence staining of macrophages in lipedema patient to detect DAPI nuclei (blue), CD68+ pan-macrophage (green) and CD206+ anti-inflammatory macrophage (red) markers Merged: yellow indicates co-staining of anti-CD68 and anti-CD206 antibodies). White arrows indicate crown-like-structures (200x magnification; scale bar 100 µm) (B) Quantification of macrophage cell counts per area [mm²] comparing thigh SAT of lipedema patients (n=18, grey bars) and controls (n=12; white bars) matched for age (p=0.5643) and BMI (p=0.7660). Quantification summarizes counts per area for pan-macrophages expressing CD68, M1-like macrophages expressing CD86, and M2-like macrophages expressing CD206. (C–E) Quantification of stage-specific macrophage cell counts per area (mm²) in lipedema patients according to disease stage (stage I: n=6, stage II: n=7; stage III: n=5; grey bars) and compared to stage-specific control subgroups matched for BMI and age (n=4 for each stage-specific control group; white bars) depicting CD68+ pan-macrophages (C), CD86+ pro-inflammatory M1-like macrophages (D), and CD206+ anti-inflammatory M2-like macrophages (E). (F) Calculated M2/M1 ratios depending on disease stage (grey bars) and respective control subgroup (white bars). All data are represented as mean ± SEM. *p<0.05 using unpaired, two-tailed t-test with Welch correction.
Figure 5
Figure 5
Lipedema-associated changes of plasma lipid profiles. (A) Analysis of plasma levels of HDL-Cholesterol comparing controls (white bars) to lipedema patients (grey bars) of stage I (n=8), stage II (n=16) and stage III (n=7). (B) Analysis of plasma levels of fasting glycerol comparing controls (white bars) to lipedema patients (grey bars) of stage I (n=8), stage II (n=16) and stage III (n=7). (C) Calculation of the quotient between low-density lipoprotein (LDL) and high-density lipoprotein (HDL) for estimation of metabolic risk in controls (white bars) and lipedema patients (grey bars). LDL concentration was estimated by the Friedewald equation: [total cholesterol] – [high-density lipoprotein cholesterol] –[triglycerides/5]. (D) Calculation of the quotient between triglycerides and HDL comparing controls (white bars) to lipedema patients of stage I to stage III (grey bars). *p<0.05; **p<0.005; ****p<0.0001.

Similar articles

Cited by

References

    1. Kruppa P, Georgiou I, Biermann N, Prantl L, Klein-Weigel P, Ghods M. Lipedema—pathogenesis, diagnosis and treatment options. Dtsch Arztebl Int (2020) 117(22-23):396–403. doi: 10.3238/arztebl.2020.0396 - DOI - PMC - PubMed
    1. Szolnoky G, Nagy N, Kovacs RK, Dosa-Racz E, Szabo A, Barsony K, et al. . Complex decongestive physiotherapy decreases capillary fragility in lipedema. Lymphology (2008) 41(4):161–6. - PubMed
    1. Szolnoky G, Borsos B, Barsony K, Balogh M, Kemeny L. Complete decongestive physiotherapy with and without pneumatic compression for treatment of lipedema: a pilot study. Lymphology (2008) 41(1):40–4. - PubMed
    1. Szolnoky G, Varga E, Varga M, Tuczai M, Dosa-Racz E, Kemeny L. Lymphedema treatment decreases pain intensity in lipedema. Lymphology (2011) 44(4):178–82. - PubMed
    1. Kruppa P, Georgiou I, Schmidt J, Infanger M, Ghods M. A 10-Year Retrospective before-and-after Study of Lipedema Surgery: Patient-Reported Lipedema-Associated Symptom Improvement after Multistage Liposuction. Plast reconstructive surgery. (2022) 149(3):529e–41e. doi: 10.1097/PRS.0000000000008880 - DOI - PubMed

Publication types