

Cuproptosis-related genes prediction feature and immune microenvironment in major depressive disorder
- PMID: 37576193
- PMCID: PMC10415818
- DOI: 10.1016/j.heliyon.2023.e18497
Cuproptosis-related genes prediction feature and immune microenvironment in major depressive disorder
Abstract
Background: Major depressive disorder (MDD) is a severe, unpredictable, ill-cured, relapsing neuropsychiatric disorder. A recently identified type of death called cuproptosis has been linked to a number of illnesses. However, the influence of cuproptosis-related genes in MDD has not been comprehensively assessed in prior study.
Aim: This investigation intends to shed light on the predictive value of cuproptosis-related genes for MDD and the immunological microenvironment.
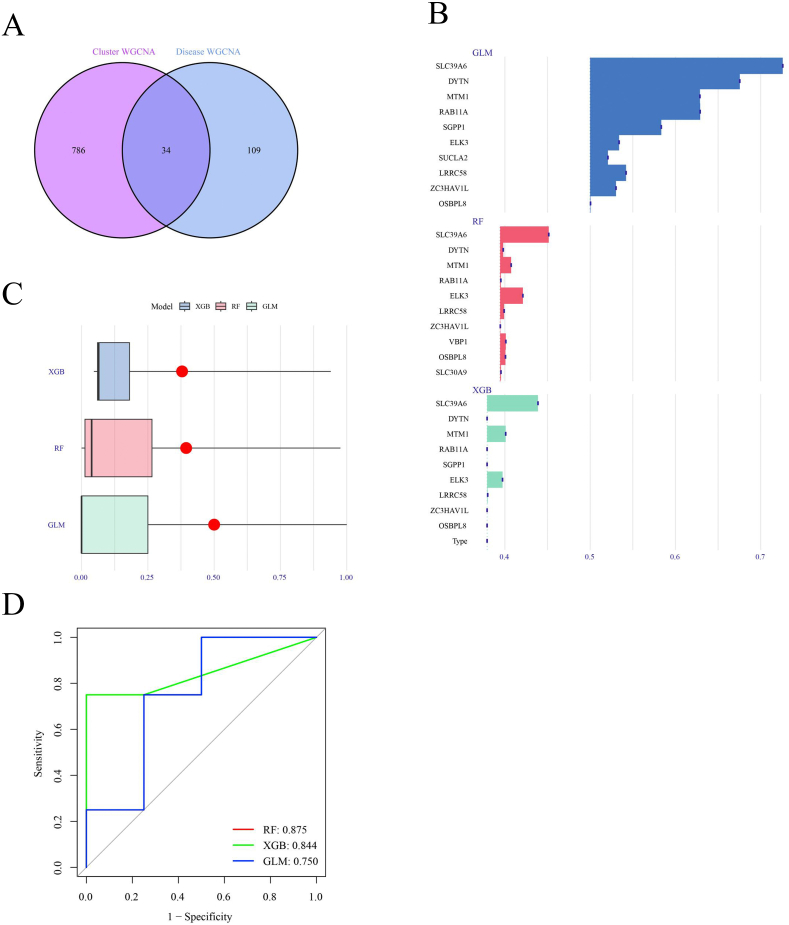
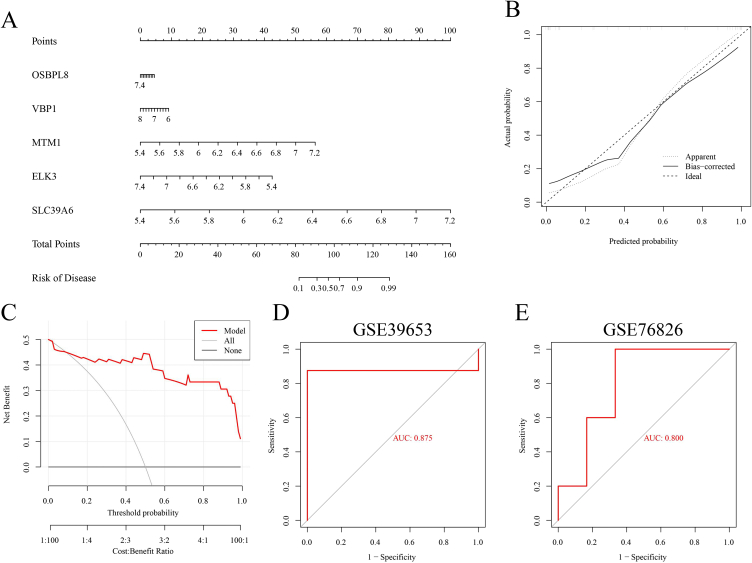
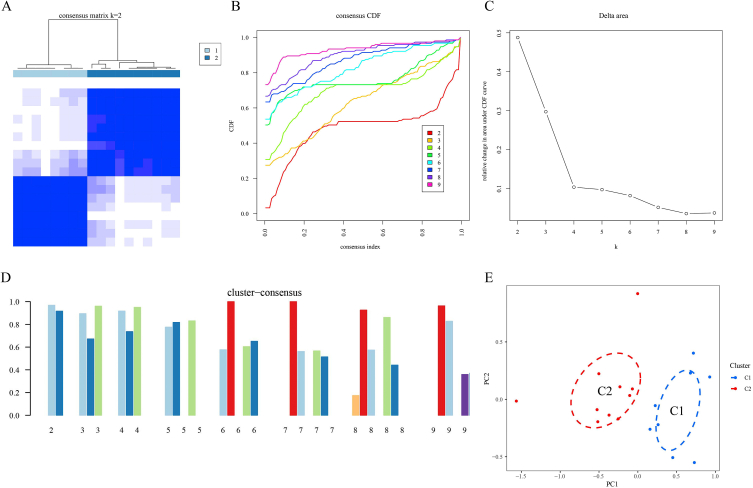
Methods: GSE38206, GSE76826, GSE9653 databases were used to analyze cuproptosis regulators and immune characteristics. To find the genes that were differently expressed, weighted gene co-expression network analysis was employed. We calculated the effectiveness of the random forest model, generalized linear model, and limit gradient lifting to arrive at the best machine prediction model. Nomogram, calibration curve, and decision curve analysis were used to show the anticipated MDD's accuracy.
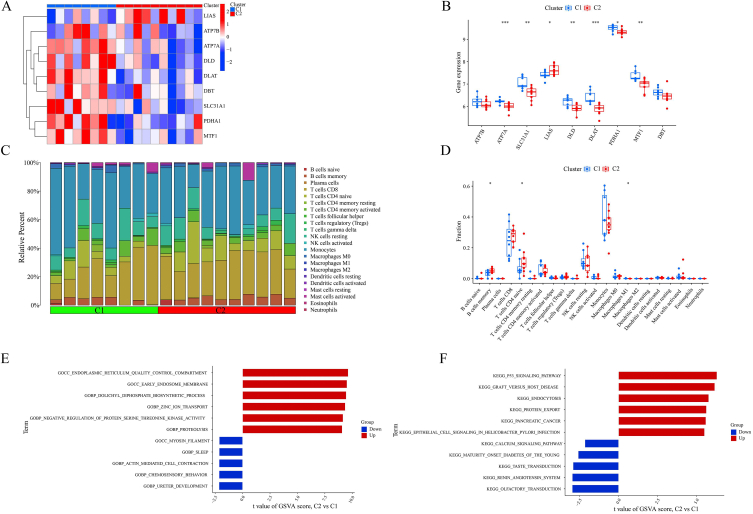
Results: This study found that there were activated immune responses and cuproptosis-related genes that were dysregulated in people with MDD compared to healthy controls. Considering the test performance of the learned model and validation on subsequent datasets, the RF model (including OSBPL8, VBP1, MTM1, ELK3, and SLC39A6) was considered to have the best discriminative performance. (AUC = 0.875).
Conclusion: Our study constructed a prediction model to predict MDD risk and clarified the potential connection between cuproptosis and MDD.
Keywords: Cuproptosis; Gene; Major depressive disorder; Predictive model; RF model.
© 2023 The Authors. Published by Elsevier Ltd.
Conflict of interest statement
The authors declare that they have no known competing financial interests or personal relationships that could have appeared to influence the work reported in this paper.
Figures


Similar articles
-
Identification and immunological characterization of cuproptosis-related molecular clusters in Alzheimer's disease.Front Aging Neurosci. 2022 Jul 28;14:932676. doi: 10.3389/fnagi.2022.932676. eCollection 2022. Front Aging Neurosci. 2022. PMID: 35966780 Free PMC article.
-
Identification and immune features of cuproptosis-related molecular clusters in polycystic ovary syndrome.Sci Rep. 2023 Jan 18;13(1):980. doi: 10.1038/s41598-022-27326-0. Sci Rep. 2023. PMID: 36653385 Free PMC article.
-
Identification of cuproptosis-related molecular subtypes as a biomarker for differentiating active from latent tuberculosis in children.BMC Genomics. 2023 Jul 1;24(1):368. doi: 10.1186/s12864-023-09491-2. BMC Genomics. 2023. PMID: 37393262 Free PMC article.
-
Identification of a novel cuproptosis-related gene signature and integrative analyses in patients with lower-grade gliomas.Front Immunol. 2022 Aug 15;13:933973. doi: 10.3389/fimmu.2022.933973. eCollection 2022. Front Immunol. 2022. PMID: 36045691 Free PMC article. Review.
-
Machine learning algorithm to construct cuproptosis- and immune-related prognosis prediction model for colon cancer.World J Gastrointest Oncol. 2023 Mar 15;15(3):372-388. doi: 10.4251/wjgo.v15.i3.372. World J Gastrointest Oncol. 2023. PMID: 37009317 Free PMC article. Review.
References
LinkOut - more resources
Full Text Sources
