

The hypoxia-associated genes in immune infiltration and treatment options of lung adenocarcinoma
- PMID: 37576511
- PMCID: PMC10414028
- DOI: 10.7717/peerj.15621
The hypoxia-associated genes in immune infiltration and treatment options of lung adenocarcinoma
Abstract
Background: Lung adenocarcinoma (LUAD) is a common lung cancer with a poor prognosis under standard chemotherapy. Hypoxia is a crucial factor in the development of solid tumors, and hypoxia-related genes (HRGs) are closely associated with the proliferation of LUAD cells.
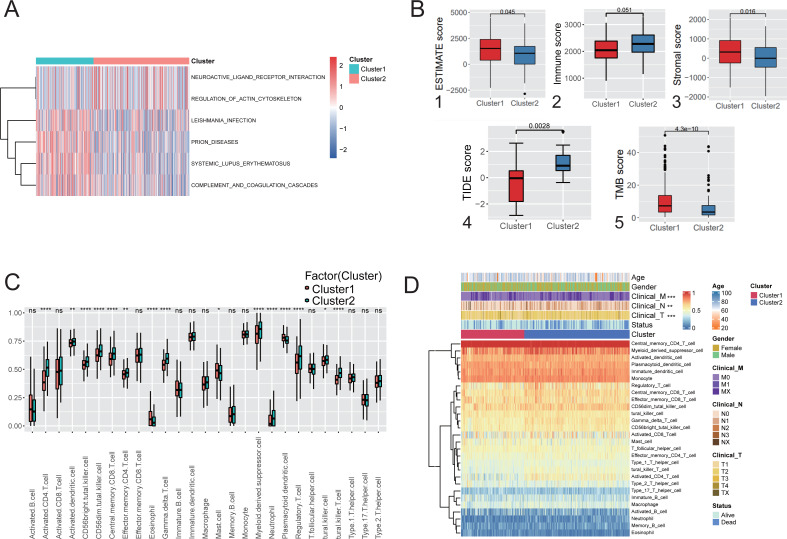
Methods: In this study, LUAD HRGs were screened, and bioinformatics analysis and experimental validation were conducted. The Cancer Genome Atlas (TCGA) and the Gene Expression Omnibus (GEO) databases were used to gather LUAD RNA-seq data and accompanying clinical information. LUAD subtypes were identified by unsupervised cluster analysis, and immune infiltration analysis of subtypes was conducted by GSVA and ssGSEA. Cox regression and LASSO regression analyses were used to obtain prognosis-related HRGs. Prognostic analysis was used to evaluate HRGs. Differences in enrichment pathways and immunotherapy were observed between risk groups based on GSEA and the TIDE method. Finally, RT-PCR and in vitro experiments were used to confirm prognosis-related HRG expression in LUAD cells.
Results: Two hypoxia-associated subtypes of LUAD were distinguished, demonstrating significant differences in prognostic analysis and immunological characteristics between subtypes. A prognostic model based on six HRGs (HK1, PDK3, PFKL, SLC2A1, STC1, and XPNPEP1) was developed for LUAD. HK1, SLC2A1, STC1, and XPNPEP1 were found to be risk factors for LUAD. PDK3 and PFKL were protective factors in LUAD patients.
Conclusion: This study demonstrates the effect of hypoxia-associated genes on immune infiltration in LUAD and provides options for immunotherapy and therapeutic strategies in LUAD.
Keywords: Hypoxia; Immunotherapy; Lung adenocarcinoma; Prognostic; Unsupervised clustering.
©2023 Liu et al.
Conflict of interest statement
The authors declare there are no competing interests.
Figures


Similar articles
-
Development and Validation of a Combined Hypoxia and Immune Prognostic Classifier for Lung Adenocarcinoma.J Cancer. 2022 May 16;13(8):2631-2643. doi: 10.7150/jca.70725. eCollection 2022. J Cancer. 2022. PMID: 35711827 Free PMC article.
-
Leveraging diverse cell-death patterns to predict the clinical outcome of immune checkpoint therapy in lung adenocarcinoma: Based on muti-omics analysis and vitro assay.Oncol Res. 2023 Dec 28;32(2):393-407. doi: 10.32604/or.2023.031134. eCollection 2023. Oncol Res. 2023. PMID: 38186574 Free PMC article.
-
Identification of novel gene signature for lung adenocarcinoma by machine learning to predict immunotherapy and prognosis.Front Immunol. 2023 Jul 31;14:1177847. doi: 10.3389/fimmu.2023.1177847. eCollection 2023. Front Immunol. 2023. PMID: 37583701 Free PMC article.
-
High Expression of DLGAP5 Indicates Poor Prognosis and Immunotherapy in Lung Adenocarcinoma and Promotes Proliferation through Regulation of the Cell Cycle.Dis Markers. 2023 Jan 19;2023:9292536. doi: 10.1155/2023/9292536. eCollection 2023. Dis Markers. 2023. PMID: 36712920 Free PMC article.
-
Comprehensive analysis of a novel signature incorporating lipid metabolism and immune-related genes for assessing prognosis and immune landscape in lung adenocarcinoma.Front Immunol. 2022 Aug 25;13:950001. doi: 10.3389/fimmu.2022.950001. eCollection 2022. Front Immunol. 2022. PMID: 36091041 Free PMC article.
Cited by
-
Phosphofructokinase-1 redefined: a metabolic hub orchestrating cancer hallmarks through multi-dimensional control networks.J Transl Med. 2025 Aug 6;23(1):873. doi: 10.1186/s12967-025-06897-2. J Transl Med. 2025. PMID: 40770805 Free PMC article. Review.
-
Identification of Hypoxia and Mitochondrial-related Gene Signature and Prediction of Prognostic Model in Lung Adenocarcinoma.J Cancer. 2024 Jun 17;15(14):4513-4526. doi: 10.7150/jca.97374. eCollection 2024. J Cancer. 2024. PMID: 39006078 Free PMC article.
-
Identification and Validation of a Hypoxia and Glycolysis Prognostic Signatures in Lung Adenocarcinoma.J Cancer. 2024 Jan 21;15(6):1568-1582. doi: 10.7150/jca.91504. eCollection 2024. J Cancer. 2024. PMID: 38370379 Free PMC article.
References
-
- Abe K, Kanehira M, Ohkouchi S, Kumata S, Suzuki Y, Oishi H, Noda M, Sakurada A, Miyauchi E, Fujiwara T, Harigae H, Okada Y. Targeting stanniocalcin-1-expressing tumor cells elicits efficient antitumor effects in a mouse model of human lung cancer. Cancer Medicine. 2021;10(9):3085–3100. doi: 10.1002/cam4.3852. - DOI - PMC - PubMed
-
- Bischoff P, Trinks A, Obermayer B, Pett JP, Wiederspahn J, Uhlitz F, Liang X, Lehmann A, Jurmeister P, Elsner A, Dziodzio T, Ruckert JC, Neudecker J, Falk C, Beule D, Sers C, Morkel M, Horst D, Bluthgen N, Klauschen F. Single-cell RNA sequencing reveals distinct tumor microenvironmental patterns in lung adenocarcinoma. Oncogene. 2021;40(50):6748–6758. doi: 10.1038/s41388-021-02054-3. - DOI - PMC - PubMed
Publication types
MeSH terms
LinkOut - more resources
Full Text Sources
Medical
Research Materials
Miscellaneous
