. 2023 Oct;28(10):102907.
doi: 10.1117/1.JBO.28.10.102907. Epub 2023 Aug 10.

Multiparameter interferometric polarization-enhanced imaging differentiates carcinoma in situ from inflammation of the bladder: an ex vivo study

Affiliations

Multiparameter interferometric polarization-enhanced imaging differentiates carcinoma in situ from inflammation of the bladder: an ex vivo study

Shuang Chang et al. J Biomed Opt. 2023 Oct.

Abstract

Significance: Successful differentiation of carcinoma in situ (CIS) from inflammation in the bladder is key to preventing unnecessary biopsies and enabling accurate therapeutic decisions. Current standard-of-care diagnostic imaging techniques lack the specificity needed to differentiate these states, leading to false positives.

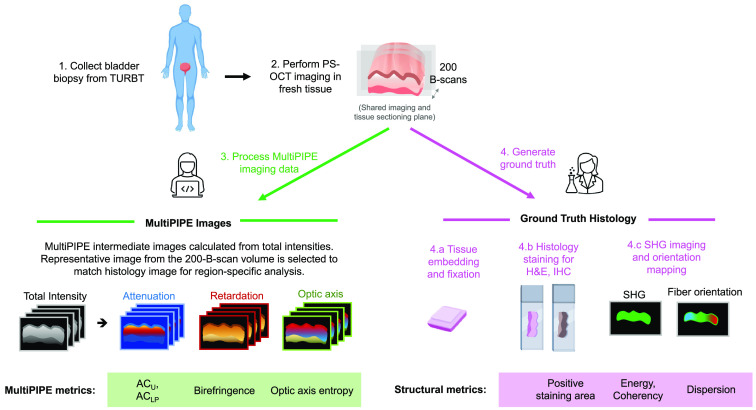
Aim: We introduce multiparameter interferometric polarization-enhanced (MultiPIPE) imaging as a promising technology to improve the specificity of detection for better biopsy guidance and clinical outcomes.

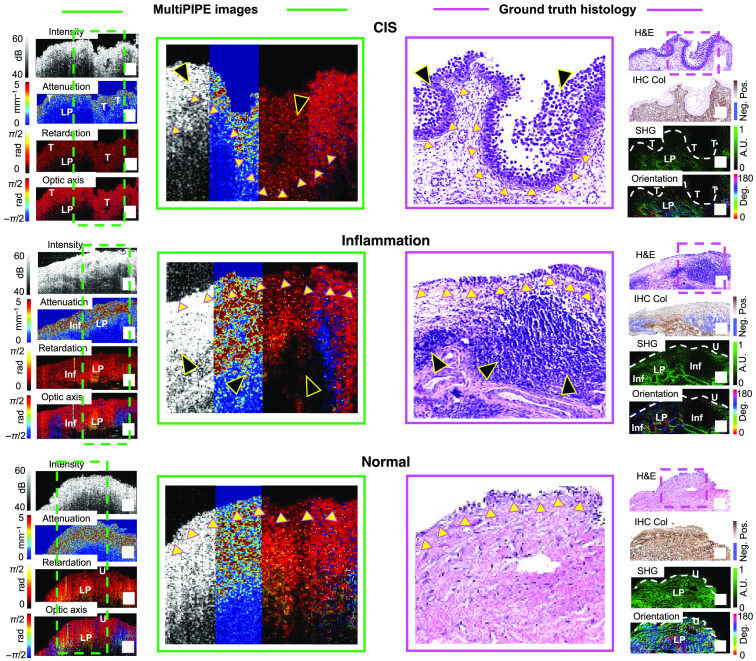
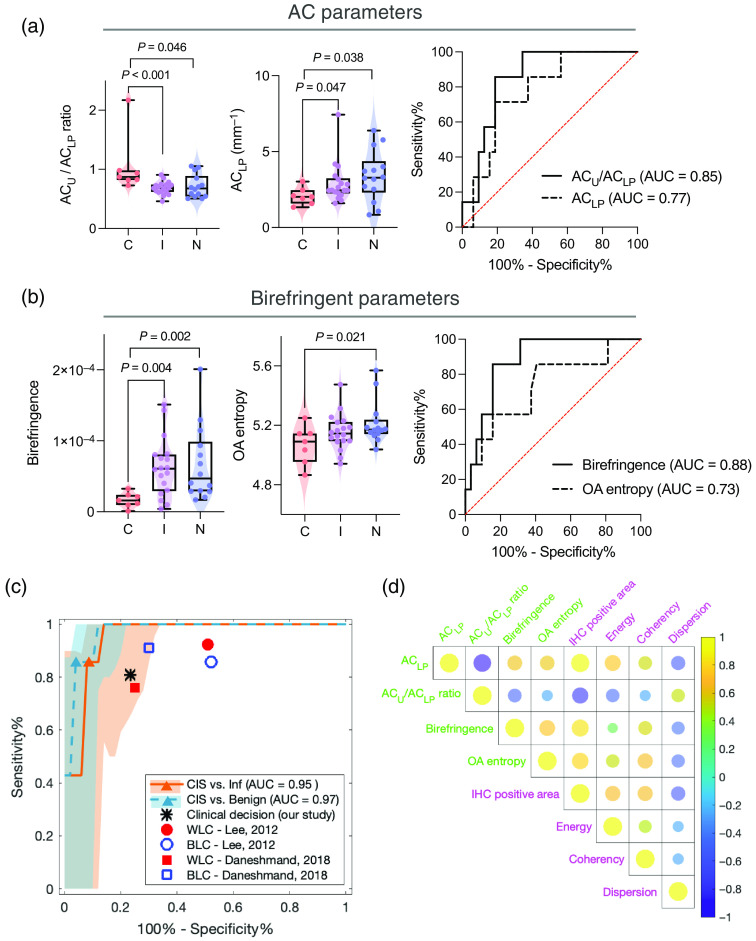
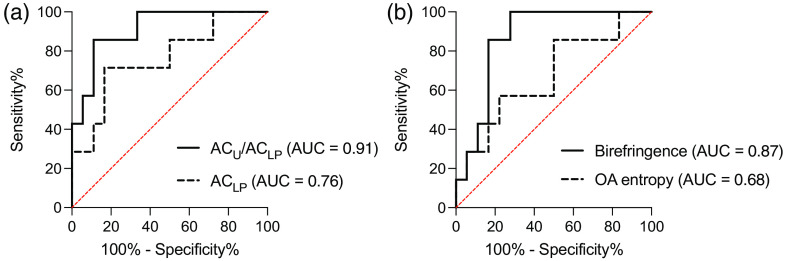
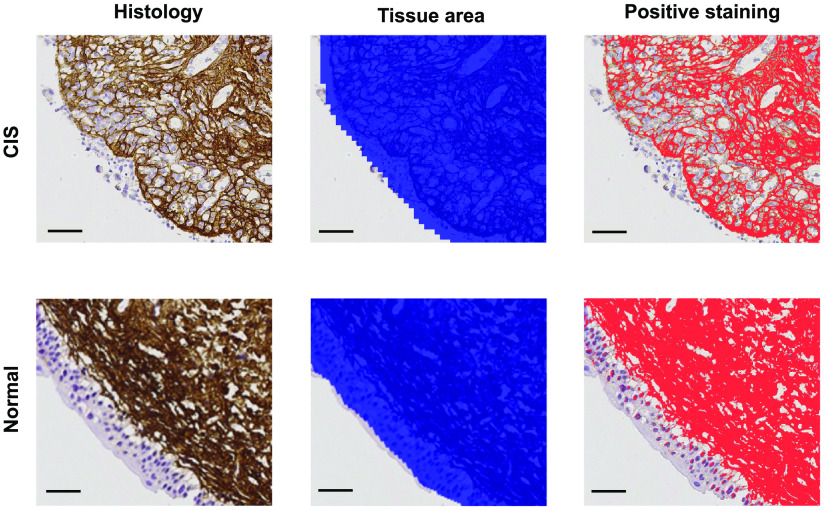
Approach: In this ex vivo study, we extract tissue attenuation-coefficient-based and birefringence-based parameters from MultiPIPE imaging data, collected with a bench-top system, to develop a classifier for the differentiation of benign and CIS tissues. We also analyze morphological features from second harmonic generation imaging and histology slides and perform imaging-to-morphology correlation analysis.

Results: MultiPIPE enhances specificity to differentiate CIS from benign tissues by nearly 20% and reduces the false-positive rate by more than four-fold over clinical standards. We also show that the MultiPIPE measurements correlate well with changes in morphological features in histological assessments.

Conclusions: The results of our study show the promise of MultiPIPE imaging to be used for better differentiation of bladder inflammation from flat tumors, leading to a fewer number of unnecessary procedures and shorter operating room (OR) time.

Keywords: bladder cancer; carcinoma in situ; inflammation; optical coherence tomography; polarization.


Figures

Fig. 1
Fig. 1
MultiPIPE analysis workflow. Fresh bladder biopsy samples were collected and imaged with PS-OCT within 1 h of resection. Following imaging, tissues were embedded and sectioned along the same or a parallel cross-sectional plane to that used for imaging. Fixed tissue slides underwent H&E and IHC staining of collagen type I and SHG imaging. MultiPIPE imaging data comprise cross-sectional intensity, attenuation, retardation, and optic axis images. Once paired with histology, quantitative measures of the regional attenuation coefficient (ACU and ACLP), birefringence, and optic axis entropy were extracted from the MultiPIPE dataset.
Fig. 2
Fig. 2
AC-assisted segmentation procedure to facilitate MultiPIPE analysis. H&E, attenuation image, and resulting AC-assisted segmentation map of representative CIS, inflammation, and normal samples. The color-coded AC-assisted segmentation map shows the urothelium (purple), inflammation regions in the LP (blue), and the normal LP (yellow). Dashed yellow lines indicate regions of inflammation in the H&E slides. U, urothelium; Inf, inflammation; LP, lamina propria. Scale bar: 200  μm.
Fig. 3
Fig. 3
Birefringence calculation and OA entropy calculation from the LP region. (a) Birefringence calculation from the LP region. The U and LP regions are naively segmented in the retardation map at 50 and 225  μm below the tissue surface, respectively. For each B-scan, the depth-dependent retardation measurements are averaged laterally within the LP region and a linear regression is performed to the retardation versus depth plot. The fitting slope is then used to determine the birefringence of the LP layer. (b) OA entropy calculation from the LP region. The LP region is defined the same way in the OA mapping. For the OA measurements in the LP region (top row), entropy maps (bottom row) are generated using a unit area of 4 pix (10  μm depth) by 20 pix (78  μm lateral). From each OA entropy map, a mean entropy value is determined and used in statistical analysis. In the example of benign and CIS OA mappings, the calculated entropy is higher in the benign than the CIS sample, suggesting greater changes in the OA with depth for the benign tissue.
Fig. 4
Fig. 4
SHG-derived maps of computed energy, computed coherency, and collagen fiber orientation. Columns 1 to 3: The energy and coherency maps derived from SHG images of representative CIS, inflammation, and normal samples indicate the strength of collagen fiber alignment. Gray boxes indicate ROIs from which energy and coherency maps are plotted. White dashed lines indicate the location of the urothelial basement membrane, and the yellow dashed line denotes the inflamed region in the inflamed sample. Normal samples have the highest energy and coherency; CIS samples have the lowest. Column 4–5: Maps of collagen fiber orientation angle (left) and plots of its distribution (right) as derived from the representative areas in the gray-boxed regions. White dashed lines indicate the location of the urothelial basement membrane, and the yellow dashed line denotes the inflamed region in the inflamed sample. Here, the distribution of collagen orientation angles shows strong alignment in the normal sample but is more dispersed in the CIS sample. The inflamed sample also shows relatively strong alignment but slightly more dispersion than the normal sample. These differences can be quantified via the orientation angle dispersion. T, tumor; LP, lamina propria; U, urothelium; inf, inflammation. Scale bar: 200  μm.
Fig. 5
Fig. 5
Visual analysis of MultiPIPE data captures differences in CIS and inflammation visible in histology. Example cases of CIS (top), inflammation (middle), and normal (bottom) samples. Left column: intensity, attenuation, retardation, and optic axis images. The attenuation image shows higher attenuation in the LP region of the inflamed sample than in CIS. The attenuation image shows the highest attenuation in the LP region of the normal sample. In the retardation and optic axis images, the CIS sample shows less variation in depth than in inflammation, and the normal sample shows the largest variation in depth. Dashed boxes show zoomed-in areas for each image that appear in the middle column. Middle column: zoomed portion of MultiPIPE and H&E images indicated by green and purple dashed boxes, respectively. Small yellow triangles point at the basement membrane of the urothelium, and large black triangles point at tumorous (top image) and inflammatory (bottom image) regions, respectively. Right column: H&E, IHC, SHG, and SHG-based collagen fiber orientation images. Comparing the SHG and orientation maps of CIS and inflammation, the LP regions near the CIS tumor show pronounced degradation of the collagen fibers evidenced as significantly diminished SHG signal and loss of directionality; similarly, the LP of the inflamed sample shows localized thinning of the collagen meshwork and changes of fiber orientation surrounding the lymphoid aggregates. The SHG and orientation maps of the normal sample show strong, uniform SHG signal and well-maintained directionality. White dashed lines in the SHG images outline the basement membrane of the urothelium. T, tumor; LP, lamina propria; U, urothelium; inf, inflammation. Scale bar: 200  μm.
Fig. 6
Fig. 6
Metrics extracted from MultiPIPE data allow for successful differentiation of CIS from benign samples with high sensitivity and specificity. (a) Analysis of AC metrics. Violin and box plot of (left) urothelium to LP AC ratio and (middle) AC value measured from the LP region in CIS, inflammation, and normal samples; (right) ROC curves to differentiate CIS from benign samples (inflammation and normal) using the two AC metrics. AUC values are reported for both. (b) Analysis of birefringent metrics. Violin and box plot of (left) birefringence and (middle) OA entropy measured from the LP region of CIS, inflammation, and normal tissues; (right) ROC curves to differentiate CIS from benign samples using the two birefringent metrics. AUC values are reported for both. (c) ROC curves are shown of multiparameter logistic regression model used for the classification of CIS versus inflammation and CIS versus benign samples. ROC curves are graphed with CIs determined using the bootstrap method (Nboot=1000). Orange and teal triangles show the locations on the ROC curves where the sensitivity and specificity measurements were obtained. (d) Correlation plot is shown to explore the correlations in MultiPIPE parameters (LP AC, U/LP AC, birefringence, OA entropy) and biological features (IHC positive staining area, SHG energy, and SHG orientation distribution). The colors and sizes of the circle indicate the degree of correlation, with yellow being strong-positively correlated and blue being strong-negatively correlated.
Fig. 7
Fig. 7
ROC curves of AC and birefringent metrics for CIS versus inflammation. (a) Analysis of AC metrics. ROC curves to differentiate CIS from inflammation using ACU/ACLP and ACLP metrics are shown; these achieved AUC values (with 95% CI) of 0.91 (0.80 to 1.00) and 0.76 (0.54 to 0.98), respectively. (b) Analysis of birefringent metrics. ROC curves to differentiate CIS from inflammation samples with birefringence and OA entropy. AUC values achieved (with 95% CI) are 0.87 (0.72 to 1.00) and 0.68 (0.43 to 0.92), respectively.
Fig. 8
Fig. 8
IHC positive staining area analysis. Representative staining results on CIS and normal sample are shown on the top and bottom row, respectively. For each IHC histology image, the total tissue area (blue) and the positive staining area (red) were determined for a given ROI. The positive staining ratio is calculated from these two measurements. Scale bar=50  μm.

Similar articles

References

    1. Seyfer P., et al. , “Cancer and inflammation: differentiation by USPIO-enhanced MR imaging,” J. Magn. Reson. Imaging 39, 665–672 (2014).10.1002/jmri.24200 - DOI - PubMed
    1. Yang Z., et al. , “Dynamic FDG-PET imaging to differentiate malignancies from inflammation in subcutaneous and in situ mouse model for non-small cell lung carcinoma (NSCLC),” PLoS One 10, 1–16 (2015).POLNCL10.1371/journal.pone.0139089 - DOI - PMC - PubMed
    1. Motiei M., et al. , “Differentiating between cancer and inflammation: a metabolic-based method for functional computed tomography imaging,” ACS Nano 10, 3469–3477 (2016).ANCAC310.1021/acsnano.5b07576 - DOI - PubMed
    1. Lee R., et al. , “Dielectric imaging for differentiation between cancer and inflammation in vivo,” Sci. Rep. 7, 13137 (2017).SRCEC310.1038/s41598-017-13545-3 - DOI - PMC - PubMed
    1. Aparisi Gómez M. P., et al. , “Inflammation and infiltration: can the radiologist draw a line? MRI versus CT to accurately assess medullary involvement in parosteal osteosarcoma,” Int. J. Biol. Markers 35, 31–36 (2020).10.1177/1724600819900516 - DOI - PubMed

MeSH terms