. 2023 Aug 9;12(1):2243112.
doi: 10.1080/2162402X.2023.2243112. eCollection 2023.

Group 2 innate lymphoid cells boost CD8+ T-cell activation in anti-tumor immune responses

Affiliations

Group 2 innate lymphoid cells boost CD8+ T-cell activation in anti-tumor immune responses

Jing Wen et al. Oncoimmunology. .

Abstract

Group 2 innate lymphoid cells (ILC2s) are essential for orchestrating type 2 immune responses during allergic airway inflammation and infection. ILC2s have been reported to play a regulatory role in tumors; however, this conclusion is controversial. In this study, we showed that IL-33-activated ILC2s could boost CD8+ T-cell function through direct antigen cross-presentation. After activation by IL-33, ILC2s showed an enhanced potential to process antigens and prime CD8+ T cell activation. Activated ILC2s could phagocytose exogenous antigens in vivo and in vitro, promoting antigen-specific CD8+ T cell function to enhance antitumor immune responses. Administration of OVA-loaded ILC2s induces robust antitumor effects on the OVA-expressing tumor model. These findings suggested that the administration of tumor antigen-loaded ILC2s might serve as a potential strategy for cancer treatment.

Keywords: CD8 T cell; ILC2; anti-tumor response; antigen presentation.


Conflict of interest statement

No potential conflict of interest was reported by the authors.

Figures
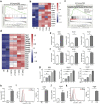
Figure 1.
Figure 1.
IL-33-activated ILC2s upregulated MHC-I molecules and molecules related to antigen processing and presentation. (a) GSEA enrichment analysis identifying the MHC-I protein complex in activated ILC2s. NES, normalized enrichment score; FDR, false discovery rate. (b) Heatmap of the log2-transformed expression of selected MHC class I-associated molecules and costimulatory molecules from RNA-sequencing data across populations. (c) GSEA enrichment analysis showing enrichment of the antigen processing and presentation of peptide antigen via MHC class I pathway. (d) Heatmap of the log2-transformed expression of selected cathepsin proteins and antigen processing-related genes. (e) RT-PCR analysis of the expression of the heavy and light chains of MHC-I: B2M, H2-D1, and H2-K1. (f) RT-PCR analysis of the expression of the heavy and light chains of MHC-1 in ILC2s stimulated with IL-33 for 3 days in vitro. (g) the levels of the heavy and light chains of MHC-I in IL-33-stimulated ILC2s were analyzed on different days by RT-PCR. (h) the level of CD80 in ILC2s was analyzed by RT-PCR. (i) Representative flow cytometric histogram overlays and quantitative analysis of CD80 expression on ILC2s from IL-33-treated mice. (j) the level of CD86 in ILC2s was analyzed by RT-PCR. (k) Representative flow cytometric histogram overlays and quantitative analysis of CD86 expression on ILC2s from IL-33-treated mice. For RNA seq and cytometric data, n = 2 mice per group; for RT-PCR, n = 2 replicates in each experiment. Data are shown as the means ± SEMs. The p value was determined by one-way ANOVA. *, p < 0.05; **, p < 0.01; ***, p < 0.001; ns, not significant.
Figure 2.
Figure 2.
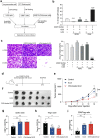
Ilc2s phagocytosed antigens in vitro and in vivo. (a) Flow cytometric histogram overlays and quantitative analysis depicting in vitro uptake of FITC-dextran by ILC2s (n = 3 independent wells). (b) Analysis of tumor-derived mCherry fluorescence in ILC2s cocultured with B16F10-SOVA tumor cells (n = 3 independent wells). (c) Schematic showing the strategy for the lung metastasis model. (d) Representative flow cytometry plot and gating of tumor-infiltrating immune cells. (e) Frequency of mCherry+ immune cells across tumors (n = 5 mice per group). (f) Representative flow cytometric histograms of tumor-derived mCherry fluorescence within tumor-infiltrating ILC2s from day 7 through day 28. (g) Frequency of mCherry+ ILC2s in the tumor over the course of tumor progression (n = 5 mice per group). (h) Flow cytometry plot and frequency of CD69+ CD8 were analyzed by flow cytometry (n = 3 independent wells). Data are shown as the means ± SEMs. The p value was determined by one-way ANOVA. *, p < 0.05; **, p < 0.01; ***, p < 0.001; ns, not significant.
Figure 3.
Figure 3.
ILC2s formed cell clusters with CD8+ T cells in the presence of antigen. (a) the cells showing red fluorescence are ILC2s, whereas those with no fluorescence are CD8+ T cells. ILC2s (2 × 10 were cocultured with CD8+ T (6 × 10 cells for 20 hours. Live cell imaging of ILC2–CD8+ T-cell interactions at different time points revealed that the cells formed constant cell clusters during the coculture. Scale bar = 50 μm or 5 μm. (b) Statistical analysis of cell cluster number per field (n = 4 views per well). (c) Statistical analysis of cell cluster area percentage per field (n = 4 views per well). Data are shown as the means ± SEMs. The p value was determined by two-way ANOVA. *, p < 0.05; **, p < 0.01; ***, p < 0.001; ns, not significant.
Figure 4.
Figure 4.
ILC2s promoted OT-I CD8+ T-cell proliferation and cytokine production with OVA-stimulation. (a) Analysis of CD8+ T-cell proliferation using CTV by flow cytometry as described in the Methods. CTV-labeled OT-I CD8+ T cells were cultured with ILC2s in the absence or presence of 10 μM OVA257–264. CD8+ T-cell proliferation was measured by flow cytometry, as shown in the histograms. Column chart showing the percentages of proliferating OT-I CD8+ T cells (n = 3 independent wells). (b) CTV-labeled OT-I CD8+ T cells were cultured with ILC2s in the absence or presence of soluble OVA protein. CD8+ T-cell proliferation was measured by flow cytometry (n = 3 independent wells). (c) After pretreatment with or without the OVA protein, isolated ILC2s and supernatants were separately cultured with CD8+ T cells. CD8+ T-cell proliferation was measured by flow cytometry (n = 3 independent wells). (d) CFSE-labeled OT-I CD8+ T cells were cultured with ILC2s in the absence or presence of soluble OVA protein or MOG protein. CD8+ T-cell proliferation was measured by flow cytometry(n = 3 independent wells). (e–f) the IFN-γ and TNF-α protein levels in the supernatants were detected by ELISA (n = 3 independent wells). (g) the percentage of GZMB+ in CD8+ T cells were detected by flow cytometry(n = 3 independent wells). Data are shown as the means ± SEMs. The p value was determined by one-way ANOVA. *, p < 0.05; **, p < 0.01; ***, p < 0.001; ns, not significant.
Figure 5.
Figure 5.
OVA-loaded ILC2s increased CD8+ T cells cytotoxicity and delayed antigen-specific tumor growth. (a) Schematic diagram of the experimental design. Activated ILC2s were loaded with OVA protein or MOG protein. The ratio of OT-I CD8+T cells to tumor cells was 10:1. (b) Representative data for LDH release from B16F10-OVA cells after treatment with OT-I CD8+ T cells induced by ILC2s (n = 3 independent wells). (c) Representative images of B16F10-OVA cells stained with crystal violet after co-culture with OT-I CD8+ T cells. Statistical analysis of the areas of living cells at the bottom of the plate was performed (n = 3 views per well). Data are shown as the mean ± SEMs. The p value was determined using one-way ANOVA. *, p < 0.05; **, p < 0.01; ***, p < 0.001; ns, not significant. (d) B16F10-OVA(2 × 10 mixed with OVA loaded or not ILC2s (2 × 10 were inoculated subcutaneously until the maximum tumor reached ~1000 mm3. (e–f) Tumor growth curve and volume in different treatment groups (n = 4–6 mice per group). Data are shown as the mean ± SEMs. The p value was determined using a two-way ANOVA. *, p < 0.05; **, p < 0.01; ***, p < 0.001; ns, not significant. (g–i) the percentages of CD8+ T cells and Treg cells and cell ratio in the tumors of ILC2- and OVA-loaded ILC2-treated mice and control mice (n = 4–6 mice per group). Data are shown as the mean ± SEMs. The p value was determined by one-way ANOVA. *, p < 0.05; **, p < 0.01; ***, p < 0.001; ns, not significant.
Figure 6.
Figure 6.
Adoptive transfer of OVA-loaded ILC2s inhibited B16F10-OVA lung metastasis. (a) Schematic diagram showing strategy for OVA-loaded ILC2s adoptive transfer treatment in lung metastasis model. (b) Representative pictures of lung tumor clones. (c) Representative photomicrographs of haematoxylin/eosin(HE)-stained lung sections. (d) the metastatic tumor nodules in lung in different treatment group (n = 6 mice per group). (e) the lung weight in different treatment group (n = 3 mice per group). (f–h) the percentages of CD8+ T cells and Treg cells and cell ratio in the tumors of ILC2- and OVA-loaded ILC2-treated mice and control mice (n = 3 mice per group). Data are shown as the means ± SEMs. The p value was determined by one-way ANOVA. *, p < 0.05; **, p < 0.01; ***, p < 0.001; ns, not significant.

Similar articles

Cited by

References

    1. Gurram RK, Zhu J.. Orchestration between ILC2s and Th2 cells in shaping type 2 immune responses. Cell Mol Immunol. 2019;16(3):225–13. doi:10.1038/s41423-019-0210-8. - DOI - PMC - PubMed
    1. Mjösberg J, Bernink J, Golebski K, Karrich J, Peters C, Blom B, Te Velde A, Fokkens W, van Drunen C, Spits H, et al. The transcription factor GATA3 is essential for the function of human type 2 innate lymphoid cells. Immunity. 2012;37(4):649–659. doi: 10.1016/j.immuni.2012.08.015. - DOI - PubMed
    1. Ferreira ACF, Szeto ACH, Heycock MWD, Clark PA, Walker JA, Crisp A, Barlow JL, Kitching S, Lim A, Gogoi M, et al. RORα is a critical checkpoint for T cell and ILC2 commitment in the embryonic thymus. Nat Immunol. 2021;22(2):166–178. doi: 10.1038/s41590-020-00833-w. - DOI - PMC - PubMed
    1. Eberl G, Colonna M, Di Santo JP, McKenzie AN. Innate lymphoid cells. Innate lymphoid cells: a new paradigm in immunology. Sci. 2015;348(6237):aaa6566. doi:10.1126/science.aaa6566. - DOI - PMC - PubMed
    1. Oliphant CJ, Hwang Y, Walker J, Salimi M, Wong S, Brewer J, Englezakis A, Barlow J, Hams E, Scanlon S, et al. MHCII-mediated dialog between group 2 innate lymphoid cells and CD4(+) T cells potentiates type 2 immunity and promotes parasitic helminth expulsion. Immunity. 2014;41(2):283–295. doi: 10.1016/j.immuni.2014.06.016. - DOI - PMC - PubMed

Publication types