. 2023 Jul 17;3(1):vbad092.
doi: 10.1093/bioadv/vbad092. eCollection 2023.

Improving taxonomic classification with feature space balancing

Affiliations

Improving taxonomic classification with feature space balancing

Wolfgang Fuhl et al. Bioinform Adv. .

Abstract

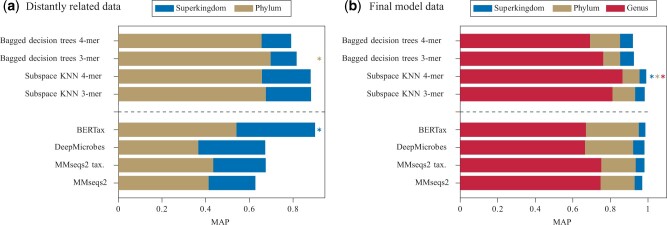
Summary: Modern high-throughput sequencing technologies, such as metagenomic sequencing, generate millions of sequences that need to be assigned to their taxonomic rank. Modern approaches either apply local alignment to existing databases, such as MMseqs2, or use deep neural networks, as in DeepMicrobes and BERTax. Due to the increasing size of datasets and databases, alignment-based approaches are expensive in terms of runtime. Deep learning-based approaches can require specialized hardware and consume large amounts of energy. In this article, we propose to use k-mer profiles of DNA sequences as features for taxonomic classification. Although k-mer profiles have been used before, we were able to significantly increase their predictive power significantly by applying a feature space balancing approach to the training data. This greatly improved the generalization quality of the classifiers. We have implemented different pipelines using our proposed feature extraction and dataset balancing in combination with different simple classifiers, such as bagged decision trees or feature subspace KNNs. By comparing the performance of our pipelines with state-of-the-art algorithms, such as BERTax and MMseqs2 on two different datasets, we show that our pipelines outperform these in almost all classification tasks. In particular, sequences from organisms that were not part of the training were classified with high precision.

Availability and implementation: The open-source code and the code to reproduce the results is available in Seafile, at https://tinyurl.com/ysk47fmr.

Supplementary information: Supplementary data are available at Bioinformatics Advances online.


Conflict of interest statement

The authors have no conflicts of interest to declare. All authors have seen and agree with the contents of the manuscript and there is no financial interest to report.

Figures

Figure 1.
Figure 1.
Simplified visualization of the dataset balancing approach. The feature space is considered 2D, where each dimension represents the relative frequency of a specific k-mer. Note: For visualization reasons, we neglected that frequencies must add up to one. (a) Samples are not uniformly distributed across the feature space. The upper right area contains relatively more samples than the rest of the feature space, thus the dataset is imbalanced. (b) Balancing the feature space distribution. The feature space is initialized with 15 samples from all four superkingdom classes. The number of grid cells G (per dimension) is set to 10. Due to the current maximal cell count Cmax of 5, a new potential next sample is accepted (1<Cmax) or rejected (5=Cmax), respectively
Figure 2.
Figure 2.
Proposed pipeline. (a) Sequences of length 1500 nt originating from four superkingdoms are used as input. (b) From each sequence, k-mer profiles—the relative frequency of all 4k possible words of length k—are extracted and used as features. (c) Training data are balanced using an undersampling approach. Dense regions of the feature space are thinned out. This reduces the size of the training set. (d and e) The balanced and curated training data are used to train simple supervised learning classifiers. (f) Depending on the taxonomic rank of the given label, the test sequences are taxonomically classified at the superkingdom, phylum, or genus level
Figure 3.
Figure 3.
(a) Performance evaluation of a classifier (ensemble of bagged decision trees) trained on imbalanced (none) or balanced training data of the distantly related dataset using different grid sizes G. Relative k-mer frequencies were used as features. Mean MAP values and 1σ-intervals over different choices of k{1,2,3,4,5} are shown. (b) Effect of data balancing (N=6×10⁵,G=10) on the sample distribution of the distantly related training set. C¯=Cbefore+Cafter2 describes the average sample count per grid cell before and after data balancing. ΔC=CafterCbefore describes the number of samples that were removed per grid cell
Figure 4.
Figure 4.
Performance comparison in terms of MAP of several pipelines implementing our approach (upper four bars) with state-of-the-art methods. Note that performance values for state-of-the-art methods were taken from Mock et al. (2022). Results for the distantly related (a) and final model dataset (b) are shown. The best classification performances are labeled by asterisks

Similar articles

Cited by

References

    1. Altschul S.F. et al. (1990) Basic local alignment search tool. J. Mol. Biol., 215, 403–410. - PubMed
    1. Buchfink B. et al. (2015) Fast and sensitive protein alignment using diamond. Nat. Methods, 12, 59–60. - PubMed
    1. Buchfink B. et al. (2021) Sensitive protein alignments at tree-of-life scale using diamond. Nat. Methods, 18, 366–368. - PMC - PubMed
    1. Hoshino T. et al. (2020) Global diversity of microbial communities in marine sediment. Proc. Natl. Acad. Sci. USA, 117, 27587–27597. - PMC - PubMed
    1. Howe A.C. et al. (2014) Tackling soil diversity with the assembly of large, complex metagenomes. Proc. Natl. Acad. Sci. USA, 111, 4904–4909. - PMC - PubMed