. 2023 Jul;13(7):817-829.
doi: 10.1016/j.jpha.2023.02.006. Epub 2023 Feb 24.

Single-cell transcriptome analysis reveals the regulatory effects of artesunate on splenic immune cells in polymicrobial sepsis

Affiliations

Single-cell transcriptome analysis reveals the regulatory effects of artesunate on splenic immune cells in polymicrobial sepsis

Jiayun Chen et al. J Pharm Anal. 2023 Jul.

Abstract

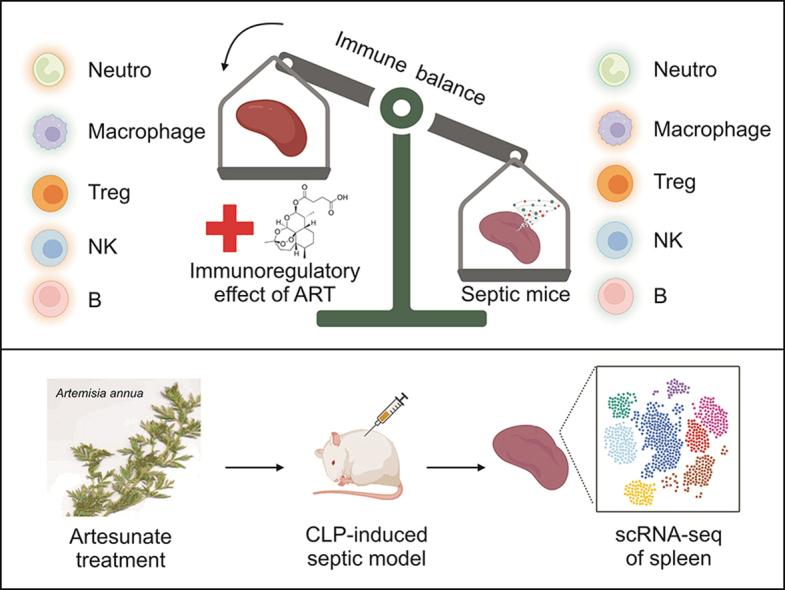
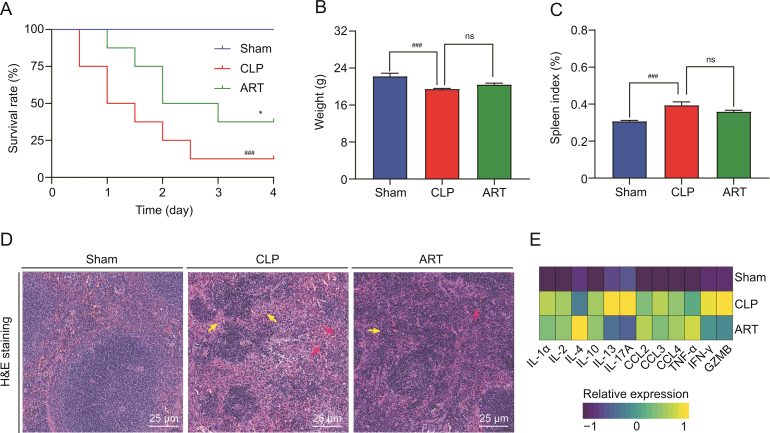
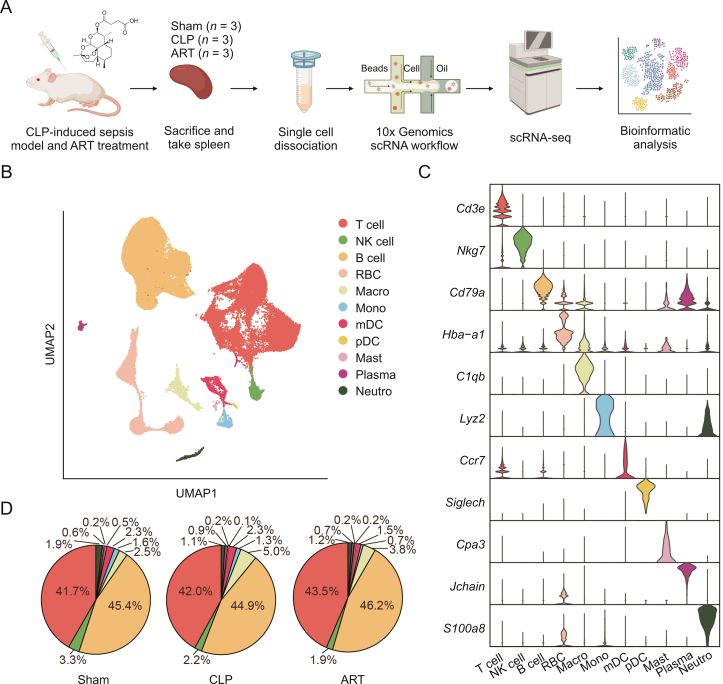
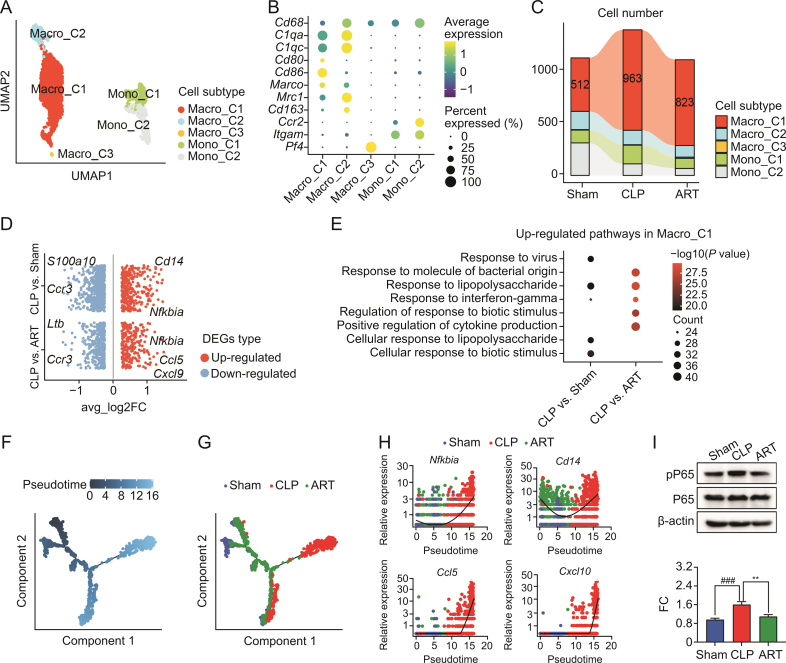
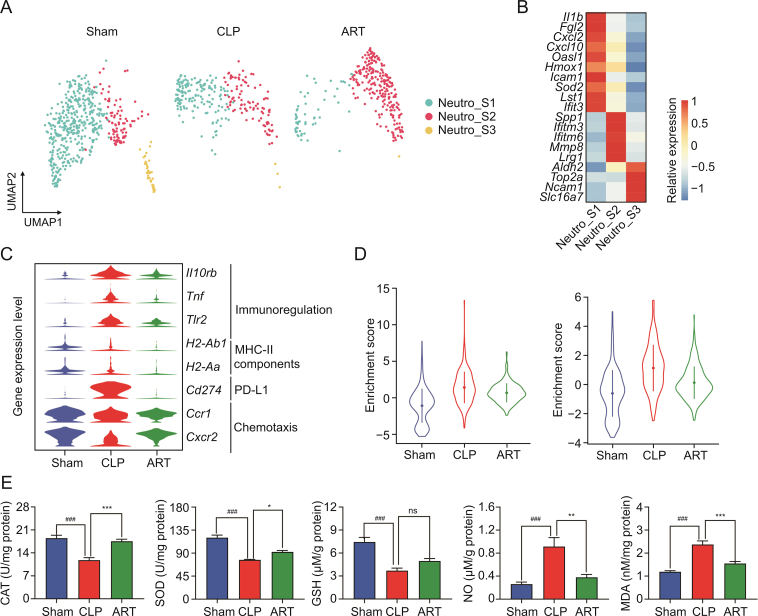
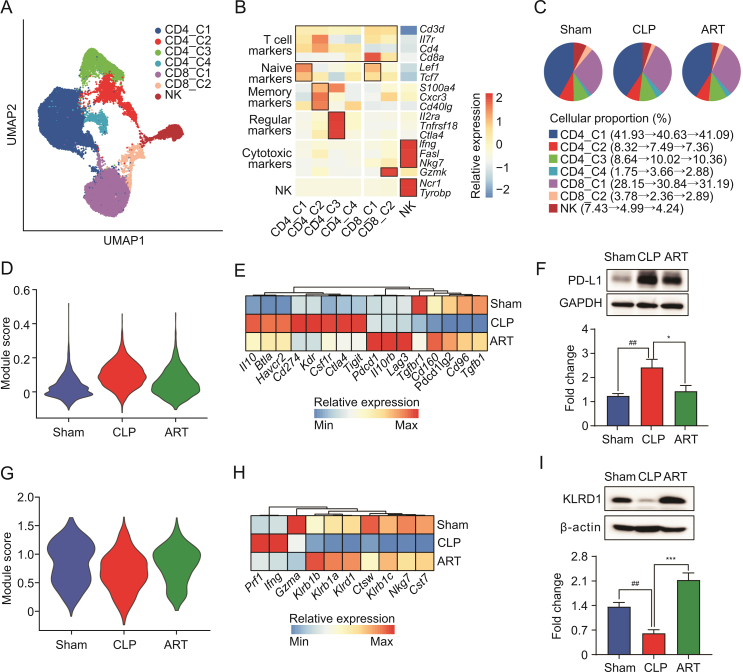
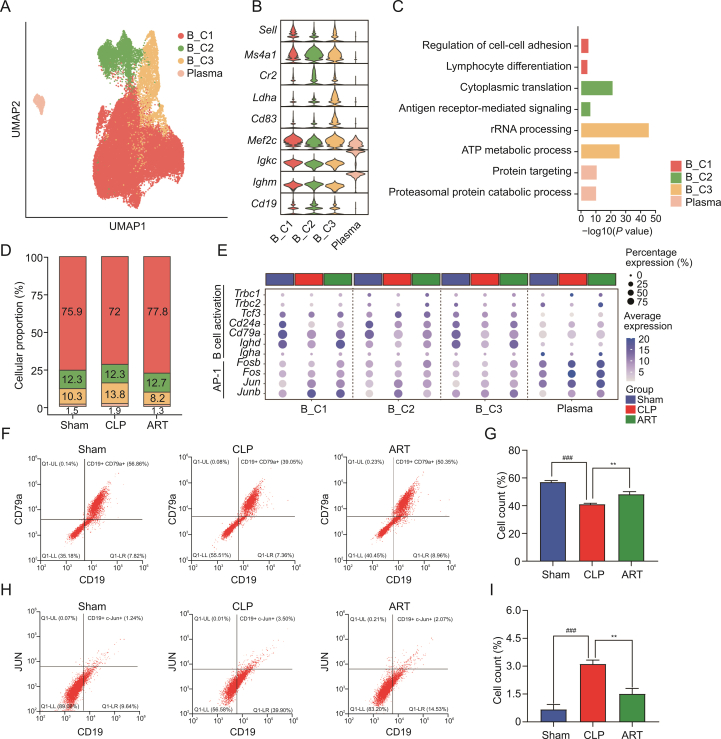
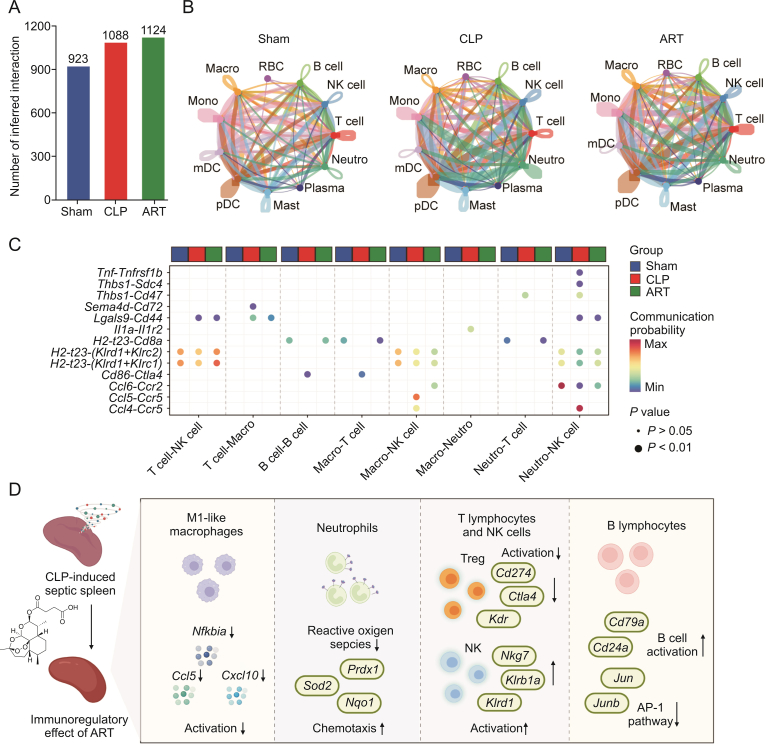
Sepsis is characterized by a severe and life-threatening host immune response to polymicrobial infection accompanied by organ dysfunction. Studies on the therapeutic effect and mechanism of immunomodulatory drugs on the sepsis-induced hyperinflammatory or immunosuppression states of various immune cells remain limited. This study aimed to investigate the protective effects and underlying mechanism of artesunate (ART) on the splenic microenvironment of cecal ligation and puncture-induced sepsis model mice using single-cell RNA sequencing (scRNA-seq) and experimental validations. The scRNA-seq analysis revealed that ART inhibited the activation of pro-inflammatory macrophages recruited during sepsis. ART could restore neutrophils' chemotaxis and immune function in the septic spleen. It inhibited the activation of T regulatory cells but promoted the cytotoxic function of natural killer cells during sepsis. ART also promoted the differentiation and activity of splenic B cells in mice with sepsis. These results indicated that ART could alleviate the inflammatory and/or immunosuppressive states of various immune cells involved in sepsis to balance the immune homeostasis within the host. Overall, this study provided a comprehensive investigation of the regulatory effect of ART on the splenic microenvironment in sepsis, thus contributing to the application of ART as adjunctive therapy for the clinical treatment of sepsis.

Keywords: Artesunate; Immunomodulatory activity; Sepsis; Single-cell RNA sequencing.


Conflict of interest statement

The authors declare that there are no conflicts of interest.

Figures

Image 1
Graphical abstract
Fig. 1
Fig. 1
Cecal ligation and puncture (CLP)-induced spleen injury in septic mice and artesunate (ART) therapy. (A) The survival rates of septic mice in three groups were recorded over 4 days (n = 12). (B) Body weight in mice of each group (n = 6). (C) Spleen index in mice of each group (n = 6). (D) Hematoxylin and eosin (H&E) staining diagram (40×) of the spleen tissues in each group. The yellow arrows indicate the white pulp that had started to enlarge and fuse, and the red arrows indicate some necrotic and apoptotic bodies. (E) Heatmap of Luminex liquid suspension chip analysis indicates the relative expression level of various cytokines and chemokine in splenic interstitial fluid derived from mice of each group (n = 6). P < 0.05 and ###P < 0.001; ns: no significance; IL: interleukin; CCL: C–C motif chemokine ligand; TNF: tumor necrosis factor; IFN: interferon; GZMB: granzyme B.
Fig. 2
Fig. 2
Single-cell transcriptomic profiling of mouse spleen of sepsis induction and after artesunate (ART) treatment. (A) Schematic workflow depicts the single-cell transcriptomics experiment design and analysis of the current study. (B) The Uniform Manifold Approximation and Projection (UMAP) visualization shows unsupervised single-cell RNA sequencing (scRNA-seq) clustering, revealing 11 distinct cellular identities. (C) The violin plot shows the expression levels of the respective selected markers across 11 clusters. The y-axis shows the log-scale normalized reads count. (D) The pie charts show the cellular proportion among 10 immune types except for red blood cell (RBC), accompanied by cellular percentage in each group, colored according to cell types. CLP: cecal ligation and puncture; NK: natural killer; Macro: macrophage; Mono: monocyte; mDC: myeloid dendritic cell; pDC: plasmacytoid dendritic cell; Mast: Mast cell; Plasma: plasma cell; Neutro: neutrophil.
Fig. 3
Fig. 3
Artesunate (ART) effectively inhibits the recruitment and activation of macrophages in the cecal ligation and puncture (CLP)-induced sepsis mice. (A) The Uniform Manifold Approximation and Projection (UMAP) visualization shows unsupervised clustering, revealing 5 distinct subtypes of macrophage cells: Macro_C1, Macro_C2, Macro_C3, Mono_C1, and Mono_2. (B) The bubble plot depicts the cell markers expression of each macrophage subtype. (C) The Sankey plot shows the cellular proportion among five macrophage subtypes in each group, colored according to subtypes. (D) The visualization shows the scatter plot of the average log2 fold change (FC) value in both up-regulated and down-regulated differentially expressed genes (DEGs) of CLP vs. Sham and CLP vs. ART in Marco_C1 subtype, respectively. (E) Pathway enrichment analysis of overlapping up-regulated DEGs in the CLP group compared with the Sham group, as well as in the CLP group compared with the ART group in the Macro_C1 subtype. (F, G) Pesudotime trajectory inference traces a path of pesudotime (F) and three group types (G). (H) The scatter plot shows the relative gene expression level of 4 representative genes (Nfkbia, Cd14, Ccl5, and Cxcl10) in pseudotime, colored according to group types. (I) The expression of pro-inflammatory factors phospho-nuclear factor kappa B (NF-κB) P65 (pP65) and NF-κB P65 (P65) proteins by Western blot (WB) assay (up) and quantitative statistics of the FC of pP65/P65 proteins' expression level among three groups (down) (n = 3). ∗∗P < 0.01 and ###P < 0.001. Macro: macrophage; Mono: monocyte.
Fig. 4
Fig. 4
Artesunate (ART) regulates cellular dysfunctions and reactive oxygen species of neutrophils (Neutro) in the cecal ligation and puncture (CLP)-induced sepsis mice. (A) The Uniform Manifold Approximation and Projection (UMAP) plots show unsupervised clustering, revealing the distribution of 3 Neutro subtypes in three groups. (B) The heatmap plot depicts the cell markers expression of 3 Neutro cell subtypes. (C) The violin plot shows the relative expression levels of representative genes of Neutro of each group. (D) The violin plot shows the relative expression levels of apoptosis (left) and reactive oxygen species (ROS) (right) pathways of Neutro in three groups. (E) The barplots show the expression level of reactive oxygen products in three groups. P < 0.05; ∗∗P < 0.01; ∗∗∗P < 0.001; and ###P < 0.001; ns: no significance. MHC-II: major histocompatibility complex-II; PD-L1: programmed death; CAT: catalase; SOD: superoxide dismutase; GSH: glutathione; NO: nitric oxide; MDA: malondialdehyde.
Fig. 5
Fig. 5
Artesunate (ART) regulates the immune reaction of T lymphocytes and natural killer (NK) cells in the cecal ligation and puncture (CLP)-induced sepsis mice. (A) The Uniform Manifold Approximation and Projection (UMAP) visualization shows unsupervised clustering, revealing 7 distinct subtypes of T lymphocytes and NK cells: CD4_C1, CD4_C2, CD4_C3, CD4_C4, CD8_C1, CD8_C2, and NK. (B) The heatmap plot depicts the cell markers expression of each subtype in T lymphocytes and NK cells, including T cell, naïve, effector, memory, regulatory, cytotoxic, and NK markers. (C) The pie charts show the cellular proportion among seven T lymphocytes and NK subtypes in each group, colored according to subtypes. (D) The violin plot shows regulatory module scores of the CD4_C3 subtype in the Sham, CLP, and ART groups. (E) The heatmap plot depicts representative genes of regulatory modules in the CD4_3 subtype across three groups. (F) The protein expression level of PD-L1 by Western blot (WB) (up) and quantitative statistics among three groups (down) (n = 3). (G) The violin plot shows cytotoxic module scores of the NK subtype in the Sham, CLP, and ART groups. (H) The heatmap plot depicts representative genes of cytotoxic modules in the NK subtype across three groups. (I) The protein expression level of KRLD1 by WB (up) and quantitative statistics among three groups (down) (n = 3). P < 0.05; ∗∗∗P < 0.001; and ##P < 0.01. PD-L1: programmed death 1; GAPDH: glyceraldehyde-3-phosphate dehydrogenase.
Fig. 6
Fig. 6
Artesunate (ART) influences the differentiation and activation of B cells in cecal ligation and puncture (CLP)-induced sepsis mice. (A) The Uniform Manifold Approximation and Projection (UMAP) visualization shows the B cells populations in the spleen, and colors indicate the cell types. (B) Violin plots show the relative expression levels of the B cells marker gene in each subtype. (C) The bar plot shows enriched pathways based on the up-regulated DEGs among B cell subtypes, colored by each subtype. (D) The bar chart shows the subtype proportion of B cells in three groups, colored by subtypes. (E) The dot plot displays the expression level of genes involved in B activation, and activator protein-1 (AP-1) gene families of different B cell subtypes across three groups. (F, G) Flow cytometry analysis shows the proportion (F) and cell counts (G) of activated B cells among three groups. (H, I) Flow cytometry analysis shows the proportion and cell counts of AP-1 positive B cells among three groups. ∗∗P < 0.01 and ###P < 0.001. Plasma: plasma cells; ATP: adenosine. triphosphate; UL: upper left; LL: lower left; LR: lower right.
Fig. 7
Fig. 7
Artesunate (ART) regulates the imbalanced cell-cell communication in the cecal ligation and puncture (CLP)-induced sepsis mouse spleen. (A) The bar plot shows the number of inferred intercellular interactions in three groups. (B) The chordal graphs show the total cell-cell interaction patterns across various cell types among the Sham, CLP, and ART groups, colored by each cell type. (C) The bubble plot shows the communication probability of ligand-receptor pairs among various cell types, colored by group types. (D) The schematic diagram shows the cellular and molecular mechanisms of artesunate in the treatment of sepsis-induced splenic immunologic dissonance. RBC: red blood cell; NK: natural killer; Neutro: neutrophil; Macro: macrophage; Mono: Monocyte; mDC: myeloid dendritic cell; pDC: plasmacytoid dendritic cell; Mast: Mast cell; Plasma: Plasma cell; AP-1: activator protein-1.

Similar articles

Cited by

References

    1. Singer M., Deutschman C.S., Seymour C.W., et al. The third international consensus definitions for sepsis and septic shock (sepsis-3) JAMA. 2016;315:801–810. - PMC - PubMed
    1. van der Poll T., Shankar-Hari M., Wiersinga W.J. The immunology of sepsis. Immunity. 2021;54:2450–2464. - PubMed
    1. Hotchkiss R.S., Monneret G., Payen D. Sepsis-induced immunosuppression: From cellular dysfunctions to immunotherapy. Nat. Rev. Immunol. 2013;13:862–874. - PMC - PubMed
    1. van der Poll T., van de Veerdonk F.L., Scicluna B.P., et al. The immunopathology of sepsis and potential therapeutic targets. Nat. Rev. Immunol. 2017;17:407–420. - PubMed
    1. Lewis S.M., Williams A., Eisenbarth S.C. Structure and function of the immune system in the spleen. Sci. Immunol. 2019;4 - PMC - PubMed

LinkOut - more resources