

A Scd1-mediated metabolic alteration participates in liver responses to low-dose bavachin
- PMID: 37577386
- PMCID: PMC10422113
- DOI: 10.1016/j.jpha.2023.03.010
A Scd1-mediated metabolic alteration participates in liver responses to low-dose bavachin
Abstract
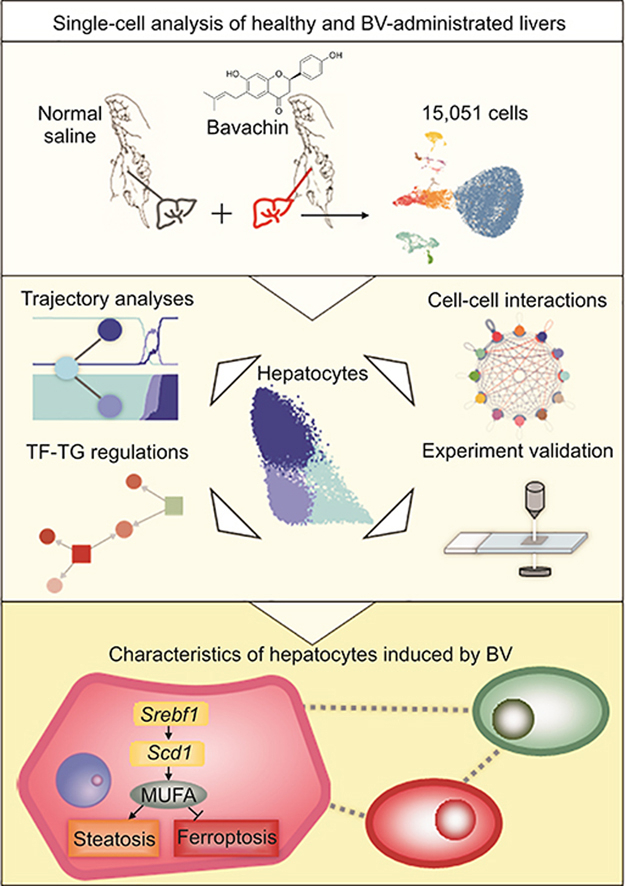
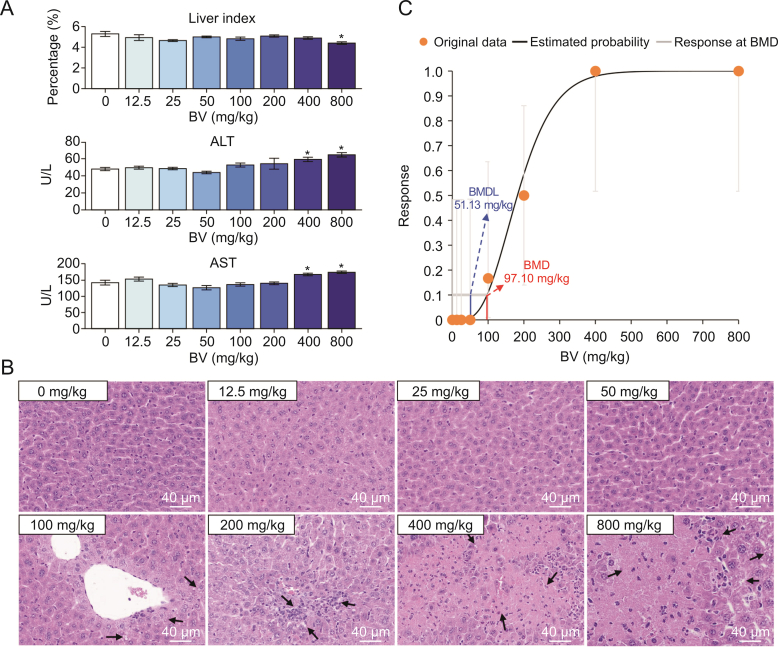
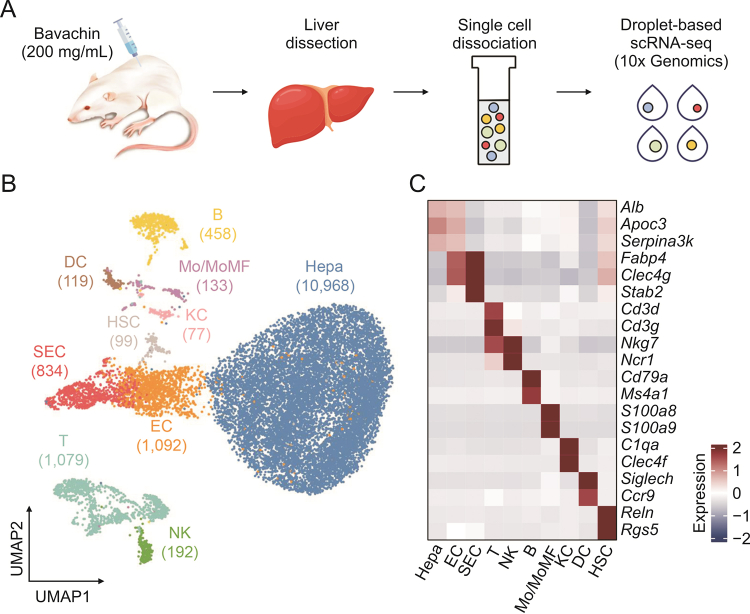
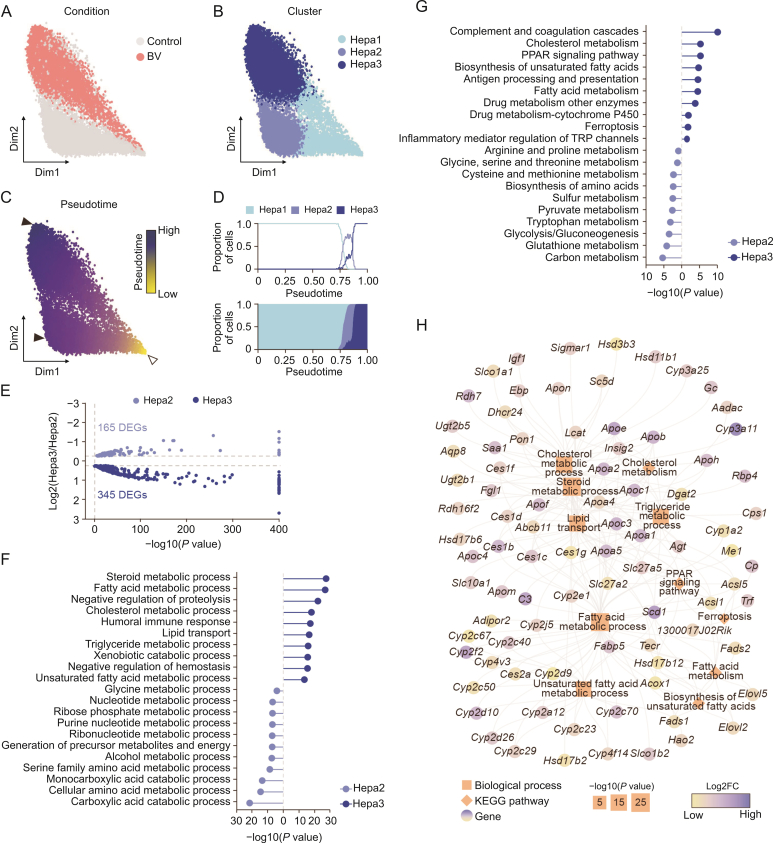
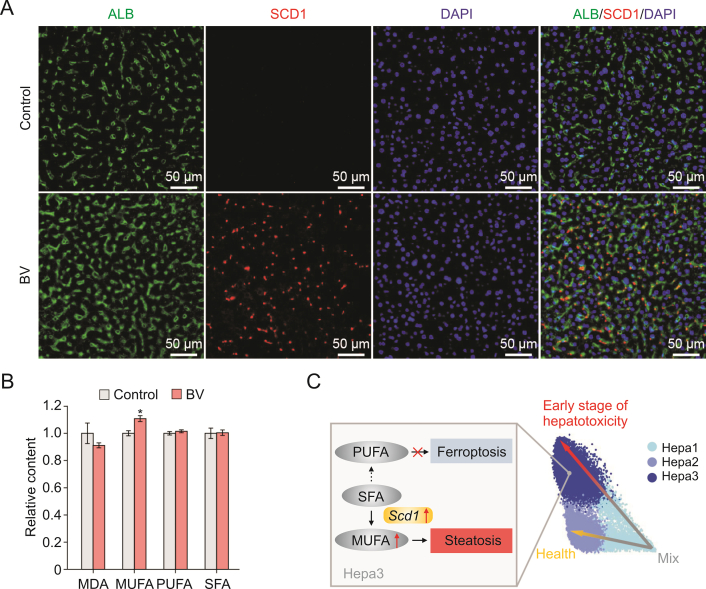
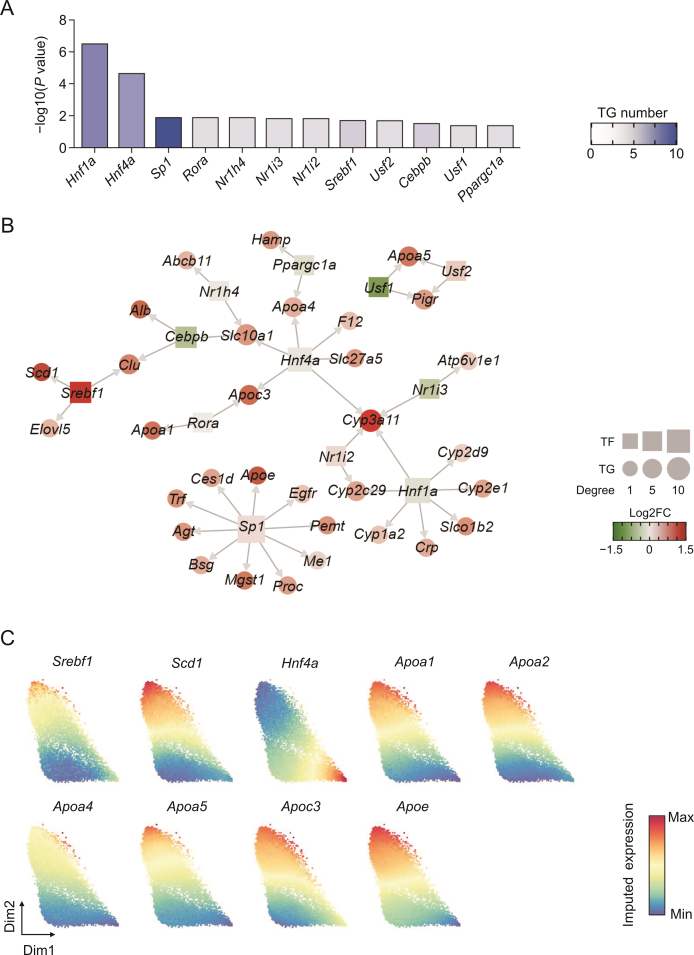
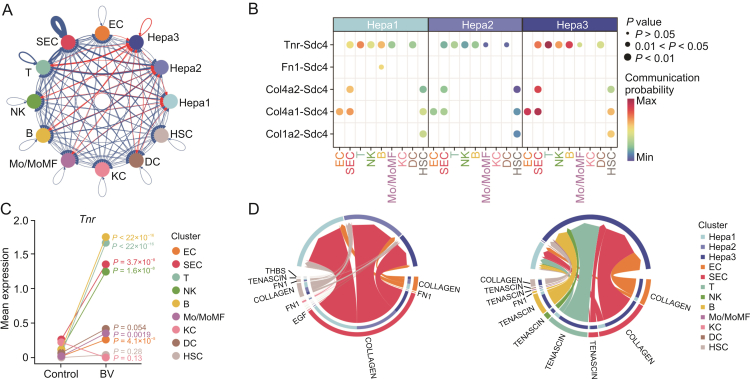
Hepatotoxicity induced by bioactive constituents in traditional Chinese medicines or herbs, such as bavachin (BV) in Fructus Psoraleae, has a prolonged latency to overt drug-induced liver injury in the clinic. Several studies have described BV-induced liver damage and underlying toxicity mechanisms, but little attention has been paid to the deciphering of organisms or cellular responses to BV at no-observed-adverse-effect level, and the underlying molecular mechanisms and specific indicators are also lacking during the asymptomatic phase, making it much harder for early recognition of hepatotoxicity. Here, we treated mice with BV for 7 days and did not detect any abnormalities in biochemical tests, but found subtle steatosis in BV-treated hepatocytes. We then profiled the gene expression of hepatocytes and non-parenchymal cells at single-cell resolution and discovered three types of hepatocyte subsets in the BV-treated liver. Among these, the hepa3 subtype suffered from a vast alteration in lipid metabolism, which was characterized by enhanced expression of apolipoproteins, carboxylesterases, and stearoyl-CoA desaturase 1 (Scd1). In particular, increased Scd1 promoted monounsaturated fatty acids (MUFAs) synthesis and was considered to be related to BV-induced steatosis and polyunsaturated fatty acids (PUFAs) generation, which participates in the initiation of ferroptosis. Additionally, we demonstrated that multiple intrinsic transcription factors, including Srebf1 and Hnf4a, and extrinsic signals from niche cells may regulate the above-mentioned molecular events in BV-treated hepatocytes. Collectively, our study deciphered the features of hepatocytes in response to BV insult, decoded the underlying molecular mechanisms, and suggested that Scd1 could be a hub molecule for the prediction of hepatotoxicity at an early stage.
Keywords: Bavachin; Hepatotoxicity; Lipid metabolism; Scd1; Single-cell RNA-Seq.
© 2023 The Authors.
Conflict of interest statement
The authors declare that there are no conflicts of interest.
Figures
Similar articles
-
Aramchol downregulates stearoyl CoA-desaturase 1 in hepatic stellate cells to attenuate cellular fibrogenesis.JHEP Rep. 2021 Jan 28;3(3):100237. doi: 10.1016/j.jhepr.2021.100237. eCollection 2021 Jun. JHEP Rep. 2021. PMID: 34151243 Free PMC article.
-
Aryl hydrocarbon receptor-mediated induction of Stearoyl-CoA desaturase 1 alters hepatic fatty acid composition in TCDD-elicited steatosis.Toxicol Sci. 2011 Dec;124(2):299-310. doi: 10.1093/toxsci/kfr226. Epub 2011 Sep 2. Toxicol Sci. 2011. PMID: 21890736 Free PMC article.
-
Hepatic stearoyl CoA desaturase 1 deficiency increases glucose uptake in adipose tissue partially through the PGC-1α-FGF21 axis in mice.J Biol Chem. 2019 Dec 20;294(51):19475-19485. doi: 10.1074/jbc.RA119.009868. Epub 2019 Nov 5. J Biol Chem. 2019. PMID: 31690632 Free PMC article.
-
Stearoyl-CoA Desaturase 1 as a Therapeutic Biomarker: Focusing on Cancer Stem Cells.Int J Mol Sci. 2023 May 18;24(10):8951. doi: 10.3390/ijms24108951. Int J Mol Sci. 2023. PMID: 37240297 Free PMC article. Review.
-
Stearoyl-CoA desaturase 1 as a therapeutic target for cancer: a focus on hepatocellular carcinoma.Mol Biol Rep. 2022 Sep;49(9):8871-8882. doi: 10.1007/s11033-021-07094-2. Epub 2022 Jul 29. Mol Biol Rep. 2022. PMID: 35906508 Review.
Cited by
-
A comprehension and systematic insight into the interaction between ferroptosis and virus infection: The implications of mechanisms and strategies.Virulence. 2025 Dec;16(1):2532806. doi: 10.1080/21505594.2025.2532806. Epub 2025 Jul 14. Virulence. 2025. PMID: 40658446 Free PMC article. Review.
-
Gremlin1 repression-mediated mitochondrial network hyperfunction contributes to TCE-induced zebrafish cardiac defects.Cell Commun Signal. 2025 Jul 1;23(1):318. doi: 10.1186/s12964-025-02314-9. Cell Commun Signal. 2025. PMID: 40597303 Free PMC article.
References
-
- Andrade R.J., Chalasani N., Björnsson E.S., et al. Drug-induced liver injury. Nat. Rev. Dis. Primers. 2019;5 - PubMed
-
- Gong L., Wang G., Ma Q., et al. Novel insights into the effect of Xiaoyao San on corticosterone-induced hepatic steatosis: Inhibition of glucocorticoid receptor/perilipin-2 signaling pathway. Acupunct. Herb. Med. 2022;2:49–57.
-
- Chopra B., Dhingra A.K., Dhar K.L. Psoralea corylifolia L. (Buguchi)—Folklore to modern evidence: Review. Fitoterapia. 2013;90:44–56. - PubMed
-
- Nam S.W., Baek J.T., Lee D.S., et al. A case of acute cholestatic hepatitis associated with the seeds of Psoralea corylifolia (Boh-gol-zhee) Clin. Toxicol. 2005;43:589–591. - PubMed
LinkOut - more resources
Full Text Sources
Molecular Biology Databases
