[Preprint]. 2023 Aug 3:2023.08.02.551727.
doi: 10.1101/2023.08.02.551727.

Fucosylated glycoproteins and fucosylated glycolipids play opposing roles in cholera intoxication

Affiliations

Fucosylated glycoproteins and fucosylated glycolipids play opposing roles in cholera intoxication

Atossa C Ghorashi et al. bioRxiv. .

Update in

Abstract

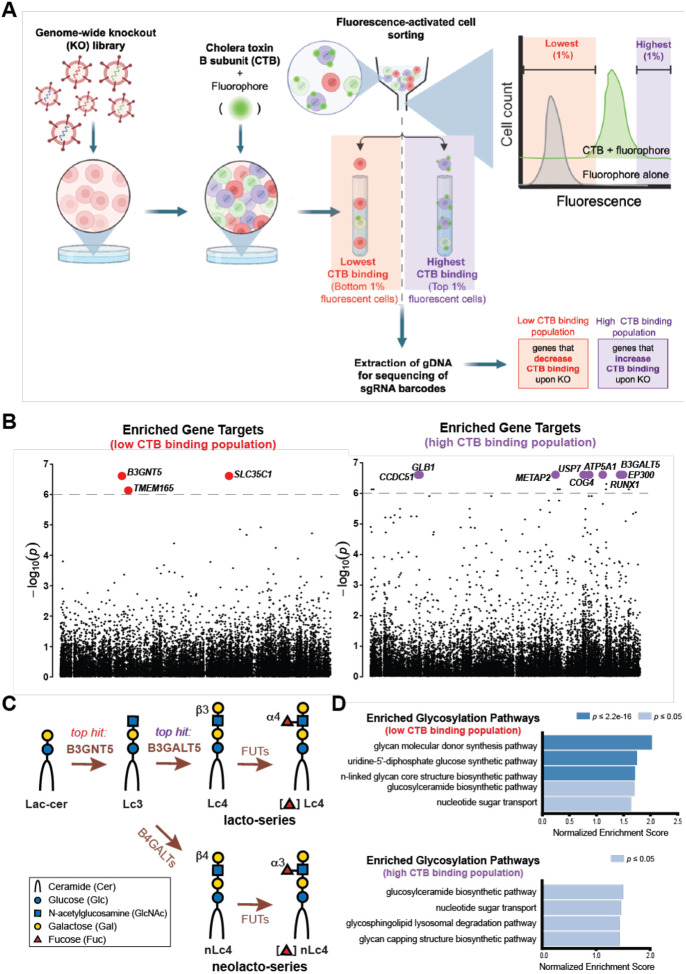
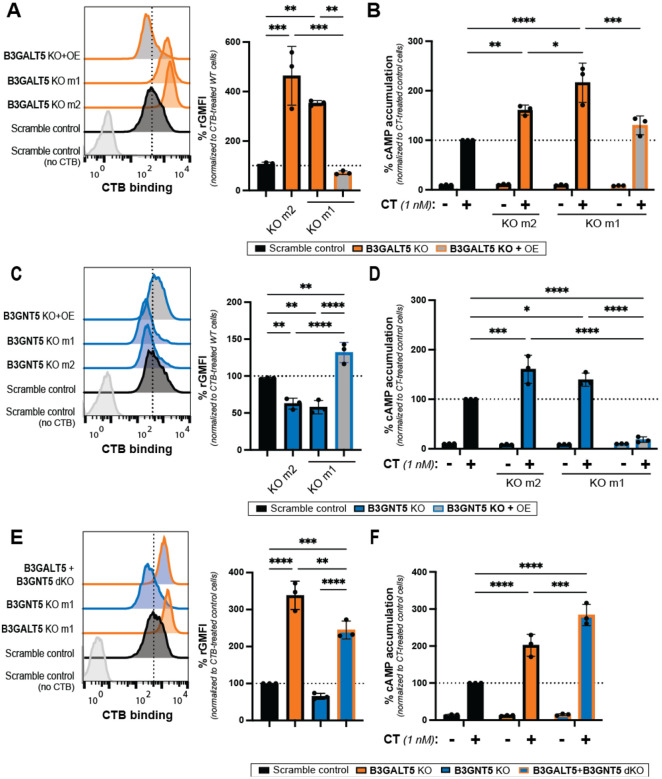
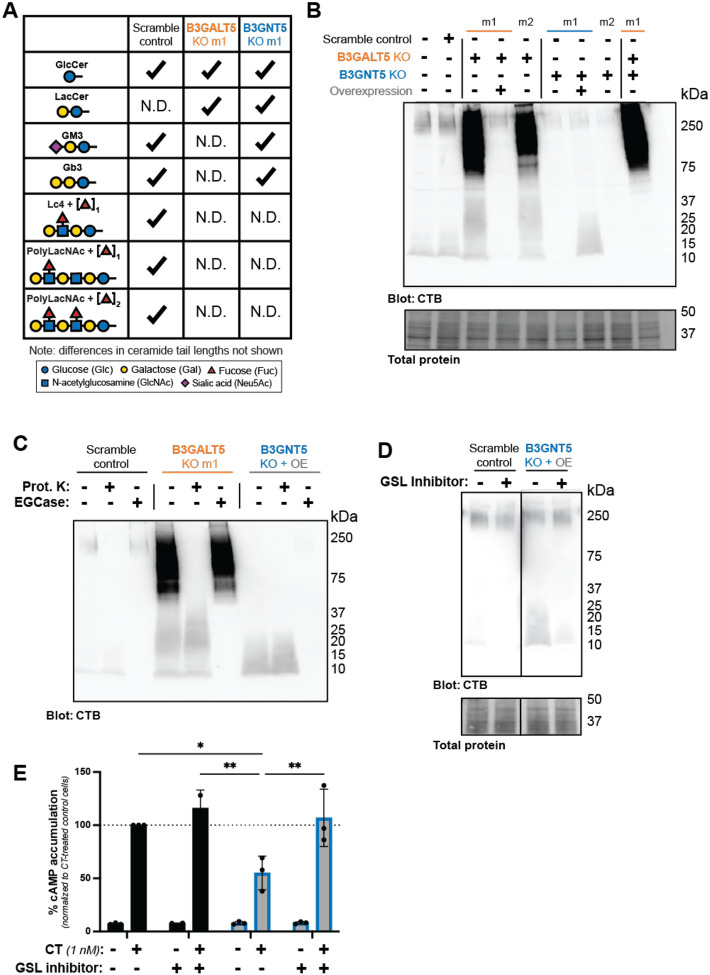
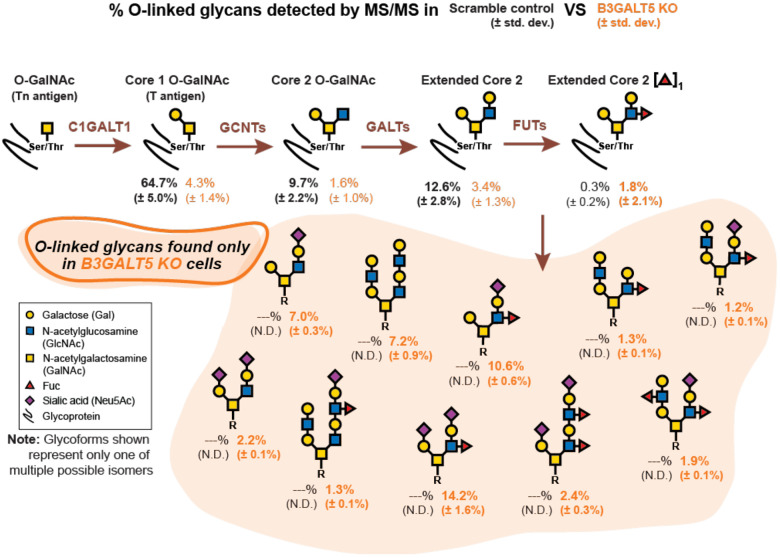
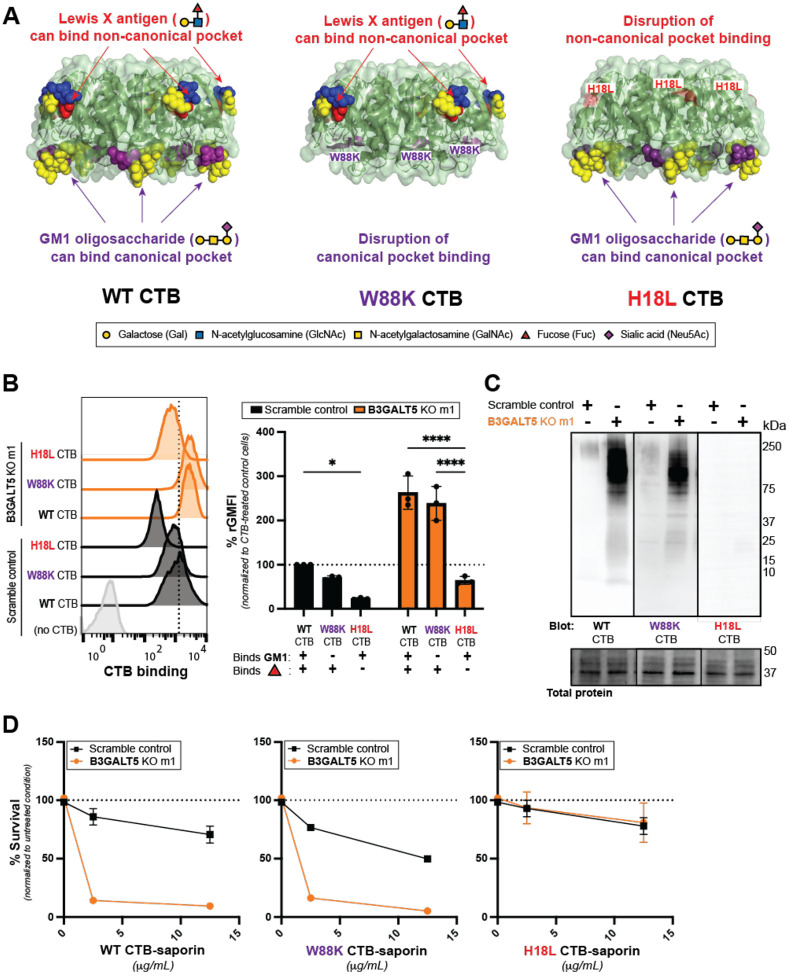
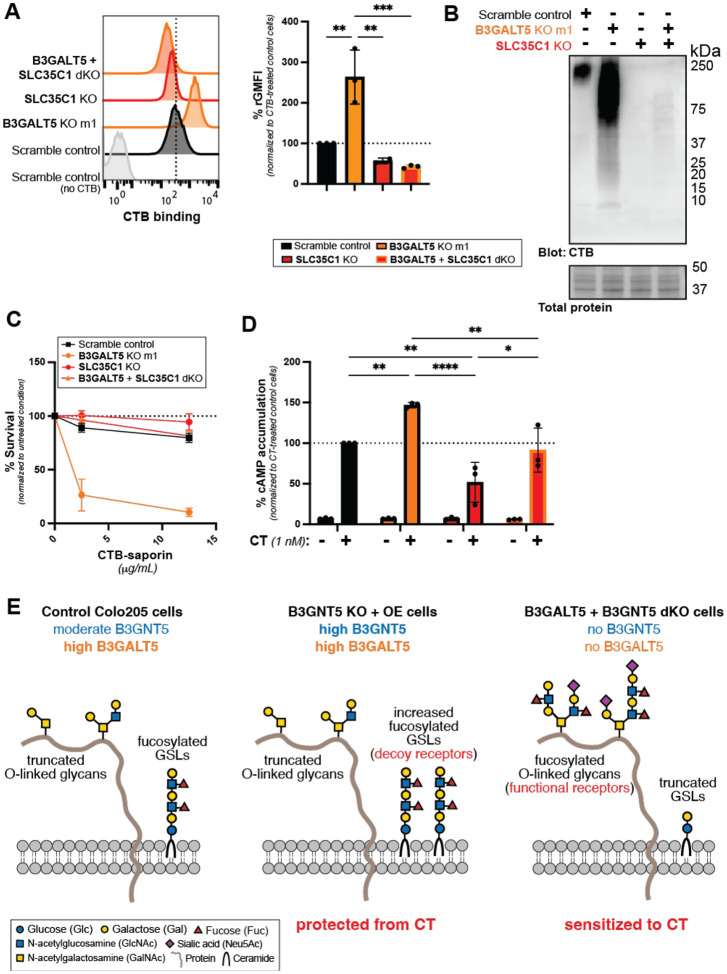
Cholera toxin (CT) is the etiological agent of cholera. Here we report that multiple classes of fucosylated glycoconjugates function in CT binding and intoxication of intestinal epithelial cells. In Colo205 cells, knockout of B3GNT5, the enzyme required for synthesis of lacto- and neolacto-series glycosphingolipids (GSLs), reduces CT binding but sensitizes cells to intoxication. Overexpressing B3GNT5 to generate more fucosylated GSLs confers protection against intoxication, indicating that fucosylated GSLs act as decoy receptors for CT. Knockout (KO) of B3GALT5 causes increased production of fucosylated O-linked and N-linked glycoproteins, and leads to increased CT binding and intoxication. Knockout of B3GNT5 in B3GALT5 KO cells eliminates production of fucosylated GSLs but increases intoxication, identifying fucosylated glycoproteins as functional receptors for CT. These findings provide insight into molecular determinants regulating CT sensitivity of host cells.


Figures

Figure 1.
Figure 1.. CRISPR screen for factors affecting CTB binding to Colo205 cells identifies glycosphingolipid biosynthetic pathway genes.
(A) Schematic of genome-wide CRISPR KO screen for mediators of CTB binding to Colo205 intestinal epithelial cells using FACS to collect low versus high CTB binding populations. (B) Top sgRNA gene targets (p < 10−6) enriched in the low (left panel) and the high (right panel) CTB binding populations relative to the unsorted input population of CRISPR KO library-expressing cells. (C) Schematic of lacto- and neolacto-GSL biosynthetic pathway which includes a top enriched sgRNA gene target of both low and high CTB-binding populations. (D) GlycoEnzoOnto analysis results identify glycosylation pathways significantly enriched (p < 0.05) in the low (top panel) and high (bottom panel) CTB screen populations.
Figure 2.
Figure 2.. Knockout of B3GALT5 and B3GNT5 results in increased sensitivity to CT
(A, C, E) Representative histograms from the flow cytometry analyses of cell surface binding of CTB (1 μg/mL) to control, KO, KO + OE, and dKO cell lines. Bar graph shows quantification of geometric mean fluorescence index (gMFI) from 3 independent trials, normalized to the maximum APC signal in control cells. Error bars indicate mean ± SD. (B, D, F) Control, KO, KO + OE, and dKO cell lines were incubated for 1.5 h with cholera holotoxin (CTX, 1 nM). Accumulation of cAMP was measured using the cAMP-Glo Max assay. Luminescence values were inversely proportional to cAMP levels. Total amount of plated cells was measured using the Cell Titer-Glo 2.0 assay. Data shown are inverse cAMP values normalized first to the total amount of cells plated for each cell line, then to the maximum signal in control cells. Each datapoint is a biological replicate consisting of 3 averaged technical replicates. Error bars indicate mean ± SD of 3 biological replicates. All statistical analyses were performed by one-way ANOVA with Tukey correction (* indicates p value between 0.01 and 0.05, ** 0.001 and 0.01, *** 0.001 and 0.0001, and **** <0.0001).
Figure 3.
Figure 3.. GSLs are decoy receptors for CT
(A) Table of glycan headgroups detected by MS analysis of glycolipids extracted from control, B3GALT5 KO m1 and B3GNT5 KO m1 cells. “N.D.” indicates that the glycan headgroup was not detected in the corresponding cell line. (B) Lectin blot with CTB-biotin of lysates from control, B3GALT5 KO m1, B3GNT5 m1, respective KO+OE, and B3GALT5+B3GNT5 dKO cells. Data shown are a single representative trial of 3 independent biological replicates. (C) Lectin blot with CTB-biotin of control, B3GALT5 KO m1, and B3GNT5 KO+OE cell lysates treated for 16 h with proteinase K, endoglycoceramidase, or a vehicle control. Data shown are a single representative trial of 3 independent biological replicates. (D, E) Control, B3GALT5 KO m1, and B3GNT5 KO+OE cells were treated with P4 inhibitor of glycosphingolipid biosynthesis for 72 h Treated cells were then lysed and subjected to ligand blot analysis with CTB-biotin (D) or incubated for 1.5 hrs. with CT (1 nM) for analysis of cAMP accumulation (E). Data shown are inverse luminescence values normalized to total amount of cells then to the maximum signal in control cells. Each datapoint is a biological replicate consisting of 3 averaged technical replicates. Error bars indicate mean ± SD of 3 biological replicates. Statistical analysis was performed by two-way ANOVA with Tukey correction (* indicates p value between 0.01 and 0.05 and ** indicates p value between 0.001 and 0.01).
Figure 4.
Figure 4.. B3GALT5 KO cells exhibit increased fucosylation on O-linked glycoproteins
Schematic of O-linked glycan biosynthesis. Relative enrichment is included below each structure as detected by LC-MS/MS of glycoproteins from control and B3GALT5 KO m1 cells. “N.D.” indicates glycans that were not detected in corresponding cell line. Glycans that were detected in B3GALT5 KO m1 cells but not in control cells are highlighted by orange background.
Figure 5.
Figure 5.. CTB binding to Colo205 cells depends on the non-canonical glycan binding pocket
(A) Structure of CTB pentamer illustrating the canonical and non-canonical binding pockets. Protein and GM1 coordinates from ref. and Lex coordinates from ref. . CTB structures were aligned using Pymol. The locations of the W88K point mutation in the canonical binding pocket and the H18L point mutation in the non-canonical binding pocket are highlighted. (B) Representative flow cytometry histograms of control and B3GALT5 KO m1 cells incubated with WT CTB, W88K CTB or H18L CTB (1 μg/mL). Data shown are a single representative trial from 3 independent experiments. Bar graphs show the quantification of gMFI from the 3 independent trials of normalized to the maximum signal in control cells. Error bars indicate mean ± SD. Statistical analyses were performed by two-way ANOVA with Tukey correction, * indicating p value between 0.01 and 0.05, ** indicating p value between 0.001 and 0.01, and **** indicating p value ≤0.0001. (C) Lysates from B3GALT5 KO m1 and control cells were analyzed by ligand blot, probing with either WT or mutant CTB-biotin. Data shown are a single representative trial of 3 independent biological replicates. (D) B3GALT5 KO m1 and control cells were incubated for 72 h with increasing concentrations of WT, W88K, or H18L CTB-saporin. Cell survival was measured using the Cell Titer-Glo 2.0 assay. Data shown are luminescence values normalized to the maximum signal for each cell type. Each datapoint is a biological replicate consisting of 3 averaged technical replicates. Error bars indicate mean ± SD of 2 biological replicates.
Figure 6.
Figure 6.. Fucosylated glycoproteins and fucosylated glycolipids play opposing roles in CT intoxication
(A) Representative histograms from the flow cytometry analyses of CTB (1 μg/mL) binding to surfaces of control, B3GALT5 KO m1, SLC35C1 KO, and B3GALT5+SLC35C1 dKO cells. Data shown are a single representative trial from 2-3 independent experiments. Quantification of gMFIs (bottom panel) from the 2-3 independent trials are normalized to the maximum signal in control cells. Error bars indicate mean ± SD. (B) Lysates from control, B3GALT5 KO, SLC35C1 KO, and B3GALT5+SLC35C1 double KO cells were analyzed by lectin blot, probing with CTB-biotin. Data shown are a single representative trial of 3 independent biological replicates. (C) Control, B3GALT5 KO m1, SLC35C1 KO and B3GALT5+SLC35C1 dKO cells were incubated for 72 h with increasing concentrations of CTB-saporin. Cell survival upon internalization of CTB-saporin was measured. Data shown are luminescence values normalized to the signal from the untreated condition for each cell type. Each datapoint is a biological replicate consisting of 3 averaged technical replicates. Error bars indicate mean ± SD of 2 biological replicates. (D) Control, B3GALT5 KO m1, SLC35C1 KO, and B3GALT5+SLC35C1 dKO cells were incubated for 1.5 h with CT (1 nM) after which accumulation of cAMP was measured. Data shown are inverse luminescence values normalized to total amount of cells then to the maximum signal in control cells. Each datapoint is a biological replicate consisting of 3 averaged technical replicates. Error bars indicate mean ± SD of 3 biological replicates. Statistical analyses for panel A performed by one-way ANOVA with Tukey correction and for panel D by two-way ANOVA for Tukey correction and * indicating p value between 0.01 and 0.05, ** indicating p value between 0.001 and 0.01, and *** indicating p value between 0.001 and 0.0001. (E) Model depicting how B3GNT5 and B3GALT5 regulate production of cholera toxin receptors. Control Colo205 cells express B3GNT5 and a high level of B3GALT5. These cells produce fucosylated GSLs and truncated O-linked glycans. Among the cell lines examined, B3GNT5 KO + OE cells were the most protected from CT. These cells express high levels of both B3GALT5 and B3GNT5. Due to high B3GALT5 expression, they do not produce fucosylated O-linked glycans. However, they produce abundant fucosylated GSLs due to high B3GNT5 expression. These fucosylated GSLs serve a protective role against CT intoxication. In contrast, B3GALT5 + B3GNT5 dKO cells were the most sensitized to CT. Due to the absence of B3GNT5 expression, fucosylated GSLs are not produced. However, the lack of B3GALT5 expression results in biosynthesis of fucosylated O-linked glycoproteins that promote CT intoxication. Representative glycan structures presented in this model are postulated based on O-linked glycomics analysis of control and B3GALT5 KO Colo205 cells and glycolipidomics analysis of control, B3GALT5 KO, and B3GNT5 KO Colo205 cells.

Similar articles

References

    1. Grant T.A., Balasubramanian D. & Almagro-Moreno S. JMM Profile: Vibrio cholerae: an opportunist of human crises. J Med Microbiol 70 (2021). - PubMed
    1. White C., Bader C. & Teter K. The manipulation of cell signaling and host cell biology by cholera toxin. Cell Signal 100, 110489 (2022). - PMC - PubMed
    1. Cuatrecasas P. Gangliosides and membrane receptors for cholera toxin. Biochemistry 12, 3558–3566 (1973). - PubMed
    1. Cuatrecasas P., Parikh I. & Hollenberg M.D. Affinity chromatography and structural analysis of Vibrio cholerae enterotoxin-ganglioside agarose and the biological effects of ganglioside-containing soluble polymers. Biochemistry 12, 4253–4264 (1973). - PubMed
    1. Heyningen S.V. Cholera toxin: interaction of subunits with ganglioside GM1. Science 183, 656–657 (1974). - PubMed

Publication types