[Preprint]. 2023 Aug 2:2023.07.31.551378.
doi: 10.1101/2023.07.31.551378.

The relationship between diet, plasma glucose, and cancer prevalence across vertebrates

Affiliations

The relationship between diet, plasma glucose, and cancer prevalence across vertebrates

Stefania E Kapsetaki et al. bioRxiv. .

Update in

Abstract

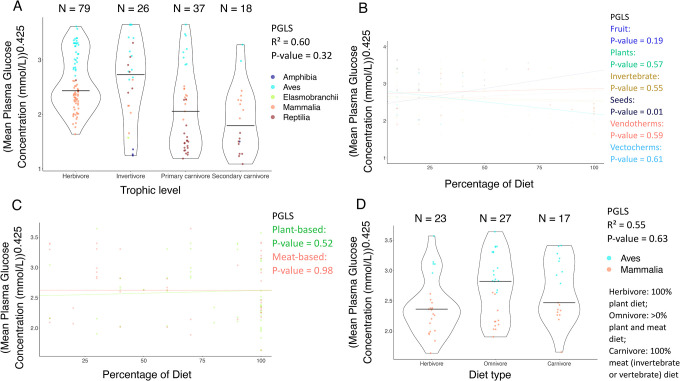
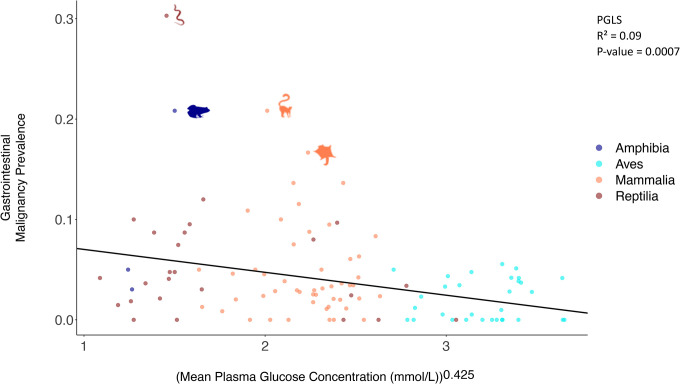
Could diet and mean plasma glucose concentration (MPGluC) explain the variation in cancer prevalence across species? We collected diet, MPGluC, and neoplasia data for 160 vertebrate species from existing databases. We found that MPGluC negatively correlates with cancer and neoplasia prevalence, mostly of gastrointestinal organs. Trophic level positively correlates with cancer and neoplasia prevalence even after controlling for species MPGluC. Most species with high MPGluC (50/78 species = 64.1%) were birds. Most species in high trophic levels (42/53 species = 79.2%) were reptiles and mammals. Our results may be explained by the evolution of insulin resistance in birds which selected for loss or downregulation of genes related to insulin-mediated glucose import in cells. This led to higher MPGluC, intracellular caloric restriction, production of fewer reactive oxygen species and inflammatory cytokines, and longer telomeres contributing to longer longevity and lower neoplasia prevalence in extant birds relative to other vertebrates.


Conflict of interest statement

Competing interests We declare we do not have any conflicts of interest.

Figures

Figure 1.
Figure 1.. The relationship between mean plasma glucose concentration and diet across vertebrates.
(A) Trophic level is not significantly correlated with mean plasma glucose concentrations across 160 species (PGLS: P-value = 0.32; R2 = 0.60). (B) The percentage of seeds in a species’ diet is positively correlated with mean plasma glucose concentrations for 18 species (PGLS: P-value = 0.01; R2 = 0.56), but not after correcting for multiple testing (Table 1A). There was no significant correlation between the percentage of fruit, plants, invertebrates, endothermic vertebrates (Vendotherms), or ectothermic vertebrates (Vectotherms), and mean plasma glucose concentrations for 25, 39, 35, 15, or 11 species, respectively (PGLS: P-value > 0.05). (C) The percentage of plant-based foods or meat-based foods in a species’ diet was not significantly correlated with mean plasma glucose concentrations for 50 or 44 species, respectively (PGLS: P-value > 0.05). (D) Diet type is not significantly correlated with mean plasma glucose levels for 67 species (PGLS: P-value = 0.63; R2 = 0.55). The horizontal black line in each diet category shows the mean plasma glucose concentration in that trophic (plot A) or diet category (plot D). Each dot shows the mean plasma glucose concentration and diet category of one species. N shows the number of species per diet category (plots A & D). We added minimal jitter in the plots in order to better visualize individual data points.
Figure 2.
Figure 2.. The relationship between mean plasma glucose concentration and overall cancer prevalence.
This non-significant correlation (PGLS: P-value = 0.14) was across 160 species. Each dot represents the average plasma glucose concentration and the malignancy prevalence across tissues of one species; Amphibia: Dark Blue; Aves: Blue; Elasmobranchii: Green; Mammalia: Orange; Reptilia: Red. For ease of interpretation of significant outliers (Rosner’s test), we show images of outlier species. Animal silhouettes from PhyloPic (http://www.phylopic.org/).
Figure 3.
Figure 3.. Relationship between mean plasma glucose concentration and gastrointestinal malignancy prevalence.
The relationship (negative) was statistically significant (PGLS: P-value = 0.0007) across 108 species, even after correcting for multiple testing (Table 1B). Each dot represents the average plasma glucose concentration and the gastrointestinal malignancy prevalence of one species; Amphibia: Dark Blue; Aves: Blue; Mammalia: Orange; Reptilia: Red. We show images of significant outlier species (Rosner’s test). Animal silhouettes from PhyloPic (http://www.phylopic.org/).
Figure 4.
Figure 4.. Relationships between overall cancer prevalence and diet across vertebrates.
(A) Trophic level is positively correlated with malignancy prevalence across tissues for 160 species, even when controlling for variations in glucose concentrations in their plasma and correcting for multiple testing (PGLS: P-value = 0.0003; Table 1F; P-values ≤ 0.01 of between-tropic level comparisons are shown). (B)The percentage of plants in a species’ diet is negatively correlated with malignancy prevalence across tissues for 39 species only when not controlling for variations in glucose concentrations in their plasma (PGLS: P-value = 0.01). This result, however, does not remain significant when we correct for multiple testing. Also, there is no significant correlation between the percentage of fruit, invertebrates, seeds, endothermic vertebrates (Vendotherms), or ectothermic vertebrates (Vectotherms) in a species’ diet and malignancy prevalence across tissues for 25, 35, 18, 15, or 11 species, respectively (PGLS: P-value > 0.05). (C) The percentage of plant-based food in a species’ diet is not significantly correlated with malignancy prevalence across tissues for 50 species (PGLS: P-value > 0.05). Also, there is no significant correlation in the percentage of animal-based food in a species’ diet and malignancy prevalence across their tissues for 44 species (PGLS: P-value > 0.05). (D) Diet type is not significantly correlated with malignancy prevalence for 67 species (PGLS: P-value > 0.05). The horizontal black line in each trophic level (plot A) or diet category (plot D) shows the median malignancy prevalence across tissues in that category. Each dot shows the malignancy prevalence across tissues and diet category of a species. N shows the number of species per diet category (plots A & D). We added minimal jitter in the plots in order to better visualize individual data points.
Figure 5.
Figure 5.. Relationship between gastrointestinal cancer prevalence and diet across vertebrates.
(A) Trophic level is not significantly correlated with gastrointestinal malignancy prevalence for 108 species after correcting for multiple testing (Table 1B; P-values ≤ 0.01 of between-tropic level comparison are shown). (B) The percentage of plants in a species’ diet is negatively correlated with gastrointestinal malignancy prevalence for 22 species (PGLS: P-value < 0.05), but not after correcting for multiple testing (Table 1B). The percentage of endothermic vertebrates (Vendotherms) in a species’ diet is negatively correlated with gastrointestinal malignancy prevalence for 13 species (PGLS: P-value < 0.05), but not after correcting for multiple testing. There is no significant correlation between the percentage of fruit or invertebrates in a species’ diet and gastrointestinal malignancy prevalence for 19 or 23 species, respectively (PGLS: P-value > 0.05). (C) The percentage of plant-based food in a species’ diet is negatively correlated with gastrointestinal malignancy prevalence for 29 species (PGLS: P-value = 0.001), even when controlling for the variance in the glucose concentrations in their plasma (PGLS: P-value = 0.001), and after correcting for multiple testing (Table 1B). There is no significant correlation in the percentage of animal-based food in a species’ diet and gastrointestinal malignancy prevalence for 32 species (PGLS: P-value > 0.05). (D) Diet type is significantly correlated with gastrointestinal malignancy prevalence for 44 species (PGLS: P-value < 0.05), but not after corrections for multiple testing (Table 1B). Omnivores have higher gastrointestinal malignancy prevalence than herbivores (PGLS: P-value = 0.007), and carnivores have lower gastrointestinal malignancy prevalence than omnivores (PGLS: P-value = 0.01). These correlations, however, do not remain significant after applying corrections for multiple testing (Table 1B). The horizontal black line in each trophic level (plot A) and diet category (plot D) shows the median gastrointestinal malignancy prevalence in that category. Each dot shows the gastrointestinal malignancy prevalence and diet category of a species. N shows the number of species per category (plots A & D). We added minimal jitter in the plots in order to better visualize individual data points.

References

    1. Frank S. A. Dynamics of Cancer: Incidence, Inheritance, and Evolution. (Princeton University Press, 2018). - PubMed
    1. Peto R. Epidemiology, multistage models, and short-term mutagenicity tests. Int. J. Epidemiol. 45, 621–637 (2016). - PubMed
    1. Caulin A. F. & Maley C. C. Peto’s Paradox: evolution’s prescription for cancer prevention. Trends Ecol. Evol. 26, 175–182 (2011). - PMC - PubMed
    1. Møller A. P., Erritzøe J. & Soler J. J. Life history, immunity, Peto’s paradox and tumours in birds. J. Evol. Biol. 30, 960–967 (2017). - PubMed
    1. Abegglen L. M. et al. Potential Mechanisms for Cancer Resistance in Elephants and Comparative Cellular Response to DNA Damage in Humans. JAMA 314, 1850–1860 (2015). - PMC - PubMed

Publication types