[Preprint]. 2023 Aug 2:2023.07.31.551324.
doi: 10.1101/2023.07.31.551324.

CCT and Cullin1 regulate the TORC1 pathway to promote dendritic arborization in health and disease

Affiliations

CCT and Cullin1 regulate the TORC1 pathway to promote dendritic arborization in health and disease

Erin N Lottes et al. bioRxiv. .

Update in

Abstract

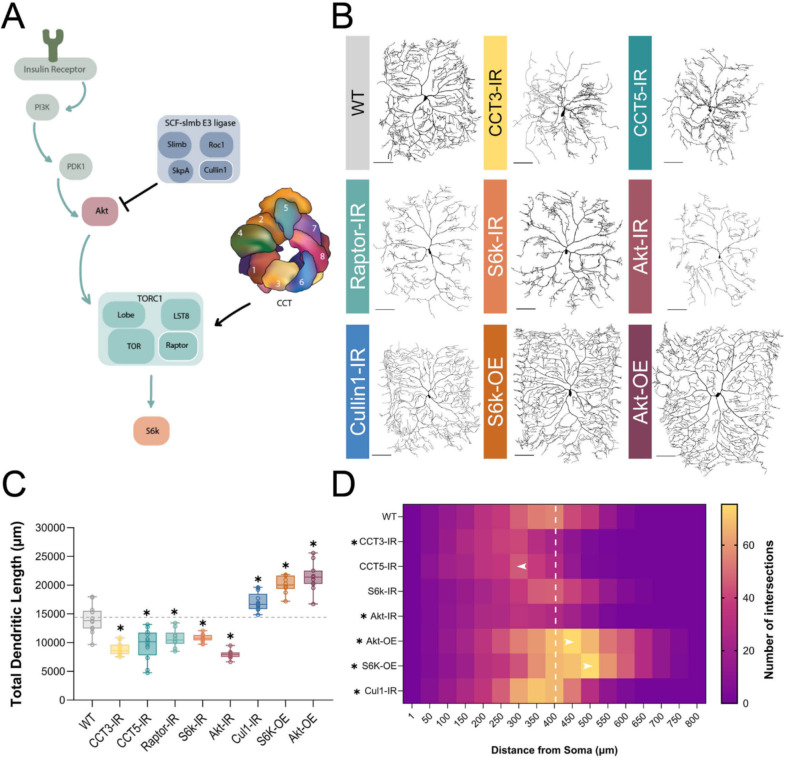
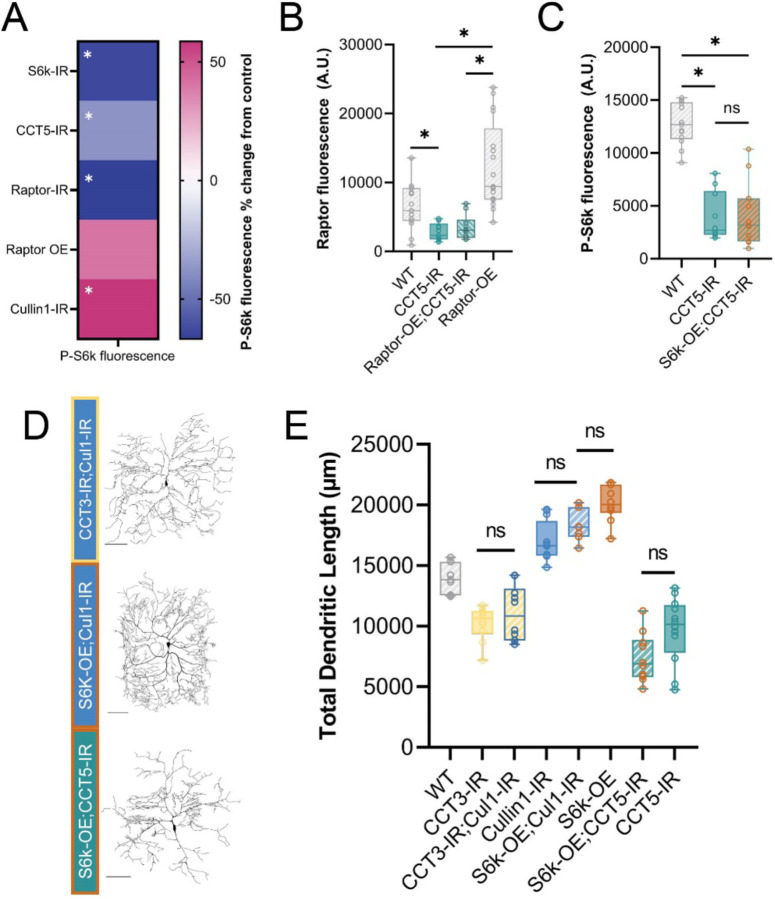
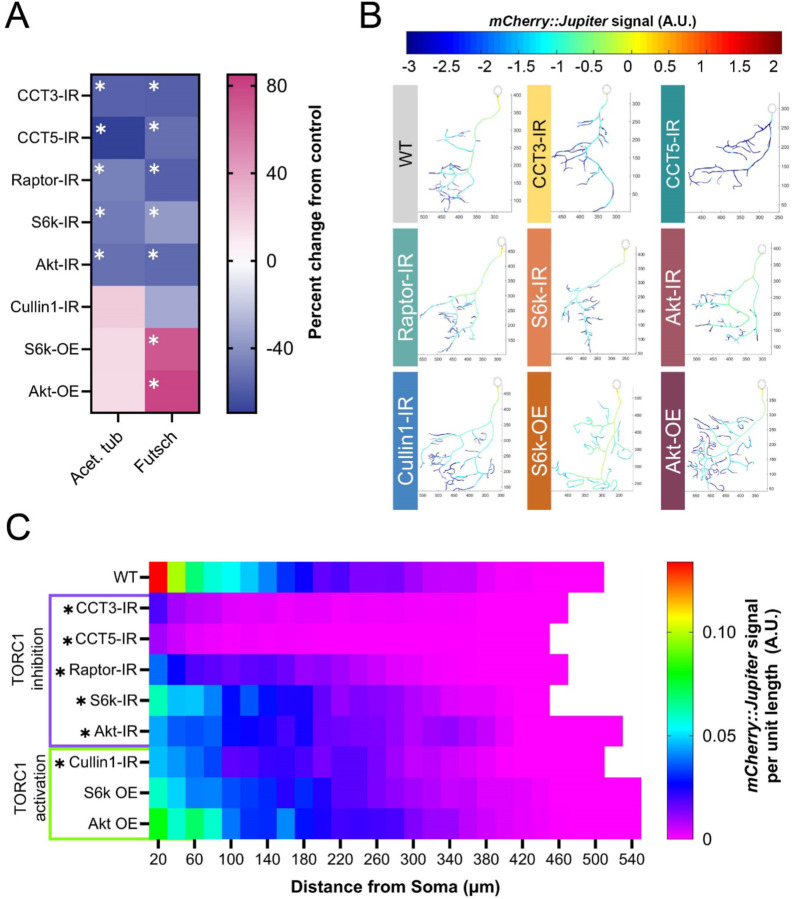
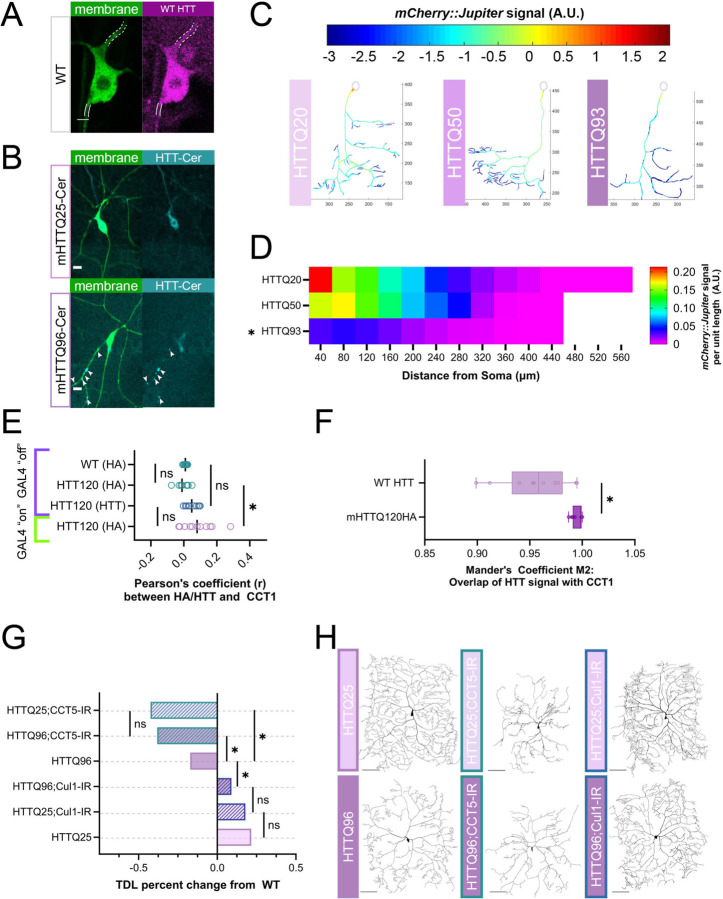
The development of cell-type-specific dendritic arbors is integral to the proper functioning of neurons within their circuit networks. In this study, we examine the regulatory relationship between the cytosolic chaperonin CCT, key insulin pathway genes, and an E3 ubiquitin ligase (Cullin1) in homeostatic dendritic development. CCT loss of function (LOF) results in dendritic hypotrophy in Drosophila Class IV (CIV) multidendritic larval sensory neurons, and CCT has recently been shown to fold components of the TOR (Target of Rapamycin) complex 1 (TORC1), in vitro. Through targeted genetic manipulations, we have confirmed that LOF of CCT and the TORC1 pathway reduces dendritic complexity, while overexpression of key TORC1 pathway genes increases dendritic complexity in CIV neurons. Both CCT and TORC1 LOF significantly reduce microtubule (MT) stability. CCT has been previously implicated in regulating proteinopathic aggregation, thus we examined CIV dendritic development in disease conditions as well. Expression of mutant Huntingtin leads to dendritic hypotrophy in a repeat-length-dependent manner, which can be rescued by TORC1 disinhibition via Cullin1 LOF. Together, our data suggest that Cullin1 and CCT influence dendritic arborization through regulation of TORC1 in both health and disease.


Conflict of interest statement

CONFLICT OF INTEREST The authors declare no competing financial interests.

Figures

Figure 1:
Figure 1:. CCT and the TORC1 pathway promote dendritic arborization.
(A) Schematic diagram of regulatory relationships between the insulin pathway, SCF complex, CCT, and TORC1 pathway with the insulin pathway indicated by teal arrows. TORC1 is negatively regulated by Cullin1 and positively regulated by CCT. The upstream insulin pathway in green is displayed for context but was not examined in this study. Individual components of the SCF and TORC1 complexes examined in this study are outlined in white. (B) Representative images of CIV neurons for key CCT and TORC1 pathway manipulations, with RNAi-mediated knockdown indicated with -IR and UAS-mediated overexpression with -OE. Scale bars = 100 μm (C) Total dendritic length of CCT and TORC1 pathway manipulations shown in comparison to a WT control, * indicates a significant change from control (p < 0.05). (D) Number of Sholl intersections mapped by color at increasing radial distances from soma (μm). Significant changes in Sholl maximum intersections and radius are indicated by an asterisk. Arrows indicate genotypes where the radius of maximum intersections has shifted significantly from WT. The white dashed line is to reference the radius of maximum intersections for WT neurons. In all panels * = p < 0.05, see Supplementary Table S2 for detailed statistics.
Figure 2:
Figure 2:. CCT and Cullin1 regulate the TORC1 pathway in vivo.
(A) Heat map showing the percent change in P-S6k fluorescence for each genetic manipulation as compared to its proper control. (B) Raptor fluorescence is significantly decreased in CCT5 LOF conditions and is not rescued by overexpression of Raptor. (C) P-S6k fluorescence levels are significantly decreased in CCT5 LOF and are not rescued by overexpression of S6k. (D) Representative images of combined TORC1 genetic manipulations. Scale bars = 100 μm. (E) Total dendritic length in microns for WT and combined TORC1 genetic manipulations. In all panels * = p < 0.05, see Supplementary Table S2 for detailed statistics.
Figure 3:
Figure 3:. TORC1 pathway manipulations alter underlying stable MT signal.
(A) Heat map showing percent change from control in acetylated α-tubulin and Futsch levels for each genetic manipulation. Each experimental condition was compared to WT control and appropriate statistical comparisons were performed (detailed in Supplementary Table S2). (B) Representative reconstructions of branches from WT and TORC1 genetic manipulations – normalized mCherry::Jupiter fluorescence is coded with the rainbow spectrum shown (A.U.). Scaled axes are provided in μm. (C) Heat map representing the average normalized, binned mCherry::Jupiter fluorescence along dendrites at increasing distances from the soma for each genotype. TORC1 inhibitions are marked in purple and TORC1 activations in green. Genotypes found to be significantly different along the dendritic arbor are marked with an asterisk. In all panels * = p < 0.05, see Supplementary Table S2 for detailed statistics.
Figure 4:
Figure 4:. Expression of mHTT leads to dendritic hypotrophy parallel to TORC1 pathway.
(A) Representative image of WT HTT staining in CIV neuron – dendrite marked by dashed white lines, axon by solid lines. Scale bar = 3 μm. (B) Representative images of mHTT25-Cerulean and mHTT96-Cerulean shown with aggregate inclusion bodies marked by white arrows for mHTT96-Cerulean. Scale bar = 10 μm. (C) Representative reconstructions of branches from WT and TORC1 genetic manipulations – normalized mCherry::Jupiter fluorescence is coded with the rainbow spectrum shown (A.U.) (D) Heat map representing the average normalized, binned mCherry::Jupiter fluorescence along dendrites at increasing distances from the soma for overexpressions of mHTT 20, 50, and 93 repeats. Genotypes found to be significantly different along the dendritic arbor are marked with an asterisk. (E) Pearson’s correlation Coefficient (r) is near-zero for CCT1 and HTT co-expression in soma cytosol, however, r for CCT1-mHTT120HA is significantly higher than CCT1-WT HTT and HA-stained Gal4 “off” controls. (F) Thresholded Mander’s Coefficient M2 signifying overlap of two signals is significantly higher in CCT1-mHTT120HA conditions than CCT1-WT HTT conditions. (G) TDL of Cullin1-IR and CCT5-IR in both mHTTQ25 and mHTTQ96 backgrounds displayed as percent change from WT control. CCT5-IR decreases both mHTTQ96 and mHTTQ25 neurons to far lower than WT, while Cullin1-IR rescues mHTT96 hypotrophy to WT levels. (H) Representative images of CIV dendritic morphology in combined HTT and CCT5-IR or Cullin1-IR combinations. Scale bars = 100 μm. In all panels * = p < 0.05, see Supplementary Table S2 for detailed statistics.

References

    1. Arshadi C, Günther U, Eddison M, Harrington KIS, Ferreira TA (2021) SNT: a unifying toolbox for quantification of neuronal anatomy. Nat Methods 18:374–377. - PubMed
    1. Barnat M, Le Friec J, Benstaali C, Humbert S (2017) Huntingtin-Mediated Multipolar-Bipolar Transition of Newborn Cortical Neurons Is Critical for Their Postnatal Neuronal Morphology. Neuron 93:99–114. - PubMed
    1. Berger Z, Ravikumar B, Menzies FM, Garcia Oroz L, Underwood BR, Pangalos MN, Schmitt I, Wullner U, Evert BO, O’kane CJ, Rubinsztein DC (2006) Rapamycin alleviates toxicity of different aggregate-prone proteins. Human Molecular Genetics 15:433–442. - PubMed
    1. Bertrand M, Decoville M, Meudal H, Birman S, Landon C (2020) Metabolomic nuclear magnetic resonance studies at presymptomatic and symptomatic stages of huntington’s disease on a drosophila model. Journal of Proteome Research 19:4034–4045. - PubMed
    1. Bhattacharjee S, Lottes EN, Nanda S, Golshir A, Patel AA, Ascoli GA, Cox DN (2022) PP2A phosphatase regulates cell-type specific cytoskeletal organization to drive dendrite diversity. Front Mol Neurosci 15:926567. - PMC - PubMed

Publication types