[Preprint]. 2023 Jul 31:rs.3.rs-3150386.
doi: 10.21203/rs.3.rs-3150386/v1.

MethNet: a robust approach to identify regulatory hubs and their distal targets in cancer

Affiliations

MethNet: a robust approach to identify regulatory hubs and their distal targets in cancer

Theodore Sakellaropoulos et al. Res Sq. .

Update in

Abstract

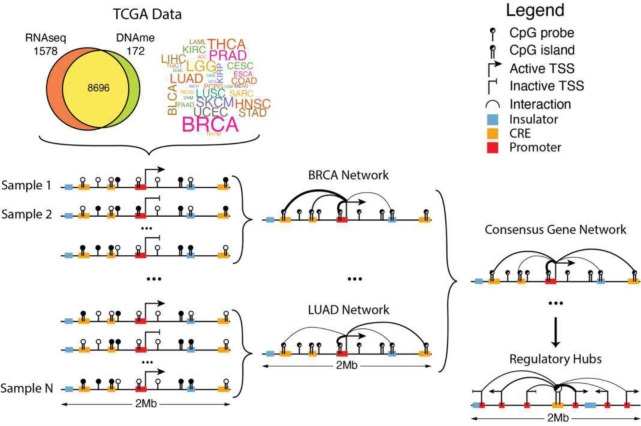
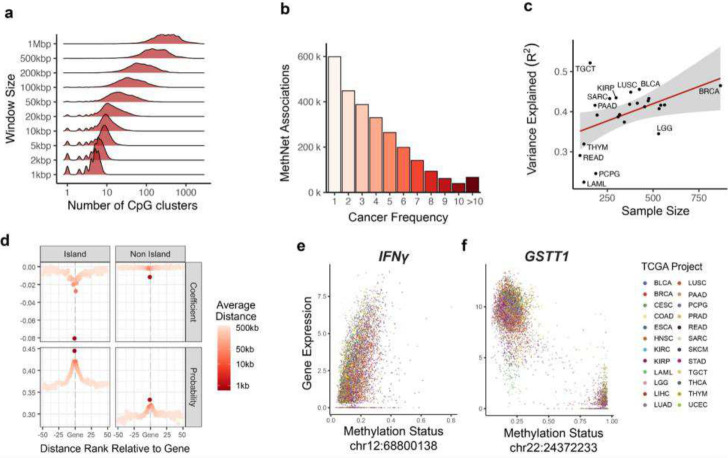
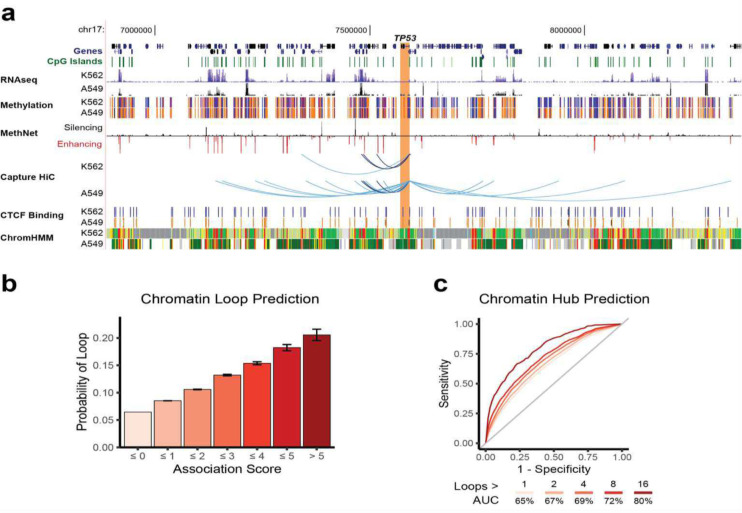
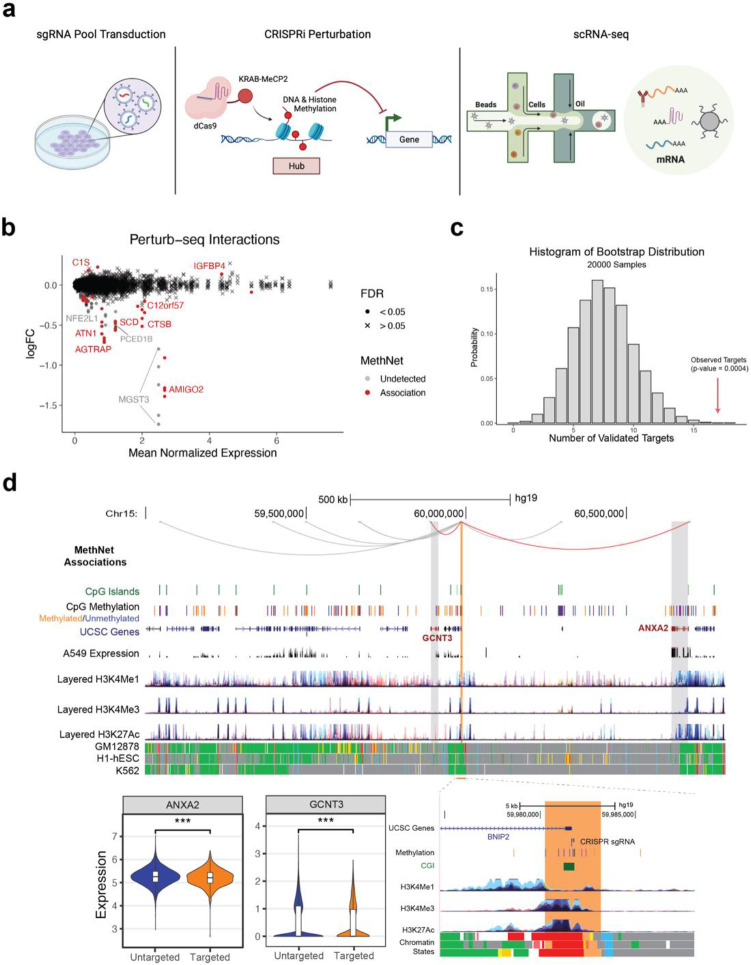
Aberrations in the capacity of DNA/chromatin modifiers and transcription factors to bind non-coding regions can lead to changes in gene regulation and impact disease phenotypes. However, identifying distal regulatory elements and connecting them with their target genes remains challenging. Here, we present MethNet, a pipeline that integrates large-scale DNA methylation and gene expression data across multiple cancers, to uncover novel cis regulatory elements (CREs) in a 1Mb region around every promoter in the genome. MethNet identifies clusters of highly ranked CREs, referred to as 'hubs', which contribute to the regulation of multiple genes and significantly affect patient survival. Promoter-capture Hi-C confirmed that highly ranked associations involve physical interactions between CREs and their gene targets, and CRISPRi based scRNA Perturb-seq validated the functional impact of CREs. Thus, MethNet-identified CREs represent a valuable resource for unraveling complex mechanisms underlying gene expression, and for prioritizing the verification of predicted non-coding disease hotspots.


Conflict of interest statement

Additional Declarations: There is NO Competing Interest.

Figures

Figure 1:
Figure 1:. Outline of the MethNet pipeline.
Paired RNA-seq and DNA-methylation data were accessed from TCGA. The expression of every protein coding gene across every cancer dataset was modelled as a function of the methylation status in a 1Mb radius surrounding the gene to generate a set of regulatory networks across all cancers. These were aggregated to produce a network of robust associations that were used to identify novel regulatory elements and hubs.
Figure 2:
Figure 2:
a) Distribution of HumanMethylation450 probes neighboring a protein coding gene as a function of the window size. At 1 Mbp the average gene has 400 potential regulators. b) Histogram of the robustness of MethNet associations as measured by the number of TCGA cancers it appears in. c) Mean performance of MethNet models, as measured by the ratio of variance as a function of dataset size. d) MethNet association effect as a function of distance. Associations are grouped based on their ranked distance to a gene, where −1 includes associations from the first CpG island or non-island upstream of the promoter, and positive distance refers to associations downstream of the TES. For every group of potential associations, we calculated the average distance, mean coefficient and probability of a MethNet association. e-f) Examples of regulatory effects recovered by MethNet. Left: A repressive association between IFNγ and a CTCF binding site 250 kb upstream of the promoter. Right: An activating association between GSTT1 and a non-coding RNA 10kb downstream of the promoter.
Figure 3:
Figure 3:
a) Schematic depiction of regulatory potential. We quantified the importance of an association as the excess of its relative effect size with respect to a null model where all elements contribute proportionally to their distance from the promoter. b-d) Enrichment of regulatory potential in ChromHMM state (b), chromatin remodelers, the transcription machinery, and transcription factor binding sites (c), and H3K27ac chromatin loops from CD4-Naive, GM12878 and K562 cells (d.)
Figure 4:
Figure 4:
a) Distribution of regulatory potential as a function of methylation variance across cancers. b) Comparison of the distribution of MethNet association per elements for hubs versus non-hubs c) Mean effect of hub methylation (excluding cancer-specific effects) on overall survival across TCGA cancers. d-f) Enrichment of regulatory potential in ChromHMM state (d), chromatin remodelers, the transcription machinery, and transcription factor binding sites (e), and H3K27ac chromatin loops from CD4-Naive, GM12878 and K562 cells (f).
Figure 5:
Figure 5:
MethNet hubs regulate Protocadherin family genes (chr5:140,000,000–141,000,000). MethNet associations are shown in the top track. Red associations are activating and black repressing. All other tracks are from UCSC Genome Browser. Chromatin marks and CTCF binding sites data are provided by ENCODE. In-situ Hi-C data were generated by Rao et al., and processed with Juicebox to compute contact enrichment (observed/expected). The HS5–1 enhancer, (highlighted in blue), is a known regulator of the PCDHA cluster. The enhancer on the left (highlighted in orange) is a novel MethNet discovery that Methnet identifies as a regulator of the PCDHA, PCDH and PCDHA clusters. The region of the novel enhancer has increased contact frequency with all three Protocadherin families (highlighted by red in the Hi-C heatmap).
Figure 6:
Figure 6:
Capture HiC Validation. a) Example of Methnet associations regulating TP53 that overlap chromatin loops identified using promoter-capture Hi-C from the A549 and K562 cell lines. The Genome Browser session shows the chromatin context around the promoter of TP53 (chr17:6,886,465–8,364,371) for both cell lines. This includes RNA-seq (ENCODE/Caltech for K562, ENCODE/HAIB for A549 ETOH), methylation status (ENCODE/HAIB - orange and blue correspond to methylated and unmethylated regions, respectively), CTCF binding sites, and ChromHMM chromatin states for K562. A549 ChromHMM states were downloaded from Roadmap Epigenomics (15-state core model). All tracks were loaded with default settings, except RNA-seq which was capped at the top for a better overview. Red and black bars correspond to predicted activating and repressive Methnet associations, respectively. Promoter-capture Hi-C loops (shown as arcs) that overlap with Methnet CRE predictions are shown in virtual 4C format. Darker arcs correspond to loops called in both cell lines. b) Bar graph depicting the probability of a Methnet association overlapping with a chromatin loop in either cell line as a function of its score. c) ROC curves showing the ability of MethNet potential to predict chromatin hubs. We only considered gene promoters because of experimental bias. The AUC increases for stricter criteria of calling hubs
Figure 7:
Figure 7:
a) Outline of the perturb-seq validation experiment. b) MA plot showing the differential expression induced by CRISPRi targeting of regulatory regions. Points correspond to genes targeted by sgRNAs. Point shapes indicate whether the interaction was predicted by MethNet. c) Bootstrap distribution of the number of targeted regions that show significant changes in gene expression. The number of observed validated targets is marked by a red arrow. d) Genome Browser session showing an example of a CRE hub validated by expression changes in two predicted gene targets. The effect of all sgRNA guides targeting the CRE on expression of target genes is shown in the violin plots. A zoomed in version of the browser around the hub regulatory element is shown.

References

    1. Shen H. & Laird P. W. Interplay between the Cancer Genome and Epigenome. Cell 153, 38–55 (2013). - PMC - PubMed
    1. Iranzo J., Martincorena I. & Koonin E. V. Cancer-mutation network and the number and specificity of driver mutations. Proc. Natl. Acad. Sci. U. S. A. 115, E6010–E6019 (2018). - PMC - PubMed
    1. Snetkova V. & Skok J. A. Enhancer talk. Epigenomics 10, 483–498 (2018). - PMC - PubMed
    1. Proudhon C. et al. Active and Inactive Enhancers Cooperate to Exert Localized and Long-Range Control of Gene Regulation. Cell Rep. 15, 2159–2169 (2016). - PMC - PubMed
    1. Hewitt S. L. et al. Association between the Igk and Igh immunoglobulin loci mediated by the 3′ Igk enhancer induces ‘decontraction’ of the Igh locus in pre–B cells. Nat. Immunol. 9, 396–404 (2008). - PMC - PubMed

Publication types