

Involvement of casein kinase 1 epsilon/delta (Csnk1e/d) in the pathogenesis of familial Parkinson's disease caused by CHCHD2
- PMID: 37578019
- PMCID: PMC10493588
- DOI: 10.15252/emmm.202317451
Involvement of casein kinase 1 epsilon/delta (Csnk1e/d) in the pathogenesis of familial Parkinson's disease caused by CHCHD2
Abstract
Parkinson's disease (PD) is a common neurodegenerative disorder that results from the loss of dopaminergic neurons. Mutations in coiled-coil-helix-coiled-coil-helix domain containing 2 (CHCHD2) gene cause a familial form of PD with α-Synuclein aggregation, and we here identified the pathogenesis of the T61I mutation, the most common disease-causing mutation of CHCHD2. In Neuro2a cells, CHCHD2 is in mitochondria, whereas the T61I mutant (CHCHD2T61I ) is mislocalized in the cytosol. CHCHD2T61l then recruits casein kinase 1 epsilon/delta (Csnk1e/d), which phosphorylates neurofilament and α-Synuclein, forming cytosolic aggresomes. In vivo, both Chchd2T61I knock-in and transgenic mice display neurodegenerative phenotypes and aggresomes containing Chchd2T61I , Csnk1e/d, phospho-α-Synuclein, and phospho-neurofilament in their dopaminergic neurons. Similar aggresomes were observed in a postmortem PD patient brain and dopaminergic neurons generated from patient-derived iPS cells. Importantly, a Csnk1e/d inhibitor substantially suppressed the phosphorylation of neurofilament and α-Synuclein. The Csnk1e/d inhibitor also suppressed the cellular damage in CHCHD2T61I -expressing Neuro2a cells and dopaminergic neurons generated from patient-derived iPS cells and improved the neurodegenerative phenotypes of Chchd2T61I mutant mice. These results indicate that Csnk1e/d is involved in the pathogenesis of PD caused by the CHCHD2T61I mutation.
Keywords: CHCHD2; Csnk1e/d; α-Synuclein.
© 2023 The Authors. Published under the terms of the CC BY 4.0 license.
Conflict of interest statement
The authors declare that they have no conflict of interest.
Figures

- A–C
Extra‐mitochondrial puncta formation of CHCHD2T61I in MEFs. Chchd2 KO cells were transfected with the CHCHD2 WT ‐HA and CHCHD2 T61I ‐HA plasmids. At the indicated times, cells were fixed and stained with anti‐HA and anti‐Tom20 antibodies, and observed by confocal microscopy. In (A), representative images are shown. Magnified images of the areas within the dashed squares are shown in the insets. Representative images at lower magnification are shown in Appendix Fig S1D. (B, C) Quantification of cells displaying mitochondrial CHCHD2 and extra‐mitochondrial CHCHD2 puncta (n ≥ 100 cells in each experiment).
- D, E
Extra‐mitochondrial puncta formation of CHCHD2T61I in Neuro2a cells. Neuro2a cells were transfected with the CHCHD2 WT ‐HA and CHCHD2 T61I ‐HA plasmids for 4 h, then cultured with medium containing 2% FBS and 10 μM retinoic acid for neuronal differentiation. At 28 h after transfection, cells were fixed and stained with anti‐HA and anti‐Tom20 antibodies. In (D), representative images are shown. Magnified images of the areas within the dashed squares are shown in the insets. Representative images at lower magnification are shown in Appendix Fig S1E. (E) Quantification of cells displaying mitochondrial CHCHD2 and extra‐mitochondrial CHCHD2 puncta (n ≥ 100 cells in each experiment).
- F
Neuro2a cells were treated as described in (D), and cell lysates were fractionated into cytosol, organelles (including mitochondria), nuclei, and cytoskeleton (including insoluble matter). The expression of each protein was analyzed by Western blotting using an anti‐HA antibody. Cox4 was used as a control.
- G
A semiquantitative analysis of protein expression in (F) is shown. In (B, C, E, G), data are shown as the mean ± SD (n = 3). Comparisons were performed using unpaired two‐tailed Student t‐tests and one‐way ANOVA followed by the Tukey post hoc tests. **P < 0.01.

- A, B
Effects of mitochondrial protein import inhibitors on Western blot band sizes of CHCHD2 mutant proteins. Chchd2 KO cells were transfected with the CHCHD2 WT ‐HA, CHCHD2 T61I ‐HA, and CHCHD2 P2L ‐HA plasmids, and treated with compounds that inhibit mitochondrial protein import (MitoBlock‐10 [20 μM] and antimycin A [10 μM]) for 16 h. At 48 h after transfection, cell lysates were subjected to Western blotting. Addition of these compounds altered the band size of CHCHD2WT from 18 kD (black arrows) to 20 kD (red arrowheads). The band size of CHCHD2T61I and CHCHD2P2L is 18 kD (black arrows) and 20 kD (red arrowheads) plus 23 kD (green arrowhead), respectively.
- C–E
The indicated pathogenic mutant CHCHD2 proteins were expressed in Chchd2 KO MEFs by gene transfection. After 48 h, cells were permeabilized and stained with anti‐HA and anti‐Tom20 antibodies (C, D), or cells were collected and lysates were subjected to Western blotting using an anti‐HA antibody (E). In (C), representative images are shown. In (D), the number of cells displaying mitochondrial CHCHD2 and extra‐mitochondrial CHCHD2 puncta were quantified (n ≥ 100 cells in each experiment). Data are shown as the mean ± SD (n = 3).

- A–I
Neuro2a cells were transfected with the CHCHD2 WT ‐HA and CHCHD2 T61I ‐HA plasmids for 4 h and then cultured in medium containing 2% FBS and 10 μM retinoic acid to induce neuronal differentiation. At 28 h after transfection, cells were fixed and stained with an anti‐HA antibody and ProteoStat protein aggregation dye (A, B), anti‐HA and anti‐Nefl antibodies (C, D), anti‐HA and anti‐p‐Nefl473 antibodies (E, F), and anti‐HA and anti‐p‐α‐Synuclein129 (p‐α‐Syn129) antibodies (G, H). In (A, C, E, G), representative images are shown. Magnified images of the areas within the dashed squares are shown in the inset. Arrowheads indicate colocalized puncta between CHCHD2T61I‐HA and aggresomes or the indicated proteins. Representative images at lower magnification are shown in Appendix Figs S2A and S3A–C. (B, D, F, H) The amount of aggresomes (B), Nefl (D), p‐Nefl473 (F), and p‐α‐Syn129 (H) was measured as the fluorescence intensity per cell (n = 30 cells in each experiment). Red bars indicate mean values. In (I), cell lysates were harvested at 28 h, and the expression of each protein was analyzed by Western blotting.
- J
A semiquantitative analysis of protein expression in (I) is shown. Data are shown as the mean ± SD (n = 3). In (B, D, F, H, J), comparisons were performed using unpaired two‐tailed Student t‐tests. *P < 0.05. **P < 0.01.

- A
Comparison of binding proteins of CHCHD2WT with those of CHCHD2T61I by shotgun mass spectrometry analysis. Immunoprecipitants using the anti‐HA antibody were obtained from Neuro2a cells expressing CHCHD2WT‐HA or CHCHD2T61I‐HA and were analyzed by mass spectrometry. The identified proteins (689 proteins) were classified into three groups according to their binding efficiency with CHCHD2WT and CHCHD2T61I. The number indicates the number of identified proteins, and representative proteins are shown. Mitochondrial proteins are colored blue, and Csnk1e is colored red.
- B
Accumulation of Csnk1e/d on CHCHD2T61I puncta. Similar experiments to Fig 2 were performed with or without Csnk1e/d silencing. Cells were fixed and stained with an anti‐HA and anti‐Csnk1e/d antibodies. Representative images are shown. Magnified images of the areas within the dashed squares are shown in the inset. Arrowheads indicate colocalization between CHCHD2T61I‐HA and Csnk1e/d. Representative images at lower magnification are shown in Appendix Fig S5B.
- C
Efficiency of Csnk1e/d silencing. Neuro2a cells were transfected with the CHCHD2 T61I ‐HA plasmid together with Csnk1e and Csnk1d siRNAs, and were differentiated after 4 h. At 28 h after transfection, cell lysates were harvested, and the expression of each protein was analyzed by Western blotting using an anti‐Csnk1e/d antibody. “d” and “e” indicate Csnk1d and Csnk1e, respectively. Tubulin was used as a control.
- D
A semiquantitative analysis of protein expression in (C) is shown. Data are shown as the mean ± SD (n = 3).
- E, F
Interaction between CHCHD2T61I and Csnk1e/d. Neuro2a cells were transfected with the CHCHD2 WT ‐HA and CHCHD2 T61I ‐HA plasmids together with pmax‐GFP (to detect transfected cells), and were differentiated into neuronal cells at 4 h after transfection. At 28 h after transfection, cells were fixed and the PLA was performed using anti‐HA and anti‐Csnk1e/d antibodies and Duolink PLA reagents. In (E), PLA signals were clearly observed in cells expressing CHCHD2T61I‐HA, but were faint and localized in the cytosol in cells expressing CHCHD2WT‐HA. Representative images at lower magnification are shown in Appendix Fig S5C. In (F), the number of PLA signals was counted (n = 50 cells in each experiment). Red bars indicate mean values. In (D, F), comparisons were performed using the unpaired two‐tailed Student t‐test and one‐way ANOVA followed by the Tukey post hoc test. *P < 0.05. **P < 0.01. NS: not significant.

- A
Alignment of amino acid sequences containing the phosphorylation sites of Mus musculus (mouse) Snca (α‐Synuclein, α‐Syn) and Nefl, and Homo sapiens (human) SNCA (α‐Synuclein, α‐SYN) and NEFL. The phosphorylation sites (Ser) are indicated in red. The amino acids three residues before the phosphorylation sites are glutamic acids (boxed in red), forming consensus phosphorylation sequences for casein kinase.
- B
In vitro kinase assay using recombinant human α‐Synuclein and Csnk1e. GST‐tagged α‐SYN and inactive CSNK1EWT or an active mutant (CSNK1ER178C) were incubated in kinase assay buffer for 30 min at 30°C. Phosphorylation levels were analyzed by Western blotting.
- C
A semiquantitative analysis of protein expression in (B) is shown. Data are shown as the mean ± SD (n = 3).
- D–I
Neuro2a cells were transfected with the CHCHD2 T61I ‐HA plasmid together with the indicated siRNAs and were differentiated into neuronal cells after 4 h. At 28 h after transfection, cells were fixed and stained with anti‐HA, anti‐p‐Nefl473, and anti‐p‐α‐Syn129 antibodies, or ProteoStat aggresome detection dye. Similar experiments were performed by the addition of PF‐670462 (10 μM) after 4 h of transfection instead of gene silencing. In (D, F, H), representative images are shown. Magnified images of the areas within the dashed squares are shown in the insets. Arrowheads indicate colocalized puncta between CHCHD2T61I‐HA and the indicated phosphorylated proteins or aggresomes. In (E, G, I), the amount of p‐Nefl473 (E), p‐α‐Syn129 (G), and aggresomes (I) was measured as the fluorescence intensity per cell (n = 30 cells in each experiment). Red bars indicate mean values. In (C, E, G, I), comparisons were performed using one‐way ANOVA followed by the Tukey post hoc tests or unpaired two‐tailed Student t‐test. *P < 0.05; **P < 0.01. NS: not significant.

- A–C
Abnormal motor performance in Chchd2T61I hetero (WT/T61I) and homo (T61I/T61I) knock‐in mice. In (A), the limb‐clasping reflex was observed at 30 weeks of age. Quantitative analyses are shown in Appendix Fig S8A. In (B), the footprint assay indicated a motor deficit at 40 weeks of age. Quantitative analyses are shown in Appendix Fig S8B. In (C), the time that the indicated mice remained on the rotarod was measured. Data are shown as the mean ± SD (n = 4–8 mice).
- D–F
Reduction in TH signals in the SNpc of knock‐in mice. In (D), brain cryosections were immunostained with the dopaminergic cell marker TH. Representative images of the SNpc and ventral tegmental area (VTA) are shown. Dashed lines indicate the SNpc and VTA regions. Bars = 200 μm. In (E), TH signals in the SNpc (average fluorescence intensity per region) are shown as the mean ± SD (n = 3). In (F), cryosections of the SNpc were immunostained with anti‐Chchd2 and anti‐TH antibodies. Arrowheads indicate Chchd2T61I puncta in TH‐positive cells. Dashed lines indicate cell shapes.
- G–K
Extra‐mitochondrial aggresome formation by p‐Nefl473, p‐α‐Syn129, and Csnk1e/d in the SNpc of knock‐in mice. Cryosections of the SNpc were immunostained with anti‐Chchd2 and anti‐Ant1/2 (G), anti‐p‐Nefl473 (H), anti‐p‐α‐Syn129 (I), and anti‐Csnk1e/d antibodies (J), and with ProteoStat dye (K). Ant1/2 are mitochondrial membrane proteins and arrowheads indicate extra‐mitochondrial Chchd2T61I (G). In (H–K), arrowheads indicate the colocalization of puncta with Chchd2T61I and the indicated proteins or aggresomes. Dashed lines indicate cell shapes. Quantitative analyses are shown in Appendix Fig S9G, I and L. In addition, the results of heterozygous mice are shown in Appendix Fig S9.
- L
Isolated midbrain and diencephalon lysates were subjected to Western blotting. A semiquantitative analysis of protein expression is shown in Appendix Fig S10.
- M
EM analysis of dopaminergic neurons in the SNpc of CHCHD2T61I knock‐in mice. A dying dopaminergic neuron with small inclusion bodies is shown. N: nucleus. A magnified image of the same cell is shown in Fig EV3C. In (C, E), comparisons were performed using one‐way ANOVA followed by the Tukey post hoc tests. *P < 0.05; **P < 0.01. NS: not significant.

Schematic representation of the gene map of Mus musculus chromosome 5.
Structures of the Chchd2 and Zbed5/Scand3 proteins. The protein sequence of Chchd2 is very similar (97.3%) to that of the N‐terminal domain of Zbed5/Scand3.
Schematic representation of the targeting vector and targeted allele of the Chchd2 gene. The 5.8‐kb region of the mouse Chchd2 gene, including exons 2–4, was recombined with the C182T SNP‐mutated sequence. A 1.5‐kb 5′ fragment and a 1.5‐kb 3′ fragment were used as the homologous arms. Small arrows indicate the position of the primers used for genotyping PCR. The green line indicates the PCR product used for sequencing. Red and blue lines indicate PCR products for Sal I and Mlu I, respectively.
Genotyping was performed by genome amplification of by PCR (green line in (C), about 9,000 bp including a modified genome sequence) from tail genomic DNA followed by sequencing.
Genotyping was also performed by genome amplification by PCR (red and blue lines in (C), about 3,000 bp) followed by digestion with the respective restriction enzymes. M indicates a lane of DNA markers. The primers used are listed in Appendix Table S1.

- A–C
Sections of DA neurons in the SNpc of CHCHD2T61I/T61I knock‐in mice. Magnified images of the area within the pink square in the top panels are shown in the middle panels, and those of the orange squares in the middle panels are shown in the bottom panels. (A, B) DA neurons contained an inclusion body (Inc). The nucleus (N), mitochondria (Mt), and Golgi (G) appeared almost normal. (C) A dying neuron containing an inclusion body (Inc) is shown. The nucleus appears shrunken, and mitochondria and Golgi are abnormally swollen. A low‐magnified image is shown in Fig 5M.
- D
A normal DA neuron in the SNpc of a littermate WT littermate mouse is shown. A magnified image of the area within the pink square is shown in the bottom panel.

- A
The limb‐clasping reflex was observed in Chchd2T61I Tg mice at 30 weeks of age. Quantitative analysis is shown in Appendix Fig S13A.
- B
Midbrain and diencephalon brain lysates were obtained from WT and Tg mice, and expression of the indicated proteins was analyzed by Western blotting. Quantitative analysis of protein expression is shown in Appendix Fig S13C.
- C, D
Abnormal motor performance in Chchd2T61I Tg mice. In (C), the footprint assay indicated motor deficits at 35 weeks. Quantitative analysis is shown in Appendix Fig S13B. In (D), the time that the indicated mice remained on the rotarod was measured. Data are shown as the mean ± SD (n = 4).
- E–G
Reduction in TH signals in the SNpc of Tg mice. In (E), brain cryosections were immunostained with the dopaminergic cell marker TH. Representative images of the SNpc and VTA are shown. Dashed lines indicate the SNpc and VTA regions. Bars = 200 μm. In (F), TH signals in the SNpc (average fluorescence intensity per region) are shown as the mean ± SD (n = 3). In (G), cryosections of the SNpc were immunostained with anti‐HA and anti‐TH antibodies. Arrowheads indicate Chchd2T61I‐HA puncta in TH‐positive cells. Dashed lines indicate cell shapes.
- H–L
Extra‐mitochondrial aggresome formation by p‐Nefl473, p‐α‐Syn129, and Csnk1e/d in the SNpc of Tg mice. Cryosections of the SNpc were immunostained with anti‐HA and anti‐Ant1/2 (H), anti‐p‐Nefl473 (I), and anti‐p‐α‐Syn129 antibodies (J), ProteoStat dye (K), and anti‐Csnk1e/d antibodies (L). Arrowheads indicate extra‐mitochondrial Chchd2T61I‐HA (H). In (I–L), arrowheads indicated the colocalization of puncta with Chchd2T61I‐HA and the indicated proteins. Dashed lines indicate cell shapes. Quantitative data are shown in Appendix Fig S13D–F.
- M
EM analysis of dopaminergic neurons in the SNpc of Chchd2T61I‐HA Tg mice. A dopaminergic neuron with an abnormal nuclear/cell shape and an inclusion body is shown. The red arrowhead indicates an inclusion body. N: nucleus. A magnified image of this cell is shown in Appendix Fig S14. In (D, F), comparisons were performed using unpaired two‐tailed Student t‐test. *P < 0.05; **P < 0.01.
- A–C
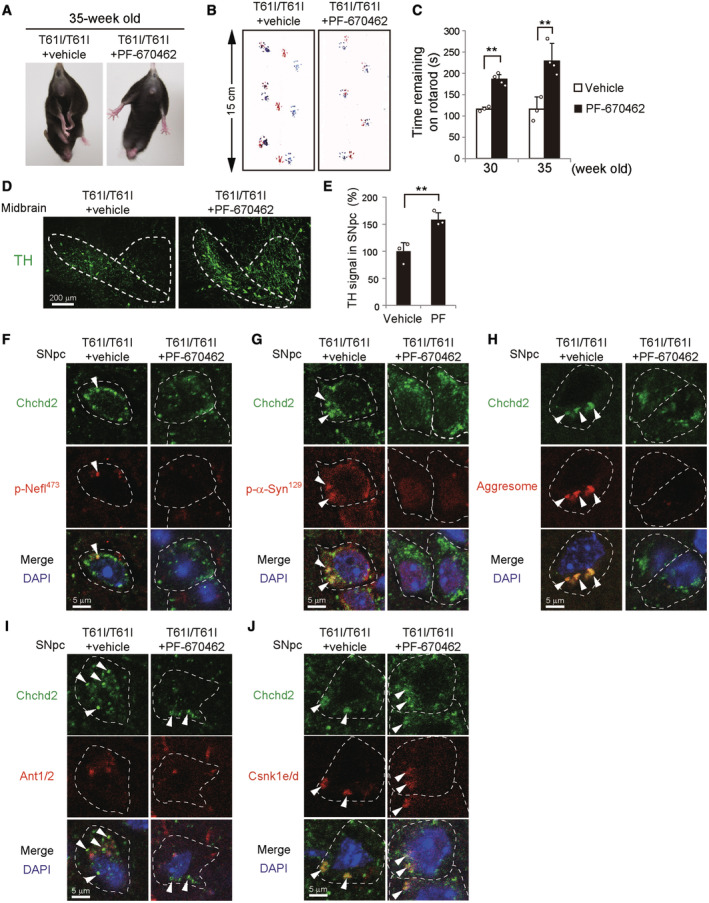
Improvement of motor performance in Chchd2T61I knock‐in mice by PF‐670462. PF‐670462 (50 ng/g BW/day) or 5% DMSO was continuously infused into the brain of Chchd2T61I knock‐in mice from 16 weeks of age. Improvement of the limb‐clasping reflex (A) and abnormal footprint patterns (B) was observed. Quantitative analyses are shown in Appendix Fig S17C and D. In (C), the time the indicated mice remained on the rotarod was measured. Data are shown as the mean ± SD (vehicle, n = 3; PF‐670462, n = 4).
- D, E
The same experiments as Fig 5D and E were performed using PF‐670462‐infused and vehicle‐infused Chchd2 T61I knock‐in mice.
- F–J
The same experiments as Fig 5G–K were performed using PF‐670462‐infused and vehicle‐infused Chchd2 T61I knock‐in mice. Quantitative analyses are shown in Appendix Fig S17F–I. In (C, E), comparisons were performed using one‐way ANOVA followed by the Tukey post hoc test and an unpaired two‐tailed Student t‐test. **P < 0.01.

- A
Photos of the midbrain of a control subject (left) and PD patient harboring the CHCHD2T61I mutation (right). The dashed lines indicate the SNpc. A portion of the midbrain of the control subject was lost when slicing.
- B–G
Colocalization of extra‐mitochondrial CHCHD2T61I with CSNK1E/D, p‐NEFL472, and p‐α‐SYN129 in the brain of a PD patient harboring the CHCHD2T61I mutation. Each brain section was deparaffinized and immunostained with anti‐CHCHD2 and anti‐ANT1/2 (B), anti‐CSNK1E/D (C), anti‐p‐NEFL472 (D, E), or anti‐p‐α‐SYN129 antibodies (F, G). Arrowheads indicate extra‐mitochondrial CHCHD2T61I puncta (B), and puncta showing colocalization of CHCHD2T61I with CSNK1E/D (C), p‐NEFL472 (D), and p‐α‐SYN129 (F). Arrows indicate weaker colocalization between CHCHD2T61I and the indicated proteins in the control brain (C, D, F). Dashed lines indicate cell shapes. In (E, G), the amount of p‐NEFL472 (E) and p‐α‐SYN129 (G) was measured by the average fluorescence intensity per cell (n = 30 cells in each experiment). Red bars indicate mean values. Comparisons were performed using the unpaired two‐tailed Student t‐tests. **P < 0.01.

- A–E
iPSCs were prepared from a healthy control and a PD patient harboring the CHCHD2T61I mutation. An isogenic control iPSC line was generated by the correction of the gene mutation (see Fig EV5A and B). Then, these iPSC cells were differentiated into dopaminergic (DA) neurons, and analyzed by immunofluorescence using anti‐CHCHD2 (A–E), anti‐ANT1/2 (A), anti‐CSNK1E/D (B), anti‐p‐NEFL472 (C), and anti‐p‐α‐SYN129 antibodies (D), and ProteoStat aggresome dye (E).
- F–H
CHCHD2T61I iPSC‐derived DA neurons were treated with PF‐670462 (10 μM) for 20 h and analyzed by immunofluorescence using anti‐CHCHD2 (F–H), anti‐p‐NEFL472 (F), and anti‐p‐α‐SYN129 antibodies (G), and ProteoStat aggresome dye (H). Arrowheads indicate extra‐mitochondrial CHCHD2T61I (A), puncta showing colocalization of CHCHD2T61I with CSNK1E/D (B), p‐NEFL472 (C, F), and p‐α‐SYN129 (D, G), or aggresomes (E, H). Dashed lines indicate cell shapes. Quantitative analyses are shown in Fig EV5.


- A
Schematic design of the guide RNA (gRNA) and the oligo donor for making isogenic control iPSC lines from patient‐derived iPSCs. A mutation of thymine in both the edited allele and gRNA and the recovered cytosine in the oligo donor are shown in red. The two additional synonymous mutations that were used to introduce a de novo SacII site into the oligo donor are shown in green.
- B
Cultured DA neurons from iPSCs were observed by differential interference contrast microscopy. DA neurons from non‐patient iPSCs (Control) and gene‐corrected CHCHD2T61I iPSCs (T61I‐WT) looked healthy with neurite elongation, whereas those from CHCHD2T61I iPSCs (T61I) were shrunken and without neurite elongation.
- C
DA neurons of each type were fixed and stained with anti‐CHCHD2 and anti‐TH antibodies. Dashed lines indicate cell shapes, and arrowheads indicate abnormal CHCHD2T61I puncta.
- D
Quantification of cells displaying mitochondrial CHCHD2 puncta and extra‐mitochondrial CHCHD2 puncta (n ≥ 100 cells in each experiment). Data are shown as the mean ± SD (n = 3).
- E–G
Quantitative data of Fig 8C–E (n = 30 cells in each experiment). Red bars indicate mean values.
- H–J
Quantitative data of Fig 8F–H (n = 30 cells in each experiment). Red bars indicate mean values.
- K, L
PF‐670462 has no effect on the extra‐mitochondrial localization of CHCHD2T61I. DA neurons from CHCHD2T61I iPSCs were treated with PF‐670462 for 20 h. Then, cells were fixed and stained with an anti‐CHCHD2 and anti‐ANT1/2 antibodies. In (K), representative images are shown. Dashed lines indicate cell shapes, and arrowheads indicate extra‐mitochondrial CHCHD2T61I puncta. (L) Quantification of cells displaying mitochondrial CHCHD2 and extra‐mitochondrial CHCHD2 puncta (n ≥ 100 cells in each experiment). Data are shown as the mean ± SD (n = 3). Comparisons were performed using one‐way ANOVA followed by the Tukey post hoc test (D–G) or unpaired two‐tailed Student t‐test (H–J, L). *P < 0.05; **P < 0.01; NS: not significant.
References
-
- Badura L, Swanson T, Adamowicz W, Adams J, Cianfrogna J, Fisher K, Holland J, Kleiman R, Nelson F, Reynolds L et al (2007) An inhibitor of casein kinase I epsilon induces phase delays in circadian rhythms under free‐running and entrained conditions. J Pharmacol Exp Ther 322: 730–738 - PubMed
-
- Basso M, Giraudo S, Corpillo D, Bergamasco B, Lopiano L, Fasano M (2004) Proteome analysis of human substantia nigra in Parkinson's disease. Proteomics 4: 3943–3952 - PubMed
-
- Cornelissen T, Spinazzi M, Martin S, Imberechts D, Vangheluwe P, Bird M, De Strooper B, Vandenberghe W (2020) CHCHD2 harboring Parkinson's disease‐linked T61I mutation precipitates inside mitochondria and induces precipitation of wild‐type CHCHD2. Hum Mol Genet 29: 1096–1106 - PubMed
Publication types
MeSH terms
Substances
LinkOut - more resources
Full Text Sources
Medical
Molecular Biology Databases
