

Associations of Brain Entropy Estimated by Resting State fMRI With Physiological Indices, Body Mass Index, and Cognition
- PMID: 37578314
- PMCID: PMC10864678
- DOI: 10.1002/jmri.28948
Associations of Brain Entropy Estimated by Resting State fMRI With Physiological Indices, Body Mass Index, and Cognition
Abstract
Background: In recent years, resting-state fMRI (rsfMRI)-based brain entropy (BEN) has gained increasing interest as a tool to characterize brain activity. While previous studies indicate that BEN is correlated with cognition, it remains unclear whether BEN is influenced by other factors that typically affect brain activity measured by fMRI.
Purpose: To investigate the relationship between BEN and physiological indices, including respiratory rate (RR), heart rate (HR), systolic blood pressure (s-BP), and body mass index (BMI), and to investigate whether and to what extent the relationship between BEN and cognition is influenced by physiological variables.
Study type: Retrospective.
Subjects: One thousand two hundred six healthy subjects (mean age: 28.83 ± 3.69 years; 550 male) with rsfMRI datasets selected from the Human Connectome Project (HCP).
Field strength/sequence: Multiband echo planar imaging (EPI) sequence at 3.0 Tesla.
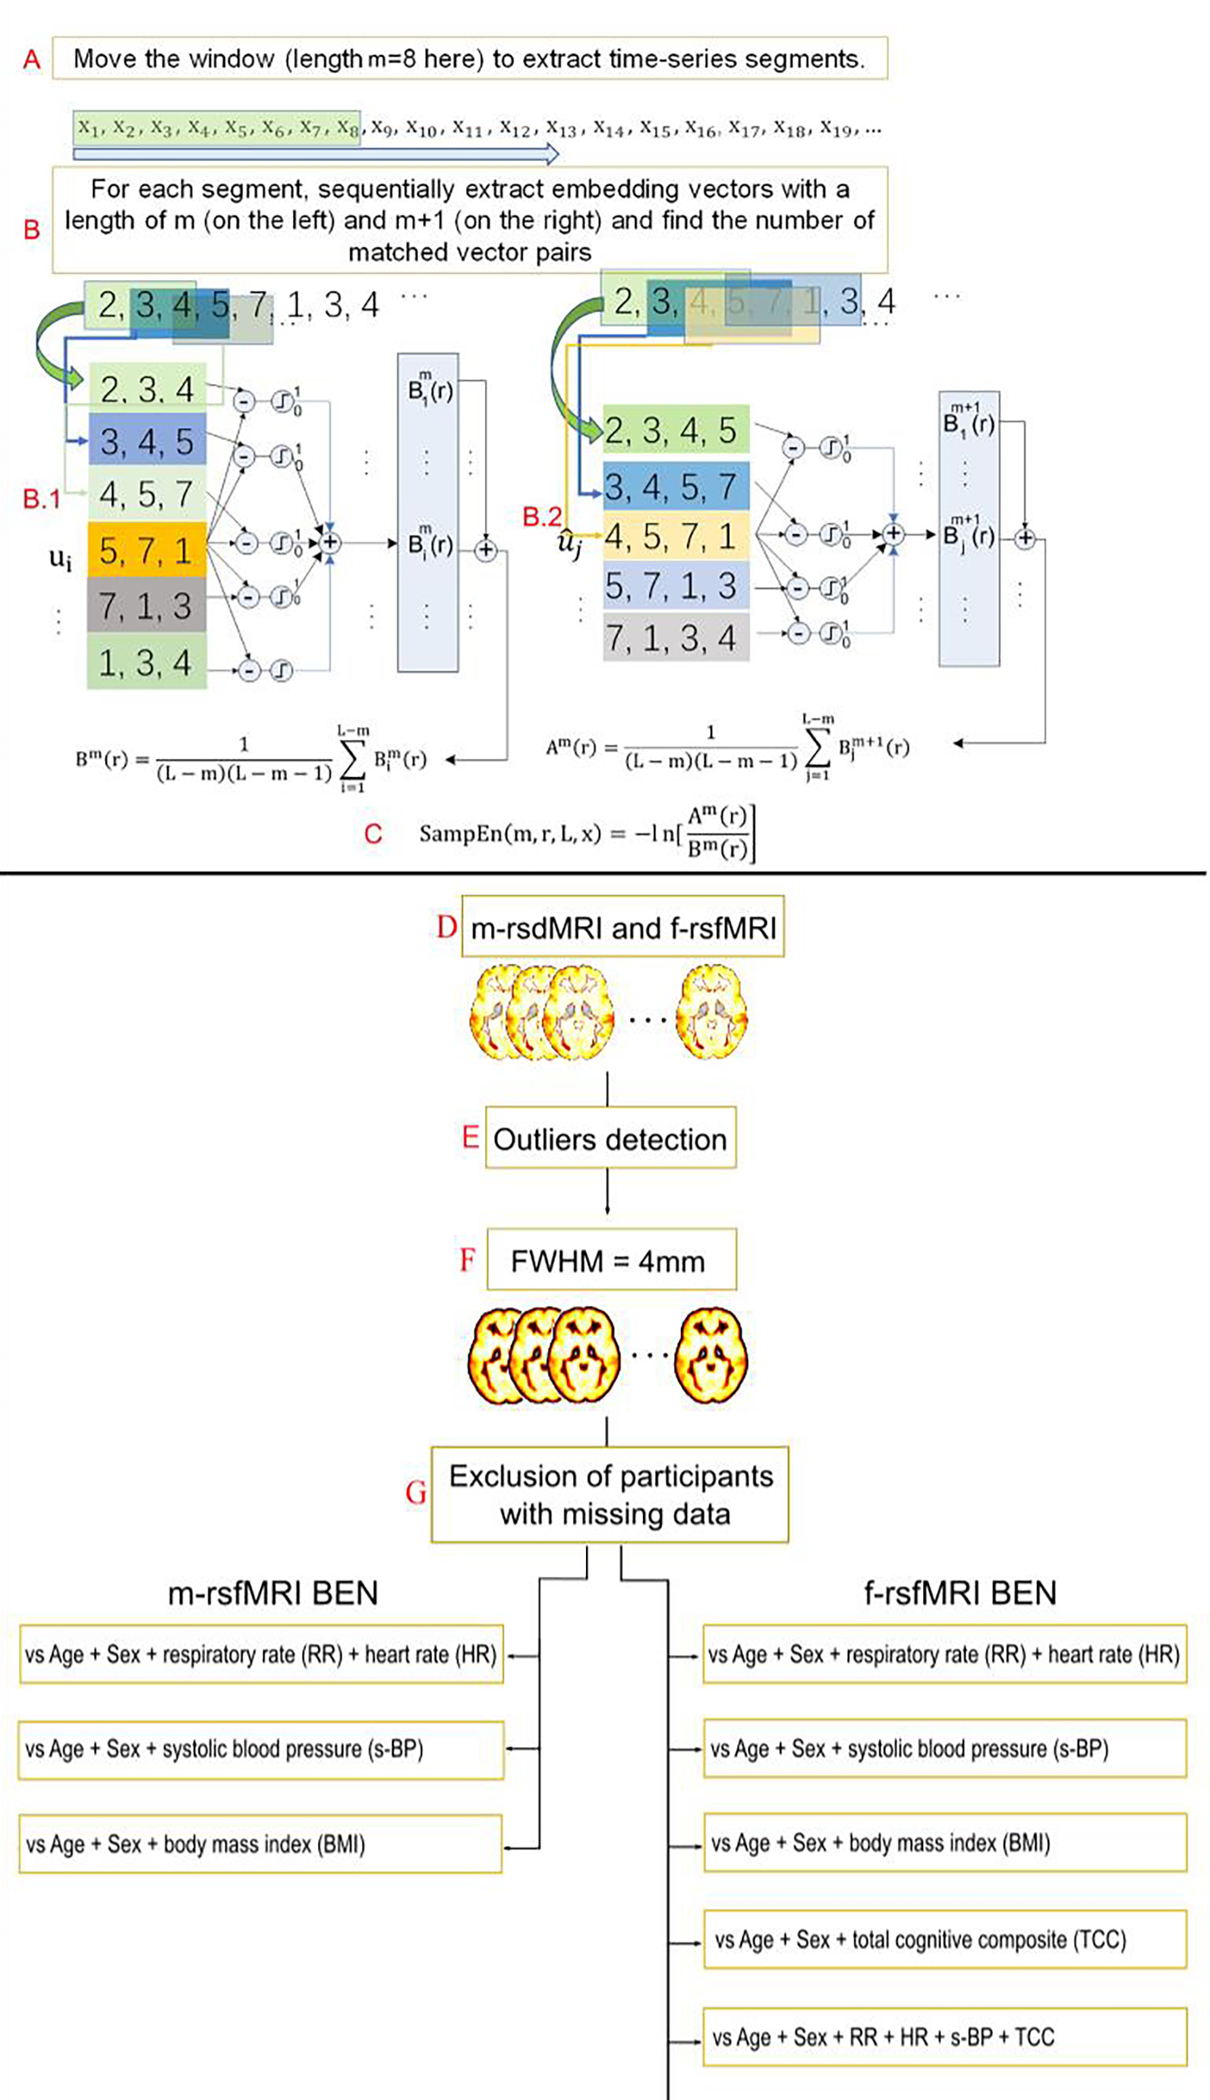
Assessment: Neurocognitive, physical health (RR, HR, s-BP, BMI), and rsfMRI data were retrieved from the HCP datasets. Neurocognition was measured through the total cognition composite (TCC) score provided by HCP. BEN maps were calculated from rsfMRI data.
Statistical tests: Multiple regression models, pheight-family wise error (FWE) < 0.05 and pcluster-FWE < 0.05 were considered statistically significant.
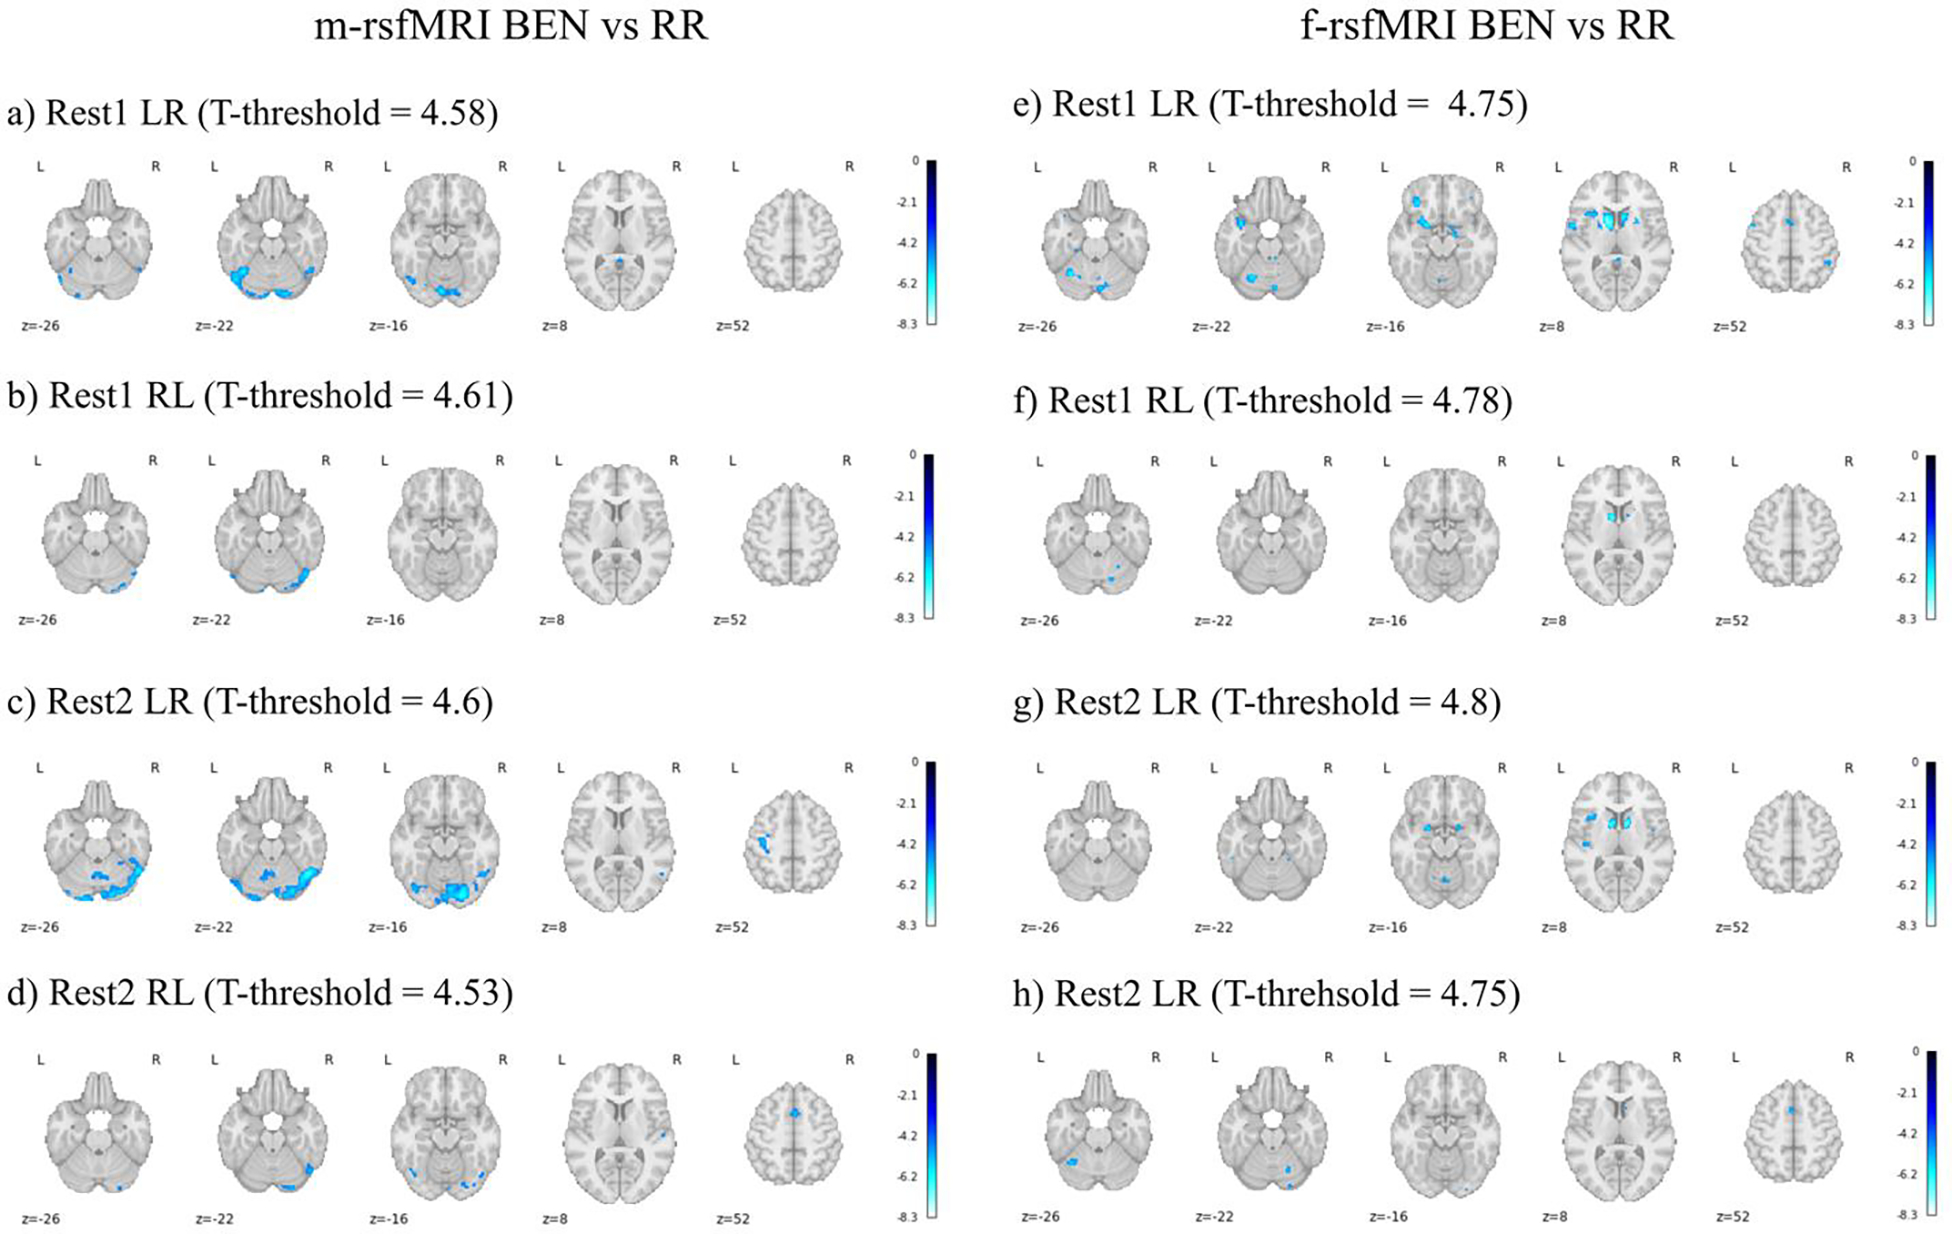
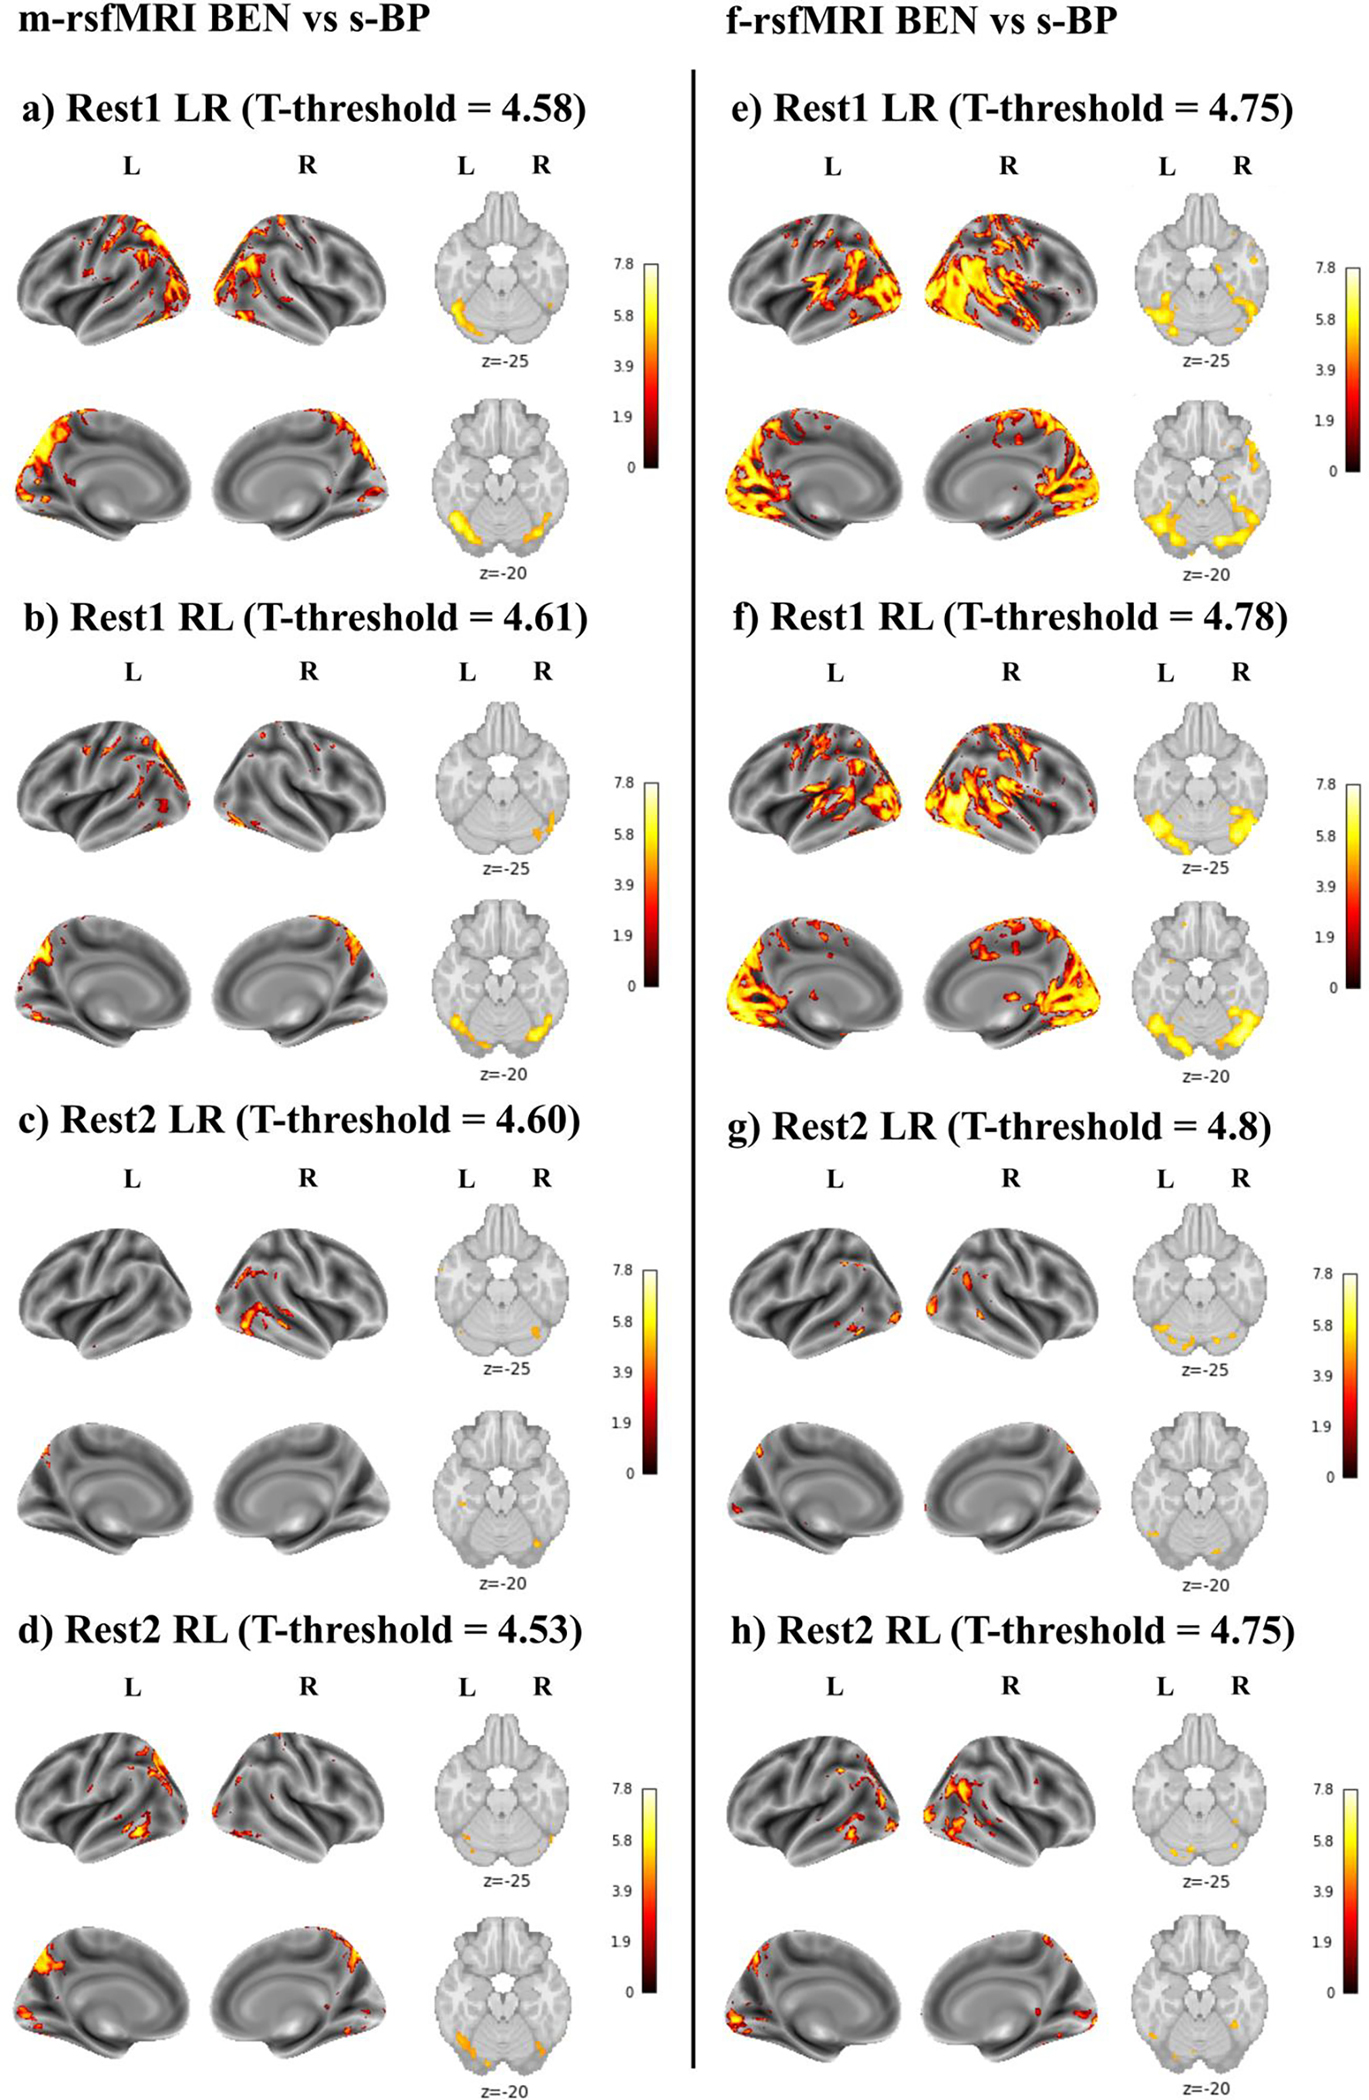
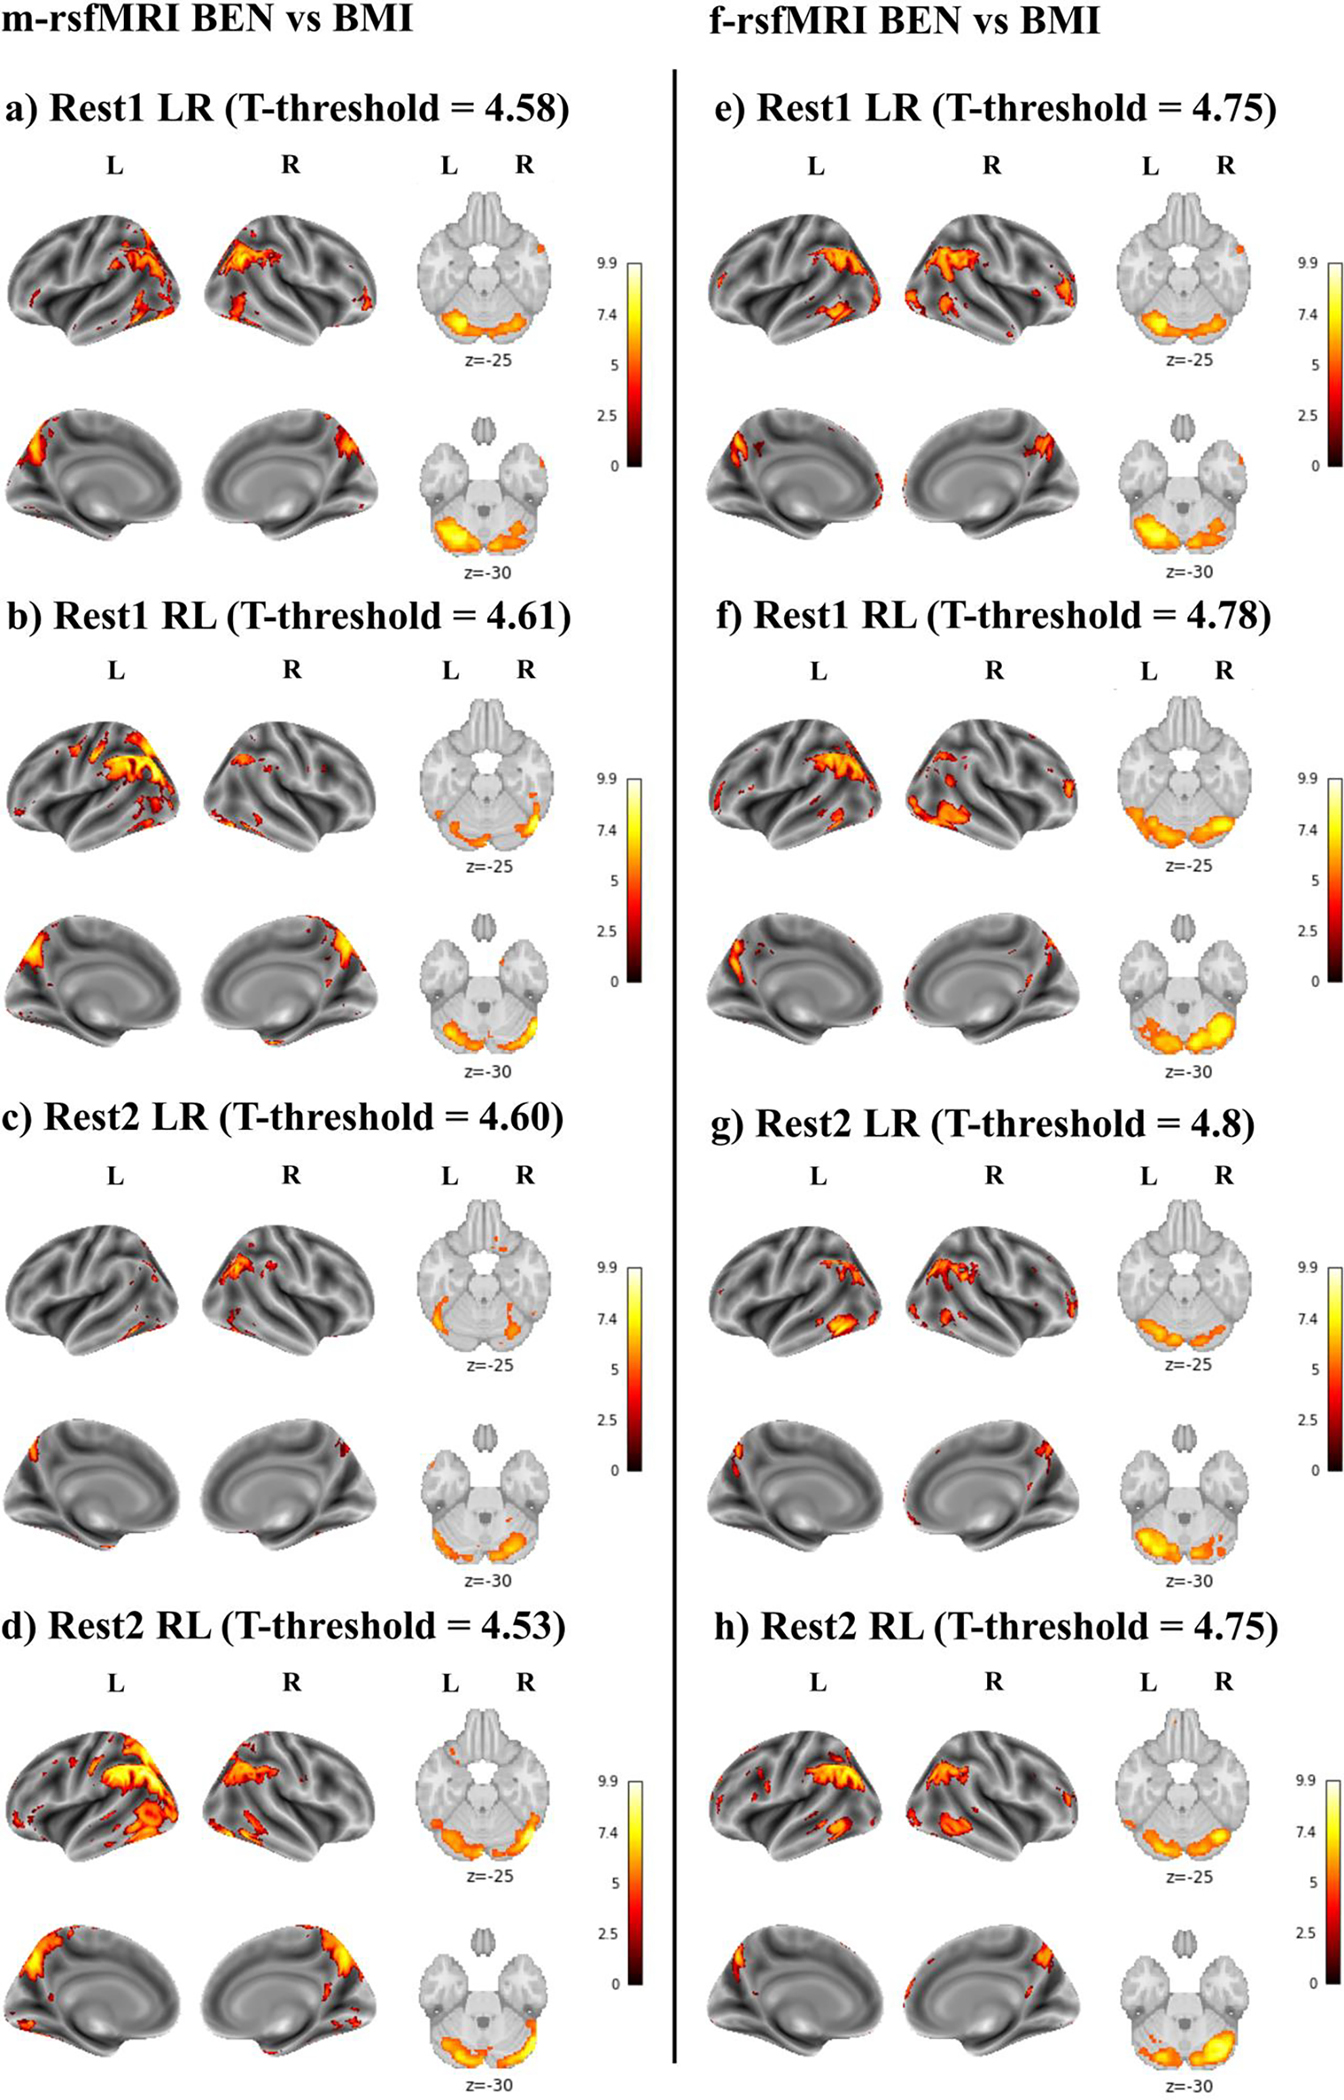
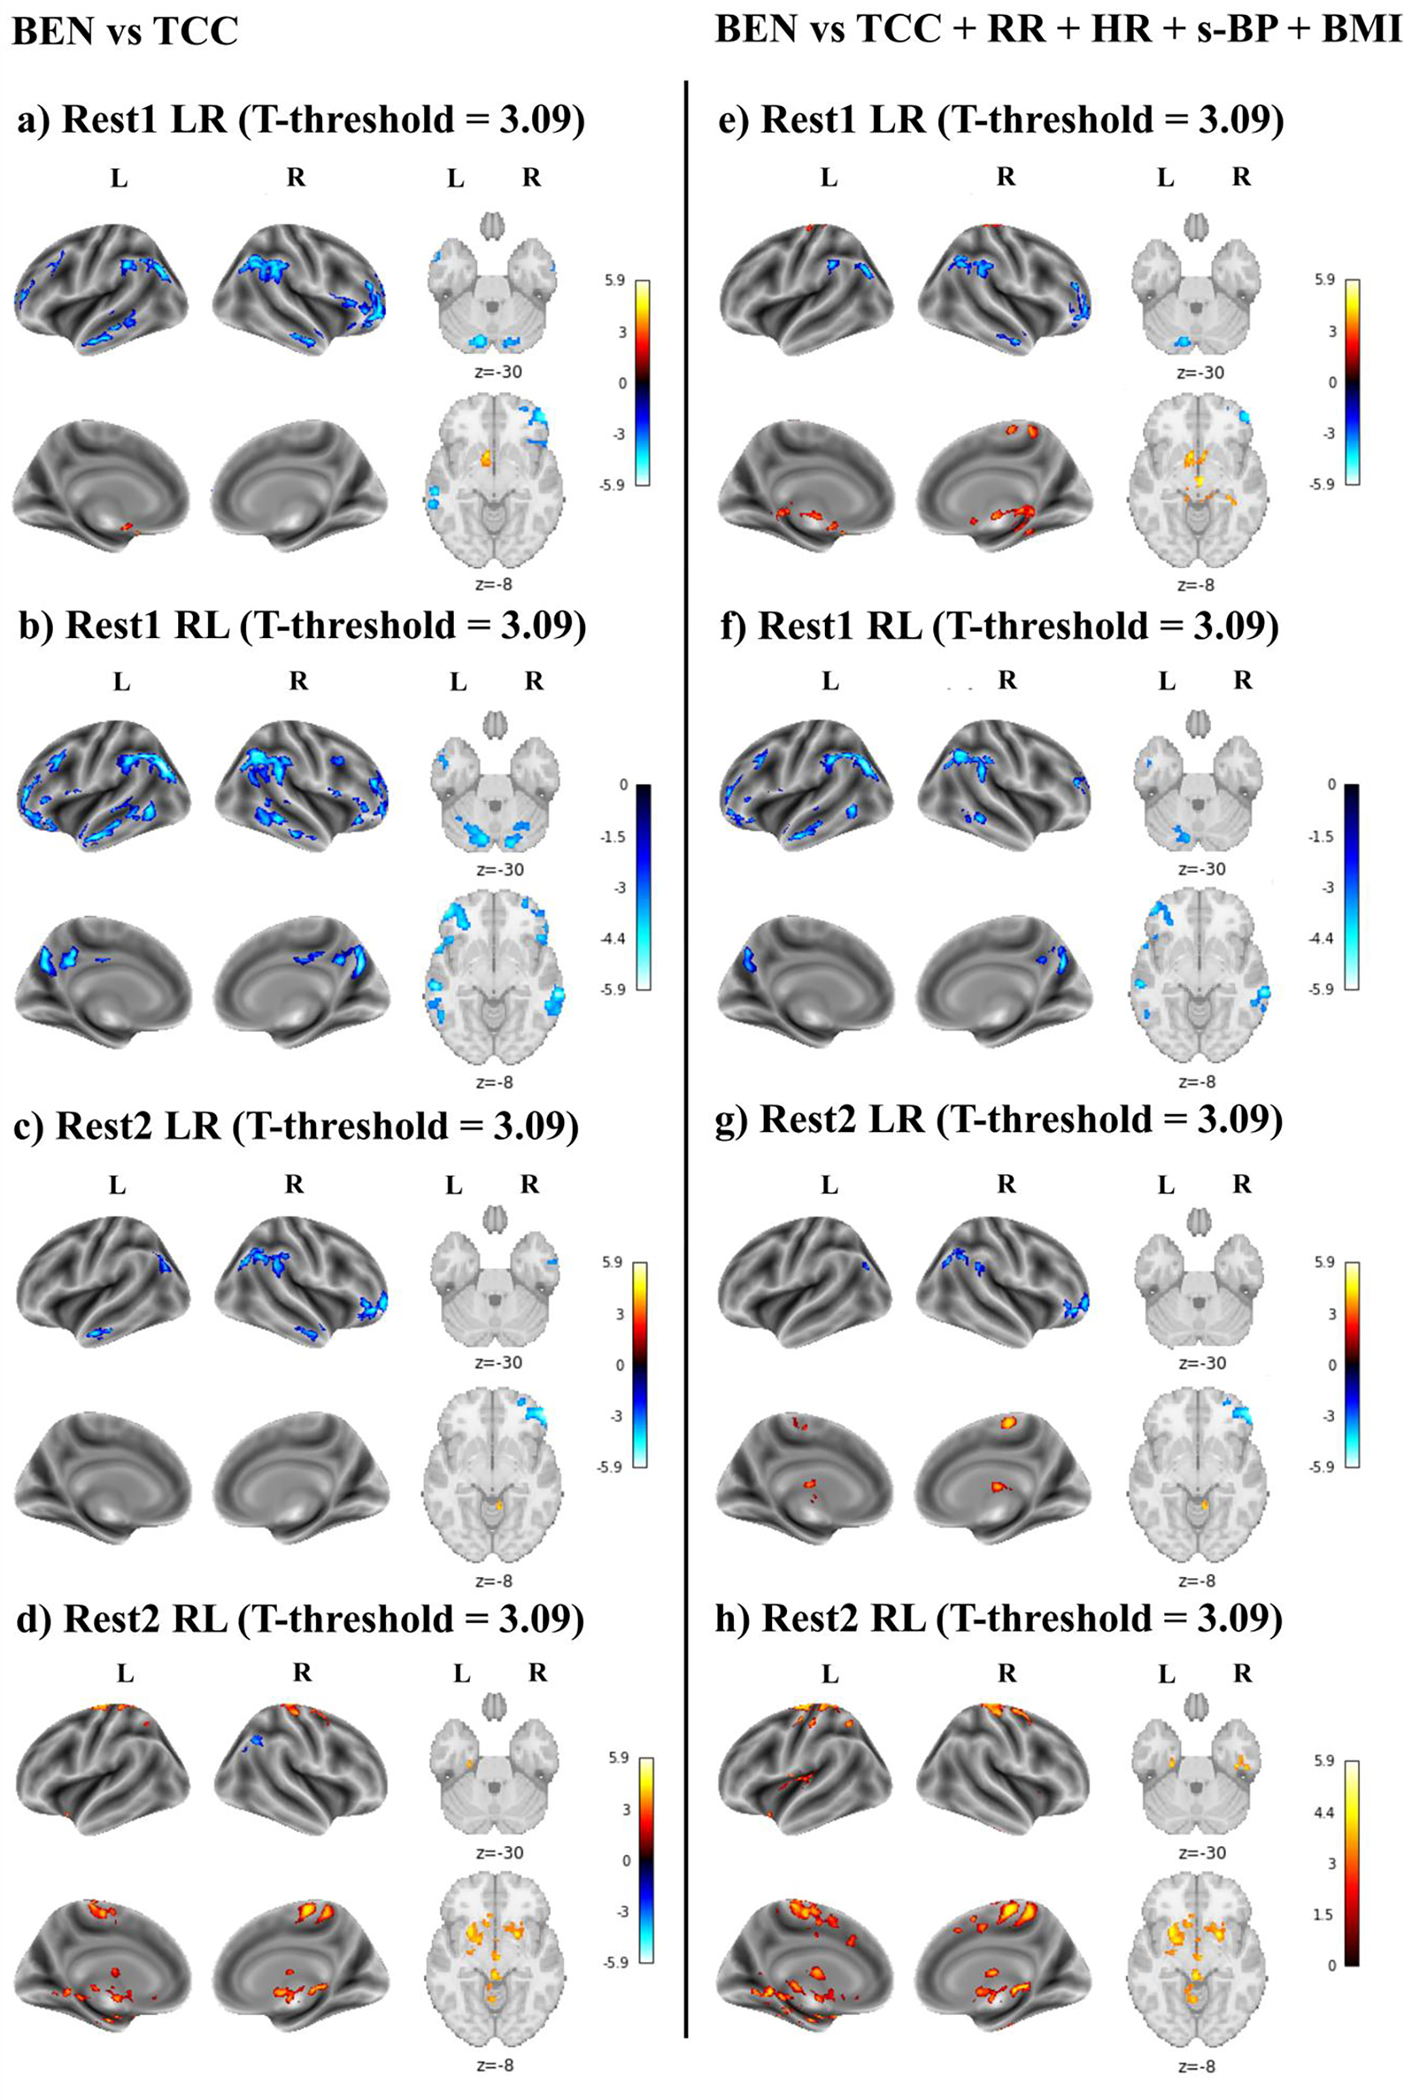
Results: BEN was negatively associated with RR (T-thresholds ranging from 4.75 to 4.8; r-threshold = |0.15|) and positively associated with s-BP and BMI (T-thresholds ranging from 4.75 to 4.8; r-threshold = |0.15|) in areas overlapping with the default mode network. After controlling the physiological effects, BEN still showed regional associations with TCC, including negative associations (T-thresholds = 3.09; r-threshold = |0.1|) in the fronto-parietal cortex and positive associations (T-thresholds = 3.09; r-threshold = |0.1|) in the sensorimotor system (motor network and the limbic system).
Data conclusions: RR negatively affects rsfMRI-derived BEN, while s-BP and BMI positively affect BEN. The positive associations between BEN and cognition in the motor network and the limbic system might indicate a facilitation of information processing in the sensorimotor system.
Evidence level: 3 TECHNICAL EFFICACY: Stage 3.
Keywords: blood pressure; body mass index; brain entropy; cognition; respiratory rate; resting state fMRI.
© 2023 International Society for Magnetic Resonance in Medicine.
Figures
Comment in
-
Editorial for "Associations of Brain Entropy Estimated by Resting State fMRI With Physiological Indices, Body Mass Index, and Cognition".J Magn Reson Imaging. 2024 May;59(5):1708-1709. doi: 10.1002/jmri.28997. Epub 2023 Sep 4. J Magn Reson Imaging. 2024. PMID: 37667467 No abstract available.
Similar articles
-
Divergent association between pain intensity and resting-state fMRI-based brain entropy in different age groups.J Neurosci Res. 2024 May;102(5):e25341. doi: 10.1002/jnr.25341. J Neurosci Res. 2024. PMID: 38751218 Free PMC article.
-
The neurocognitive correlates of brain entropy estimated by resting state fMRI.Neuroimage. 2021 May 15;232:117893. doi: 10.1016/j.neuroimage.2021.117893. Epub 2021 Feb 20. Neuroimage. 2021. PMID: 33621695 Free PMC article.
-
Task-induced changes in brain entropy.J Neurosci Res. 2024 Feb;102(2):e25310. doi: 10.1002/jnr.25310. J Neurosci Res. 2024. PMID: 38400553 Free PMC article.
-
Temporal complexity of fMRI is reproducible and correlates with higher order cognition.Neuroimage. 2021 Apr 15;230:117760. doi: 10.1016/j.neuroimage.2021.117760. Epub 2021 Jan 22. Neuroimage. 2021. PMID: 33486124
-
The Human Connectome Project: a data acquisition perspective.Neuroimage. 2012 Oct 1;62(4):2222-31. doi: 10.1016/j.neuroimage.2012.02.018. Epub 2012 Feb 17. Neuroimage. 2012. PMID: 22366334 Free PMC article. Review.
Cited by
-
Resting state fMRI-based brain information flow mapping.ArXiv [Preprint]. 2024 Apr 23:arXiv:2404.15173v1. ArXiv. 2024. PMID: 38711426 Free PMC article. Preprint.
-
Cross-subject brain entropy mapping.bioRxiv [Preprint]. 2024 Apr 10:2024.04.05.588307. doi: 10.1101/2024.04.05.588307. bioRxiv. 2024. PMID: 38645267 Free PMC article. Preprint.
-
The effects of intermittent theta burst stimulation (iTBS) on resting-state brain entropy (BEN).Neurotherapeutics. 2025 Apr;22(3):e00556. doi: 10.1016/j.neurot.2025.e00556. Epub 2025 Mar 5. Neurotherapeutics. 2025. PMID: 40050146 Free PMC article.
-
Global brain connectivity: Test-retest stability and association with biological and neurocognitive variables.J Neurosci Methods. 2024 Sep;409:110205. doi: 10.1016/j.jneumeth.2024.110205. Epub 2024 Jun 22. J Neurosci Methods. 2024. PMID: 38914376
-
Divergent association between pain intensity and resting-state fMRI-based brain entropy in different age groups.J Neurosci Res. 2024 May;102(5):e25341. doi: 10.1002/jnr.25341. J Neurosci Res. 2024. PMID: 38751218 Free PMC article.
References
-
- Clausius: Über die Wärmeleitung gasförmiger Körper. Ann Phys 1865; 125:353–400.
-
- Shannon CE: A Mathematical Theory of Communication. Bell System Technical Journal 1948; 27:379–423.
-
- Morowitz HJ: Energy Flow in Biology; Biological Organization as a Problem in Thermal Physics. Academic Press; 1968.
-
- Singer W: The Brain, a Complex Self-organizing System. European Review 2009; 17:321–329.
Publication types
MeSH terms
Grants and funding
- R21AG082345/AG/NIA NIH HHS/United States
- R01 AG060054/AG/NIA NIH HHS/United States
- R21 AG082345/AG/NIA NIH HHS/United States
- P41 EB029460/EB/NIBIB NIH HHS/United States
- R01 EB031080/EB/NIBIB NIH HHS/United States
- UL1 TR003098/TR/NCATS NIH HHS/United States
- R01AG070227/AG/NIA NIH HHS/United States
- P41EB029460-01A1/EB/NIBIB NIH HHS/United States
- R01 AG070227/AG/NIA NIH HHS/United States
- R01EB031080-01A1/EB/NIBIB NIH HHS/United States
- U54 MH091657/MH/NIMH NIH HHS/United States
- R01AG060054/AG/NIA NIH HHS/United States
LinkOut - more resources
Full Text Sources
Medical
Miscellaneous
