. 2023 Aug 14;80(9):249.
doi: 10.1007/s00018-023-04900-x.

Crosstalk between glucocorticoid and mineralocorticoid receptors boosts glucocorticoid-induced killing of multiple myeloma cells

Affiliations

Crosstalk between glucocorticoid and mineralocorticoid receptors boosts glucocorticoid-induced killing of multiple myeloma cells

Dorien Clarisse et al. Cell Mol Life Sci. .

Abstract

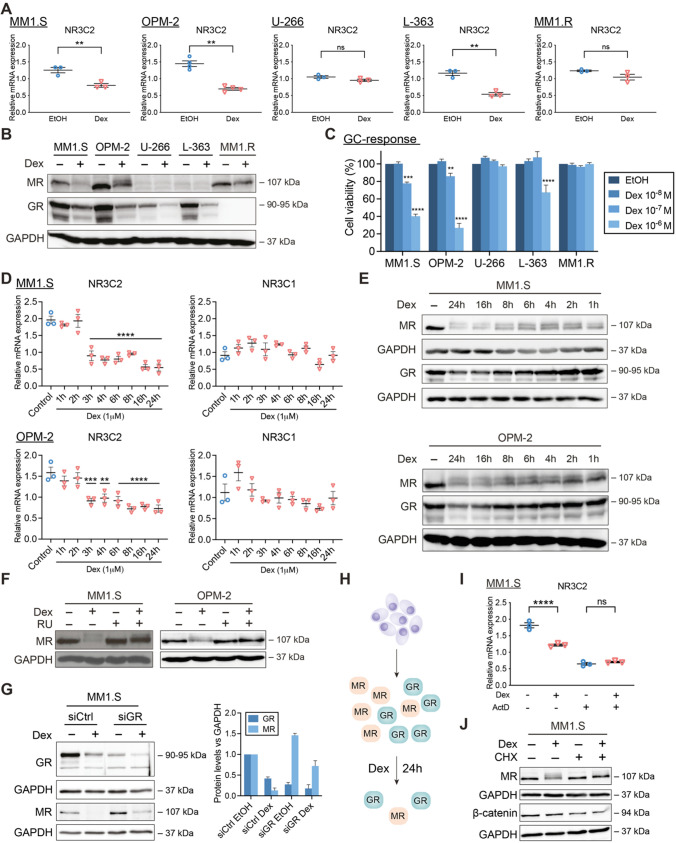
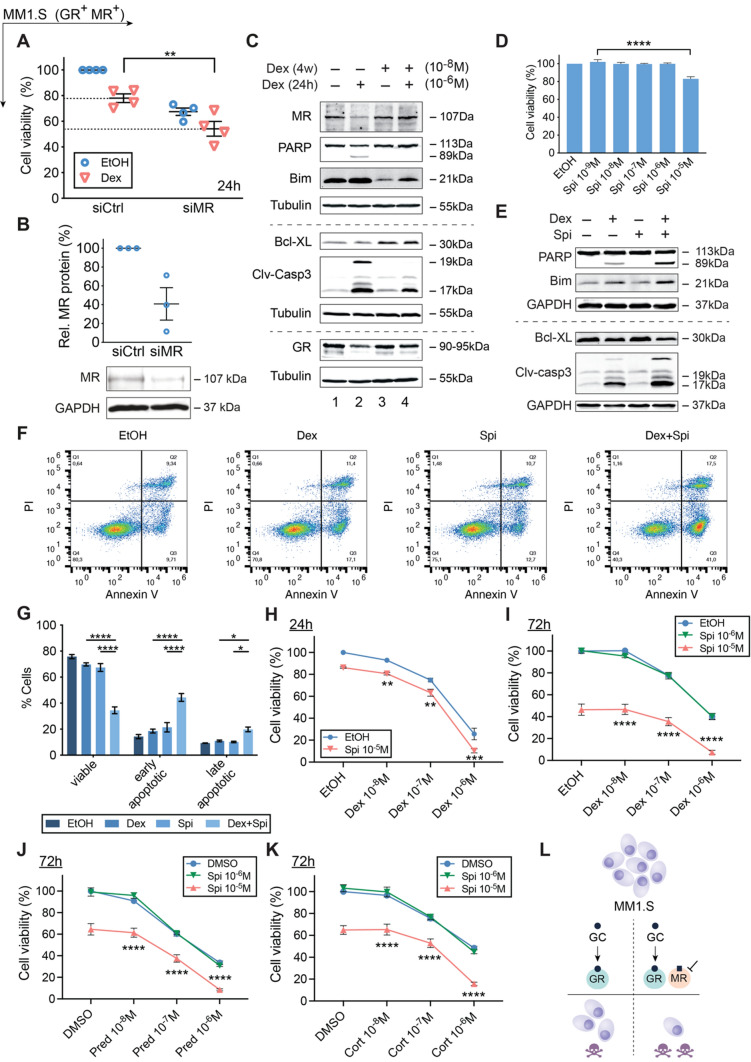
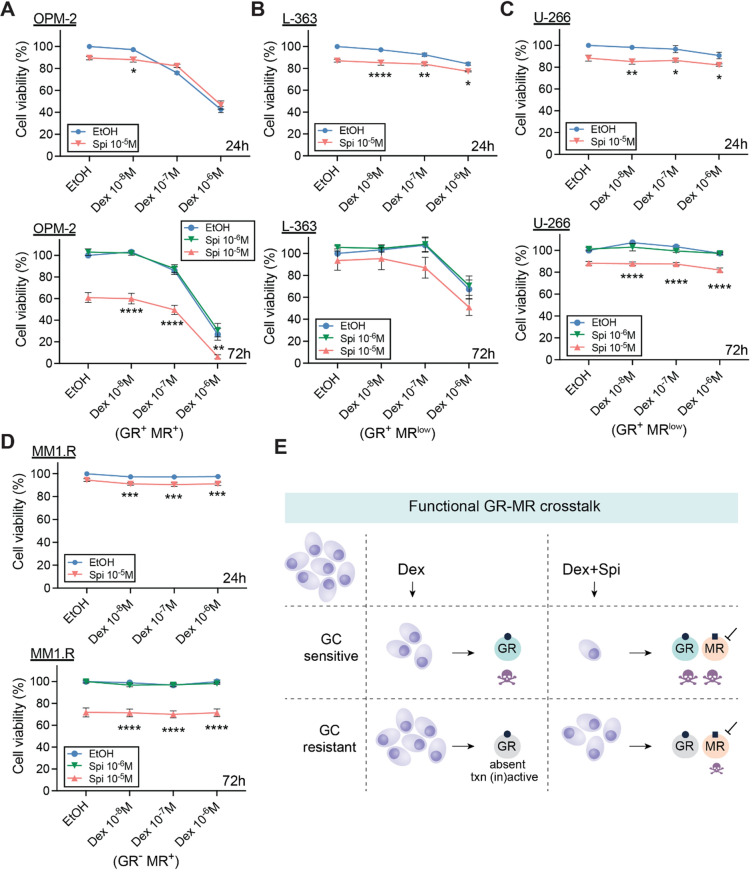
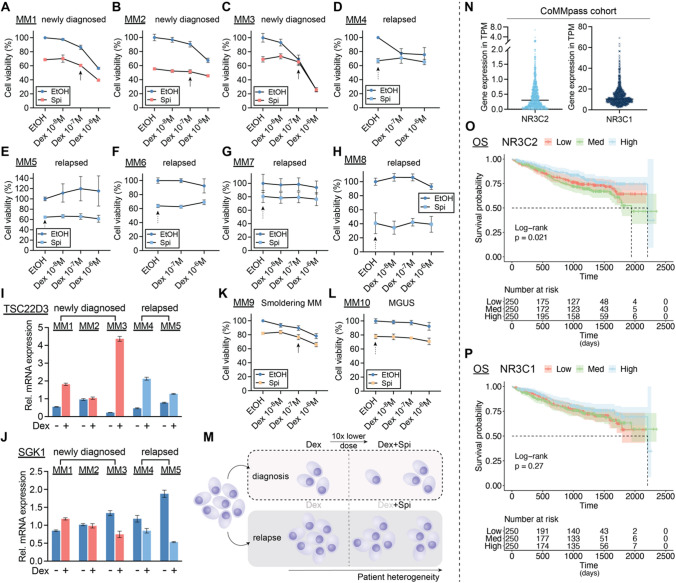
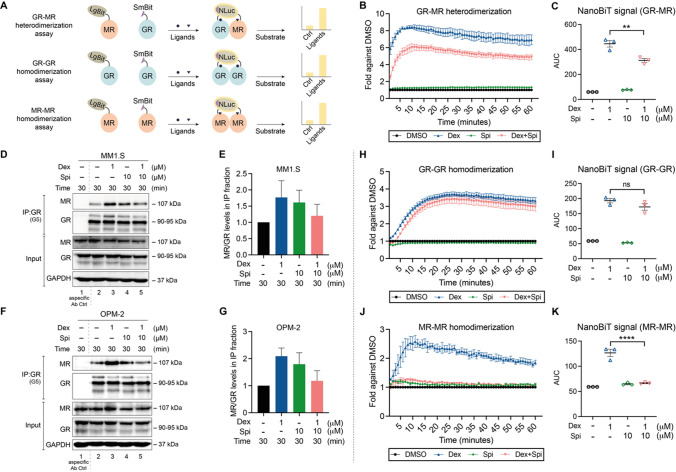
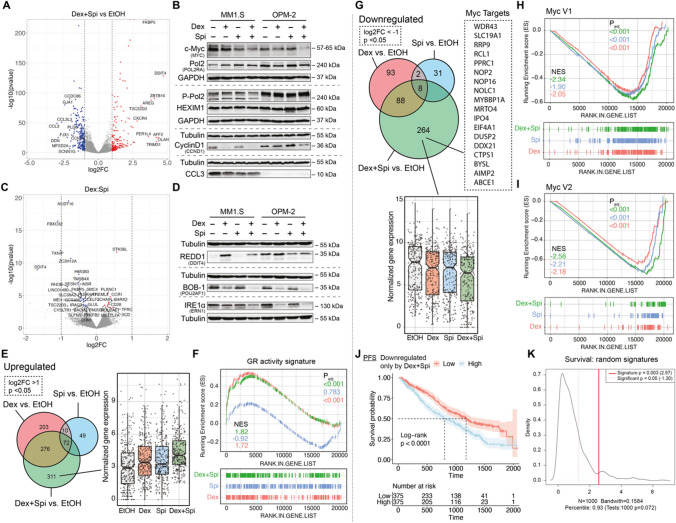
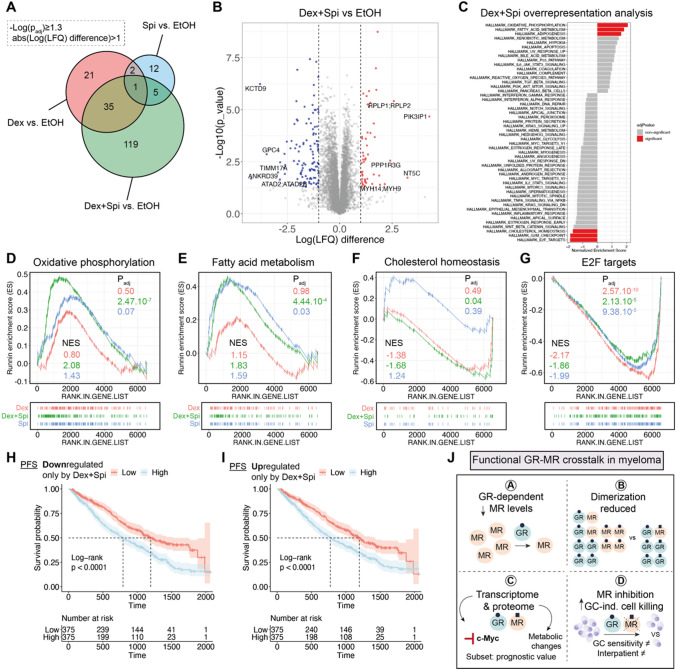
The glucocorticoid receptor (GR) is a crucial drug target in multiple myeloma as its activation with glucocorticoids effectively triggers myeloma cell death. However, as high-dose glucocorticoids are also associated with deleterious side effects, novel approaches are urgently needed to improve GR action in myeloma. Here, we reveal a functional crosstalk between GR and the mineralocorticoid receptor (MR) that plays a role in improved myeloma cell killing. We show that the GR agonist dexamethasone (Dex) downregulates MR levels in a GR-dependent way in myeloma cells. Co-treatment of Dex with the MR antagonist spironolactone (Spi) enhances Dex-induced cell killing in primary, newly diagnosed GC-sensitive myeloma cells. In a relapsed GC-resistant setting, Spi alone induces distinct myeloma cell killing. On a mechanistic level, we find that a GR-MR crosstalk likely arises from an endogenous interaction between GR and MR in myeloma cells. Quantitative dimerization assays show that Spi reduces Dex-induced GR-MR heterodimerization and completely abolishes Dex-induced MR-MR homodimerization, while leaving GR-GR homodimerization intact. Unbiased transcriptomics analyses reveal that c-myc and many of its target genes are downregulated most by combined Dex-Spi treatment. Proteomics analyses further identify that several metabolic hallmarks are modulated most by this combination treatment. Finally, we identified a subset of Dex-Spi downregulated genes and proteins that may predict prognosis in the CoMMpass myeloma patient cohort. Our study demonstrates that GR-MR crosstalk is therapeutically relevant in myeloma as it provides novel strategies for glucocorticoid-based dose-reduction.

Keywords: Glucocorticoid receptor; Glucocorticoids; Mineralocorticoid receptor; Multiple myeloma; Nuclear receptor crosstalk.


Conflict of interest statement

The authors have no relevant financial or non-financial interests to disclose.

Figures

Fig. 1
Fig. 1
GCs downregulate MR mRNA and protein levels in a GR-dependent way. (A, B) MM1.S, OPM-2, U-266, L-363 and MM1.R cells were treated with Dex (10−6 M) or solvent control (EtOH), (A) for 6 h, followed by RT-qPCR (all N = 3, except OPM-2: N = 4), assessing the mRNA levels of NR3C2 (MR), or (B) for 24 h, followed by WB analysis (N = 3). The protein levels of MR (107 kDa) and GR (90–95 kDa) were determined, with GAPDH (37 kDa) as loading control. (C) MM1.S, OPM-2, U-266, L-363 and MM1.R cells were treated for 72 h with a Dex concentration range (10−6 M–10−8 M) or solvent control (EtOH, set as 100%), followed by a CelltiterGlo cell viability assay (72 h Dex range recapitulated from Figs. 2I and 3B–D). The bar plots represent the mean ± SEM. Statistical analyses were performed using GraphPad Prism 9, using a two-way ANOVA with post hoc testing. Per cell line, 10−6 M Dex and 10−7 M Dex conditions were statistically compared to the 10−8 M Dex condition. (D, E) MM1.S or OPM-2 cells were treated for different time points with Dex (10−6 M) or solvent control (EtOH) followed by (D) RT-qPCR (N = 3), assessing the mRNA levels of NR3C2 (MR) and NR3C1 (GR) and in which statistical analyses compared each time point to solvent control, or (E) WB analysis (N = 3), in which the protein levels of MR (107 kDa) and GR (90–95 kDa) were determined, with GAPDH (37 kDa) as loading control. (F) OPM-2 and MM1.S cells were treated with Dex (10−6 M), RU (10−5 M), a combination thereof or solvent control for 24 h, followed by WB analysis (N = 3). The protein levels of MR (107 kDa) were determined, with GAPDH (37 kDa) as loading control. (G) MM1.S cells were nucleofected with siCtrl (scrambled) or siGR and 48 h post-nucleofection treated for another 24 h with Dex (10−6 M) or solvent control, followed by WB analysis (N = 3) and band densitometric analysis (bar plot). The latter shows the normalized GR or MR protein levels (vs. GAPDH), averaged over 3 biological replicates. (H) Graphical summary. In MM cells containing GR and MR protein, Dex downregulates GR protein levels and to an even higher extent MR protein levels, especially at 24 h. (I) MM1.S cells were treated for 3 h with Dex (10−6 M), ActD (1 μg/mL), a combination thereof or solvent, followed by RT-qPCR (N = 3), assessing the mRNA levels of NR3C2. (J) MM1.S cells were treated for 6 h with Dex (10−6 M), CHX (20 μg/mL), a Dex/CHX combination or solvent control, followed by WB analysis (N = 3) and band densitometric analysis. The protein levels of MR (107 kDa), or β-catenin (94 kDa; positive control for inhibition of protein translation) were determined, with GAPDH (37 kDa) as loading control. Data information: (A, D, I) RT-qPCRs were analyzed using qBaseplus with SDHA, RPL13A and YWHAZ serving as reference genes. Note that the mRNA levels of the targets of interest are normalized to those of the above-mentioned reference genes (relative mRNA expression in the y-axis). The scatter plots represent the mean (solid line) ± SEM. Statistical analyses were performed using GraphPad Prism 9, using a one-way ANOVA with post-hoc testing. (B, E, F, G, J) One representative image is shown for each WB experiment, with the number of biological replicates mentioned in each panel description
Fig. 2
Fig. 2
GC-induced MM1.S cell killing is promoted by the MR antagonist Spi. (A) MM1.S cells were nucleofected with siCtrl (scrambled) or siMR. 48 h post-nucleofection, cells were reseeded and treated for another 24 h with Dex (10−6 M) or solvent control (EtOH), followed by a CelltiterGlo assay. The scatter plot represents the mean (solid line) ± SEM (N = 4). The siCtrl solvent condition was set as 100% and the other conditions were recalculated accordingly. (B) 72 h post-nucleofection with siCtrl or siMR, WB analyses were performed and MR protein levels relative to GAPDH were quantified by band densitometric analysis using ImageJ. The scatter plot represents the mean ± SEM (N = 3). (C) MM1.S cells were treated for 4 weeks with 10−8 M Dex (or EtOH), followed by 24 h 10−6 M Dex (or EtOH), and subjected to WB analyses (N = 3). (D) MM1.S cells were treated with a Spi concentration range (10−5 M–10−9 M) or solvent control (set as 100%), followed by a CelltiterGlo assay (N = 3). (E–G) MM1.S cells were treated with Dex (10−6 M), Spi (10−5 M) or a Dex-Spi combination for 24 h, followed by (E) WB analyses (N = 4) or (F, G) Annexin V/PI flow cytometric analyses (N = 4). (F) Representative quadrant plots of 4 independent experiments for each treatment condition, with (G) bar plots showing the percentage of viable (Q4), early apoptotic (Q3), late apoptotic (Q2) averaged over all 4 biological repetitions ± SEM. (H, I) MM1.S cells were treated with Dex (10−6 M–10−8 M), Spi (10–5–10−6 M) or a Dex-Spi combination for (H) 24 h (N = 5) or (I) 72 h (N = 3), followed by a CelltiterGlo assay (solvent control set as 100%). (J, K) MM1.S cells were treated with Pred or Cort (10−6 M–10−8 M), Spi (10–5–10−6 M) or a Pred/Spi or Cort/Spi combination for 72 h (N = 3), followed by a CelltiterGlo assay (solvent control set as 100%). (L) Summarizing model demonstrating that MR blockade increases Dex-induced MM1.S cell killing. Data information: (A, D, G–K) Statistical analyses were performed using GraphPad Prism 9, using (A, D) one-way or (G–K) two-way ANOVA with post hoc testing. (C, E) Protein lysates were subjected to WB analyses, visualizing the protein levels of MR (107 kDa), GR (90-95 kDa), PARP (89 and 113 kDa), Bim (21 kDa), Bcl-XL (30 kDa) and cleaved-caspase 3 (17 and 19 kDa). Tubulin (55 kDa) or GAPDH (37 kDa) served as loading controls. One representative image is shown for each WB experiment, with the number of biological replicates mentioned in each panel description
Fig. 3
Fig. 3
The MR antagonist Spi promotes cell killing of MM cells with varying degrees of Dex responsiveness. (A–D) Different myeloma cell lines including (A) OPM-2, (B) L-363, (C) U-266 and (D) MM1.R cells were treated with Dex (10−6 M–10−8 M), Spi (10–5–10−6 M), a Dex-Spi combination or solvent control (set as 100%) for 24 h or 72 h, followed by a CelltiterGlo assay. Biological replicates: OPM-2 (24 h N = 6; 72 h N = 4), L-363 (24 h and 72 h N = 3), U-266 (24 h N = 4, 72 h N = 3) and MM1.R (24 h N = 4, 72 h N = 3). (E) Graphical summary highlighting the existence of a functional crosstalk between GR and MR in MM cells. In GC-sensitive MM cells containing GR, Dex induces MM cell killing, which is further enhanced by the addition of Spi. In GC-resistant cells, where GR is either absent or transcriptionally (in)active, Dex loses its anti-MM activity, while Spi addition does trigger significant MM cell killing. Data information: (AD) Statistical analyses were performed using GraphPad Prism 9 using two-way ANOVA with post hoc testing
Fig. 4
Fig. 4
Combining lower doses of Dex with the MR antagonist Spi enhances cell killing in primary myeloma cells depending on the disease stage. (A–H) Patient-derived MM cells from bone marrow aspirates of (A–C) newly diagnosed, (D–H) relapsed or MM patients were treated with a Dex concentration range (10−6 M–10−8 M), Spi (10−5 M), a Dex-Spi combination or solvent control (EtOH) for 24 h (A, C–G) or 72 h (B, H), followed by a CelltiterGlo cell viability assay. (I, J) When the primary cell yield was sufficient, primary MM cells were treated for 6 h with Dex (10−6 M) or solvent control, followed by RNA isolation and RT-qPCR analyses to determine the expression levels of TSCD22D3 (GILZ) and SGK1. Data analyses were performed using qBaseplus with SDHA, RPL13A and YWHAZ serving as reference genes. Note that the mRNA levels of the targets of interest are normalized to those of the above-mentioned reference genes (relative mRNA expression in the y-axis). The bar plots represent the mean ± SD of 3 technical replicates. Overall, no statistical analyses were performed because only 1 biological replicate could be carried out given the limited culturing time of primary MM cells isolated from a BM aspirate. (K, L) Patient-derived MM cells from bone marrow aspirates of premalignant (smoldering MM or MGUS) myeloma patients were treated with a Dex concentration range (10−6 M–10−8 M), Spi (10−5 M), a Dex-Spi combination or solvent control (EtOH) for 24 h (L) or 48 h (K) followed by a CelltiterGlo cell viability assay. (M) Graphical summary demonstrating that primary MM cells isolated at diagnosis undergo profound Dex-mediated cell killing, while the addition of Spi to a tenfold lower Dex dose triggers more extensive cell killing, although not the same extent in all patients. In the relapsed setting, Dex is unable to induce significant primary MM cell killing, while Spi triggers a substantial MM cell killing response. The extent of the described cell killing effects varies from patient to patient, due to interpatient heterogeneity, which is well known in MM. (N) TPM (transcripts per million) gene expression values, generated via RNA-sequencing, of NR3C2 (MR) and NR3C1 (GR) in the CoMMpass cohort; only samples at diagnosis were taken along. (O, P) Kaplan–Meier curve of the MMRF patient cohort, depicting the survival probability in function of overall survival (OS) for low, medium or high expression of (O) NR3C2 or (P) NR3C1. Statistical analyses were performed in R (package survival), using a log-rank test. Data information: (A–H, K, L) Each data point represents the mean ± SD of technical replicates because only one biological repetition could be performed with the primary myeloma cells. The solvent condition was set as 100% and the other conditions were recalculated accordingly. Full arrows highlight the effect of the combination of a tenfold lower Dex dose with Spi, while dashed arrows indicate the effect of Spi alone
Fig. 5
Fig. 5
Crosstalk between GR and MR may result from an endogenous interaction that can be modulated with ligands. (A) Principle of the NanoBiT-based dimerization assays. In the GR–MR heterodimerization assay, the Large BiT (LgBiT) and Small BiT (SmBiT) fragments of the NanoLuc® luciferase, which have very low affinity for each other, are coupled to MR (at the N-terminus) or GR (at the C-terminus), respectively, and transfected into HEK293T cells. When the addition of ligand promotes GR–MR heterodimerization, the LgBiT and SmBiT come in close proximity of each other, hereby reconstituting the functional NanoLuc® luciferase. Following substrate addition (furimazine, cell-permeable substrate), the bioluminescent signal can be measured in intact cells. This NanoBiT-based assay was expanded to also measure GR–GR and MR–MR homodimerization. In both cases, LgBiT was coupled to the N-terminus and SmBiT to the C-terminus of both respective receptors. (B, C) HEK293T cells were transfected with LgBiT-MR and GR-SmBiT. 24 h post-transfection, substrate is added and the baseline luminescence is recorded. Thereafter, cells are treated with Dex (10−6 M), Spi (10−5 M), the combination thereof, or solvent control and luminescence is measured continuous during 60 min (1-min intervals) (N = 3). (C) Statistical comparison of the area under the curve of Dex vs Dex-Spi NanoBiT results in panel B (N = 3). (D–G) Two myeloma cell lines, i.e. (D) MM1.S and (F) OPM-2 cells were treated with Dex (10−6 M), Spi (10−5 M), a Dex-Spi combination or solvent control for 30 min. Protein lysates were prepared and subjected to endogenous immunoprecipitation using GR (G5) antibody (both cell lines N = 2). Thereafter, WB analyses were performed to determine co-immunoprecipitation of GR (90–95 kDa) with MR (107 kDa). GAPDH served as loading control for the input fraction. Lane 1 represents the non-specific antibody control. (E, G) In the IP fraction, MR protein levels were quantified relative to GR protein levels by band densitometric analysis using ImageJ. The bar plot displays the ratio of MR/GR in the IP fraction averaged over both biological repetitions (+ / SEM). (H–K) HEK293T cells were transfected with (H) LgBiT-GR and GR-SmBiT, or (J) LgBiT-MR and MR-SmBiT. 24 h post-transfection, substrate is added and the baseline luminescence is recorded. Thereafter, cells are treated with Dex (10−6 M), Spi (10−5 M), the combination thereof, or solvent control and luminescence is measured continuous during 60 min (1-min intervals) (N = 3). (I, K) Statistical comparison of the area under the curve of Dex vs Dex-Spi NanoBiT results in panel H and J (N = 3). Data information: (D, F) One representative image is shown for each co-IP experiment; the other biological replicates are available for consultation in Supplementary Fig. 5
Fig. 6
Fig. 6
c-myc and its target genes are inhibited most by Dex-Spi treatment, while a subset of Dex-Spi downregulated genes may predict prognosis. (A, C) MM1.S cells were treated with Dex (10−6 M), Spi (10−5 M), a Dex-Spi combination or solvent control (EtOH) for 6 h, followed by RNA-seq analysis. (A, C) Volcano plots depicting the padj (log10 scale) in function of the log2FC for all genes with baseMean ≥ 50 for (A) the pairwise comparison Dex-Spi vs EtOH or (C) the interaction term genes (= those for which the response following Dex-Spi treatment is significantly different from combining the separate responses of Dex and Spi). Significantly regulated genes (padj < 0.05) are colored in red (log2FC > 1 in A, log2FC > 0 for C, upregulated) or blue (log2FC < -1 in A, log2FC < 0 for C, downregulated); non-significant genes (padj  > 0.05) in grey. The gene names are displayed for those genes having the largest abs(log2FC) values (top 10 upregulated/downregulated). The dashed lines are set at abs(log2FC) = 1. (B, D) MM1.S and OPM-2 cells were treated with Dex (10−6 M), Spi (10−5 M), a Dex-Spi combination or solvent control (EtOH) for 24 h (both N = 3). Protein lysates were prepared and subjected to WB analyses, hereby assessing the protein levels of (P-Ser2) Pol2 (240 kDa), GR (90–95 kDa), c-myc (57–65 kDa), cyclin D1 (36 kDa), MIP-1α (CCL3, 10 kDa), DDIT4 (35 kDa), IRE1α (110–130 kDa) and BOB-1 (35 kDa). GAPDH (37 kDa) and Tubulin (55 kDa) served as loading controls. (E, G) Venn diagram of three pairwise comparisons, split up in genes that were either (E) upregulated or (G) downregulated. In addition, the normalized gene expression profiles of the genes that are uniquely regulated by Dex-Spi are shown. (F, H, I) Gene set enrichment analysis (GSEA) of single hallmarks, i.e. (F) a GR activity signature and (H, I) two sets of cyc target genes (V1, V2), for each pairwise comparison, along with the respective normalized enrichment score (NES) and padj. (J) Kaplan–Meier curve of the MMRF patient cohort (N = 750), depicting the survival probability in function of progression-free survival (PFS) for low or high expression of genes that were uniquely downregulated by the Dex-Spi combination. Statistical analyses were performed in R (package survival), using a log-rank test. (K) Prognostic factor analysis of the genes uniquely downregulated Dex-Spi (red solid curve) versus random signatures (red dotted curve). Prognostic power as determined by SigCheck (R package) of the genes uniquely downregulated by Dex-Spi (red dotted line) with 1000 random gene-sets of the same size (P value < 0.05 is indicated by the red dotted line) for the PFS parameter in the CoMMpass cohort. Data information: (B, D) One representative image is shown for each WB experiment, with the number of biological replicates mentioned in each panel description
Fig. 7
Fig. 7
Several metabolic pathways are deregulated most by the Dex-Spi combination treatment. (A) MM1.S cells were treated with Dex (10−6 M), Spi (10−5 M), a Dex-Spi combination or solvent control (EtOH) for 24 h, followed by mass spectrometry-based shotgun proteomics. Venn diagram of pairwise comparisons in which significantly regulated proteins (− log(padj) ≥ 1.3) with an abs(log(LFQ difference)) > 1 were considered. (B) Volcano plot depicting the padj (log10 scale) in function of the log(LFQ) in the pairwise comparison Dex-Spi vs EtOH. Significantly regulated proteins − log(padj) ≥ 1.3 are colored in red (log(LFQ) > 1, upregulated) or blue (log(LFQ) <  − 1, downregulated); non-significant genes (− log(padj) < 1.3) in grey. (C) GSEA-based overrepresentation analysis for the proteins regulated by Dex-Spi, hereby identifying hallmarks that are significantly (red) or non-significantly (grey) enriched. (D–G) GSEA of single hallmarks, i.e. (D) oxidative phosphorylation, (E) fatty acid metabolism, (F) cholesterol homeostasis or (G) E2F targets, for each pairwise comparison, along with the respective normalized enrichment score (NES) and padj. (H-I) Kaplan–Meier curves of the MMRF patient cohort (N = 750), depicting the survival probability in function of progression-free survival (PFS) for low or high expression of proteins that were uniquely (H) downregulated or (I) upregulated by the Dex and Spi combination. Statistical analyses were performed in R (package survival), using a log-rank test. (J) Several lines of evidence support a crosstalk between GR and MR in MM: A) GCs induce a GR-dependent MR downregulation; B) GR and MR engage in a direct, physiologically relevant endogenous interaction that can be modulated by ligands. Spi was shown to reduce the Dex-induced GR-MR heterodimer levels and abolished Dex-induced MR–MR homodimers. Spi did not impact Dex-induced GR-GR homodimerization; C) Dex and Spi combination gives rise to a differential gene and protein expression profile, in which the inhibition of c-myc and its target genes, and several metabolic pathways are modulated most pronounced by Dex-Spi, respectively. A specific subset of targets may even have prognostic significance; D) MR inhibition enhances GC-induced cell killing in MM cell lines depending on their GC responsiveness and in primary (heterogeneous) MM cells depending on the disease stage

Similar articles

Cited by

References

    1. Rajkumar SV. Multiple myeloma: 2022 update on diagnosis, risk stratification, and management. Am J Hematol. 2022;97:1086–1107. doi: 10.1002/ajh.26590. - DOI - PMC - PubMed
    1. Burwick N, Sharma S. Glucocorticoids in multiple myeloma: past, present, and future. Ann Hematol. 2019;98:19–28. doi: 10.1007/s00277-018-3465-8. - DOI - PubMed
    1. Clarisse D, Offner F, De Bosscher K. Latest perspectives on glucocorticoid-induced apoptosis and resistance in lymphoid malignancies. Biochim Biophys Acta Rev Cancer. 2020;1874:188430. doi: 10.1016/j.bbcan.2020.188430. - DOI - PubMed
    1. Weikum ER, Liu X, Ortlund EA. The nuclear receptor superfamily: a structural perspective. Protein Sci. 2018;27:1876–1892. doi: 10.1002/pro.3496. - DOI - PMC - PubMed
    1. Moessmer P, Suren T, Majdic U, et al. Active unfolding of the glucocorticoid receptor by the Hsp70/Hsp40 chaperone system in single-molecule mechanical experiments. Proc Natl Acad Sci USA. 2022;119:e2119076119. doi: 10.1073/pnas.2119076119. - DOI - PMC - PubMed

MeSH terms