. 2023 Oct 2;155(10):e202313375.
doi: 10.1085/jgp.202313375. Epub 2023 Aug 14.

Epilepsy-associated SCN2A (NaV1.2) variants exhibit diverse and complex functional properties

Affiliations

Epilepsy-associated SCN2A (NaV1.2) variants exhibit diverse and complex functional properties

Christopher H Thompson et al. J Gen Physiol. .

Abstract

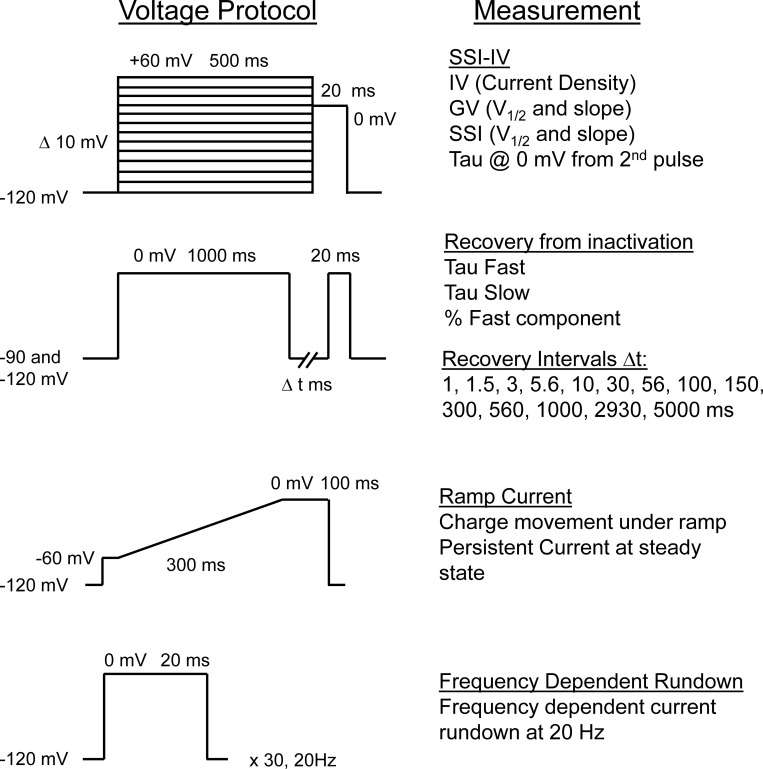
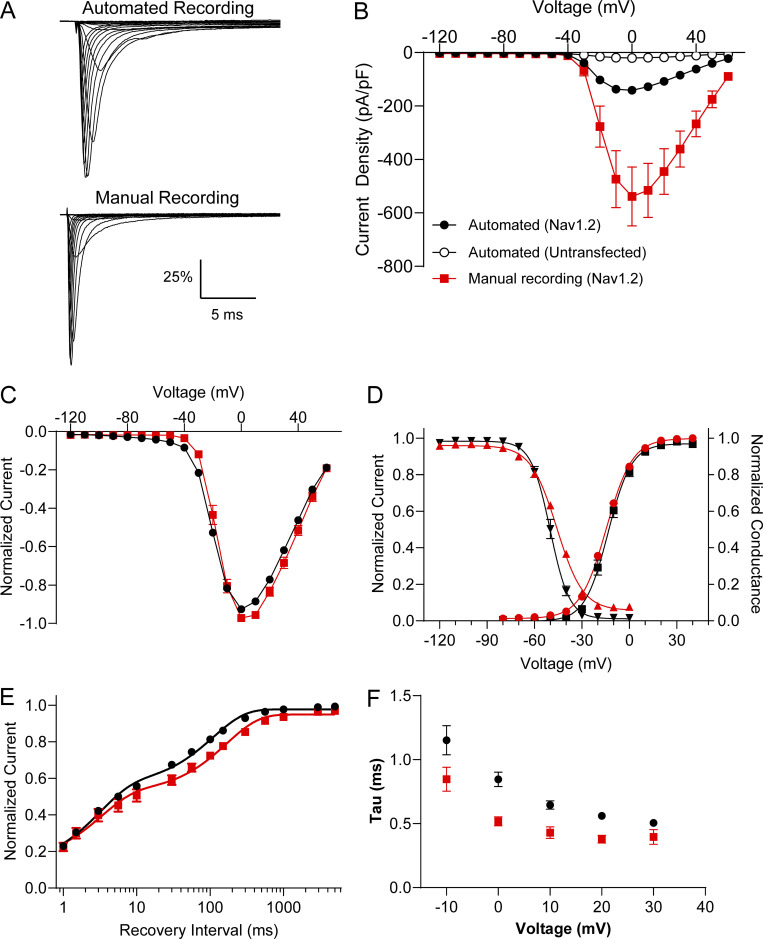
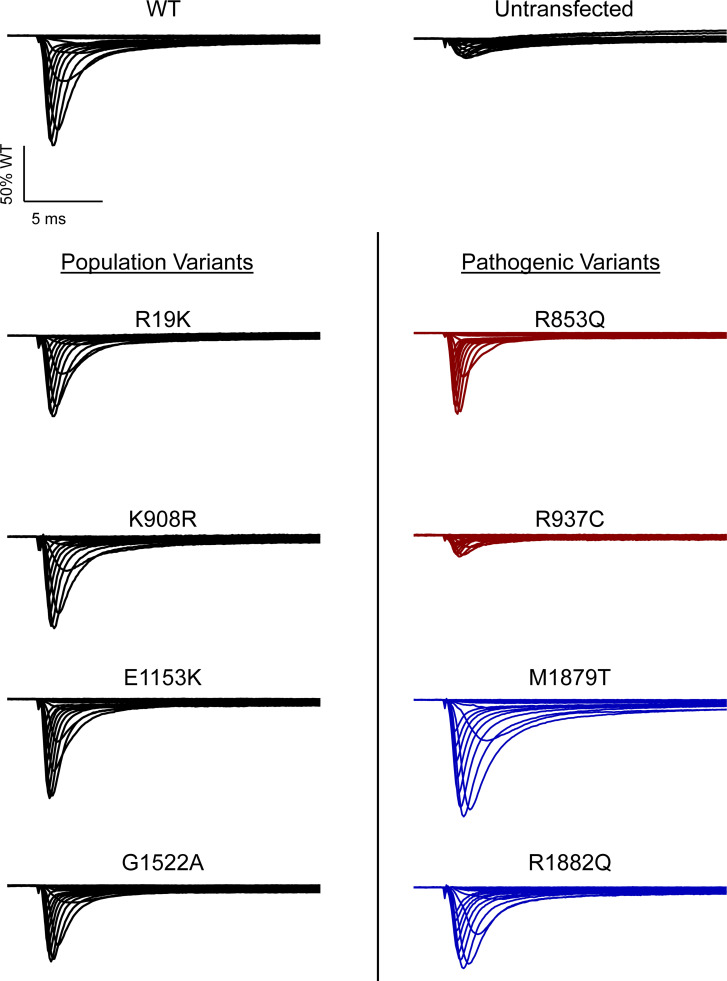
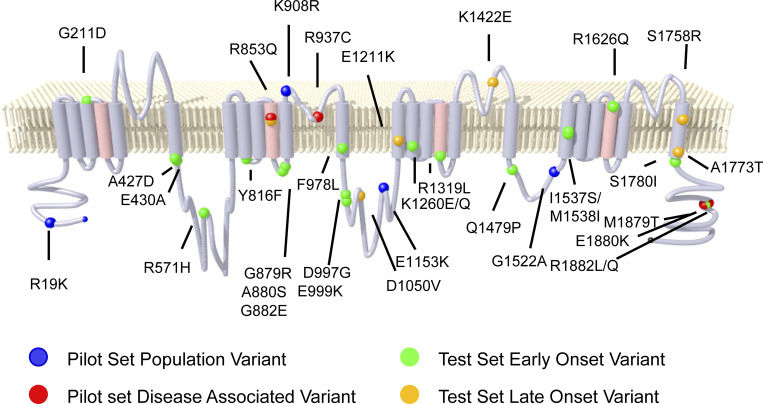
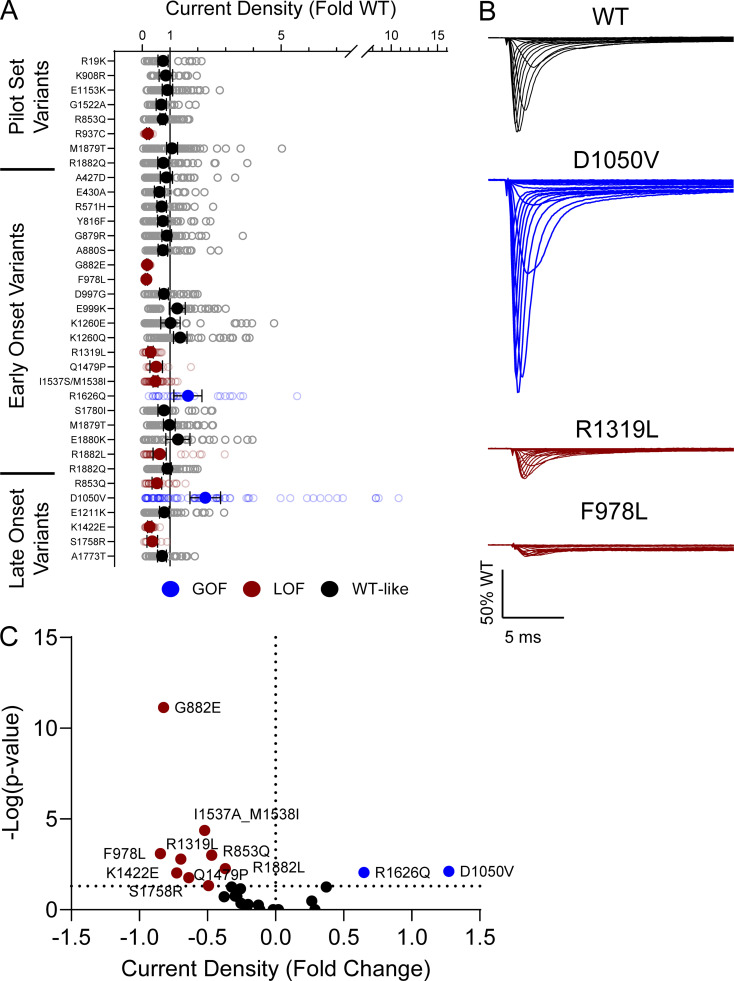
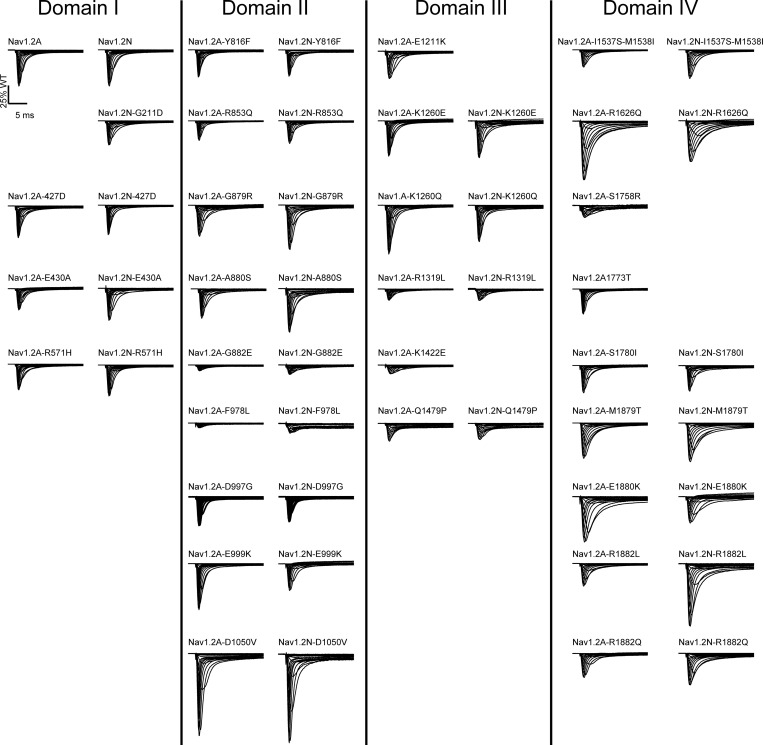
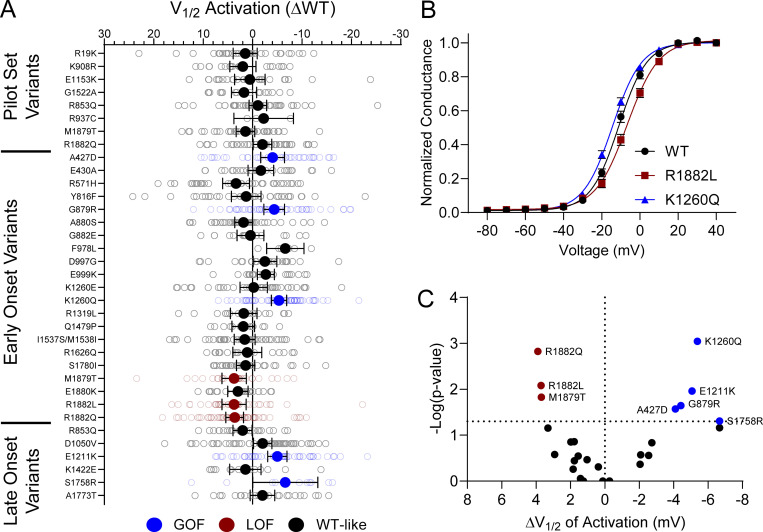
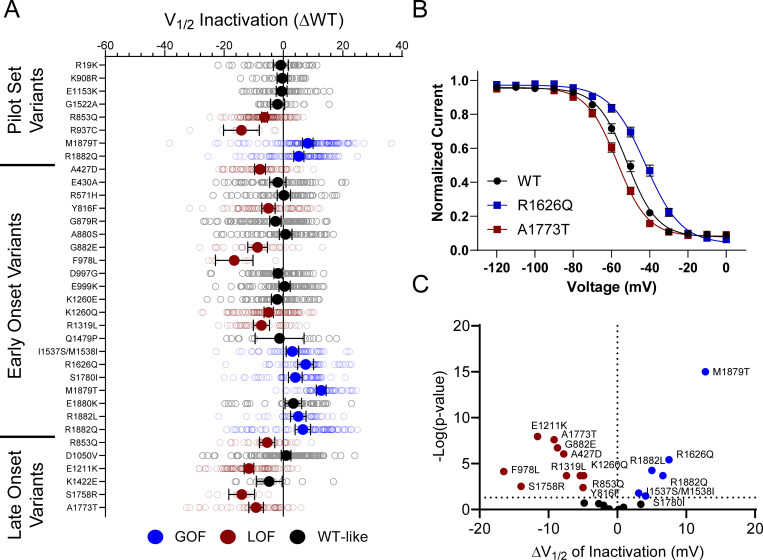
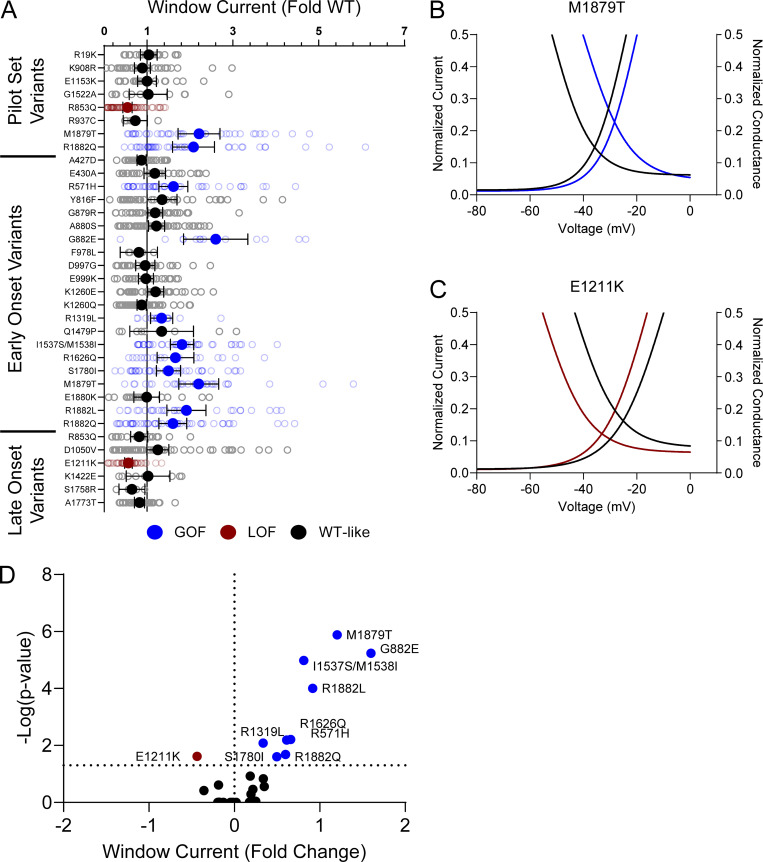
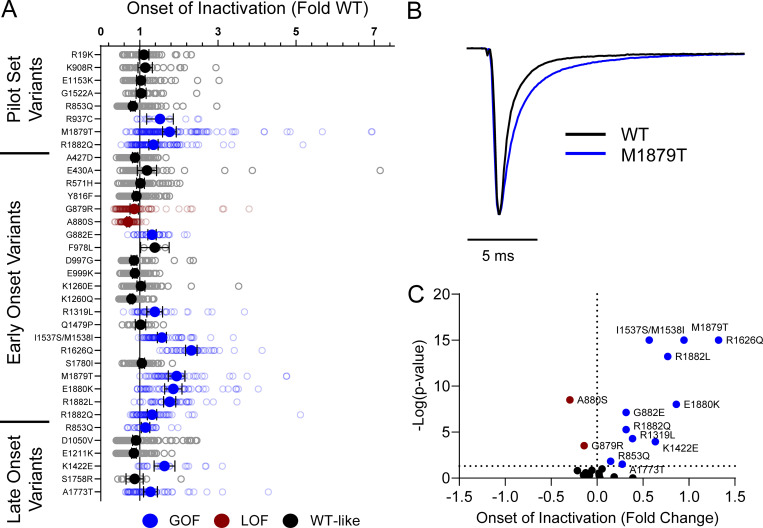
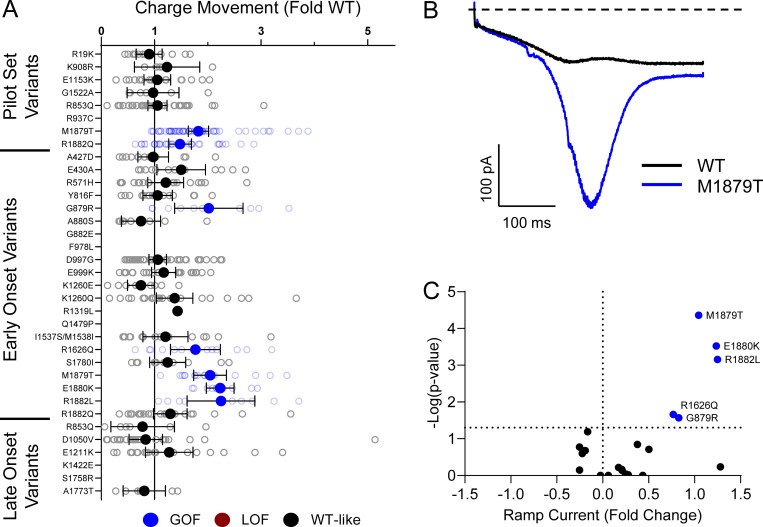
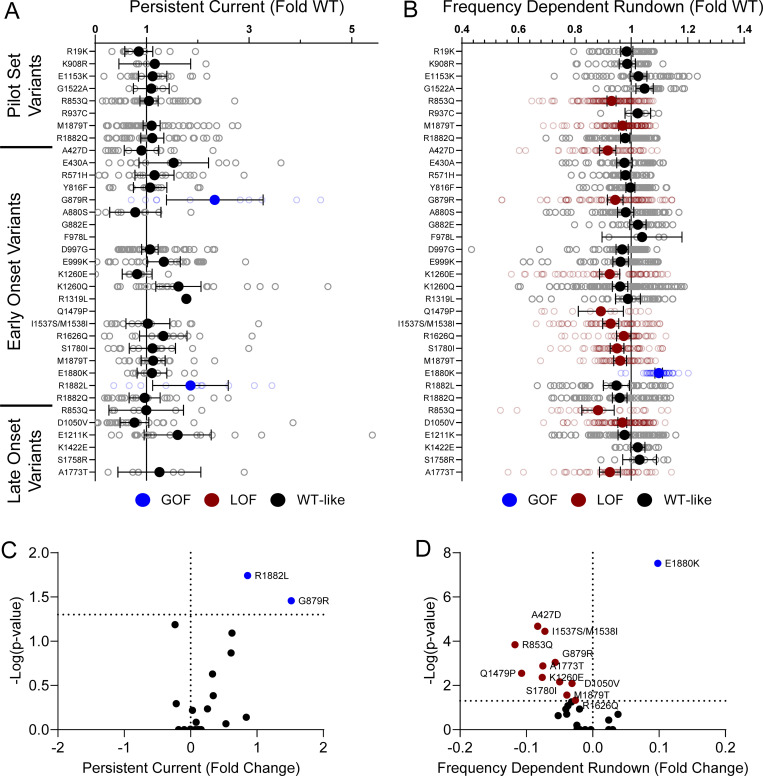
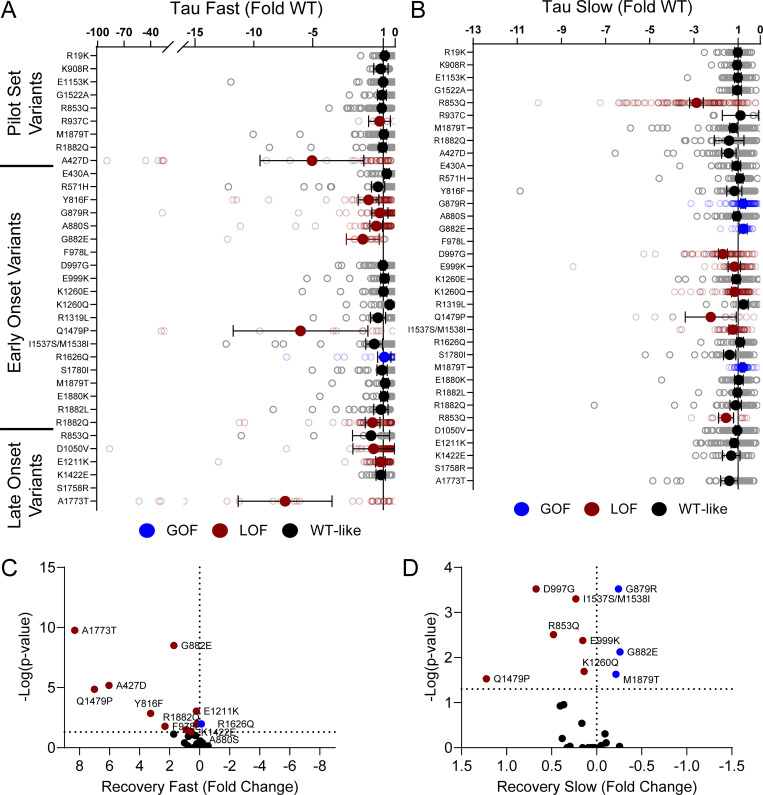
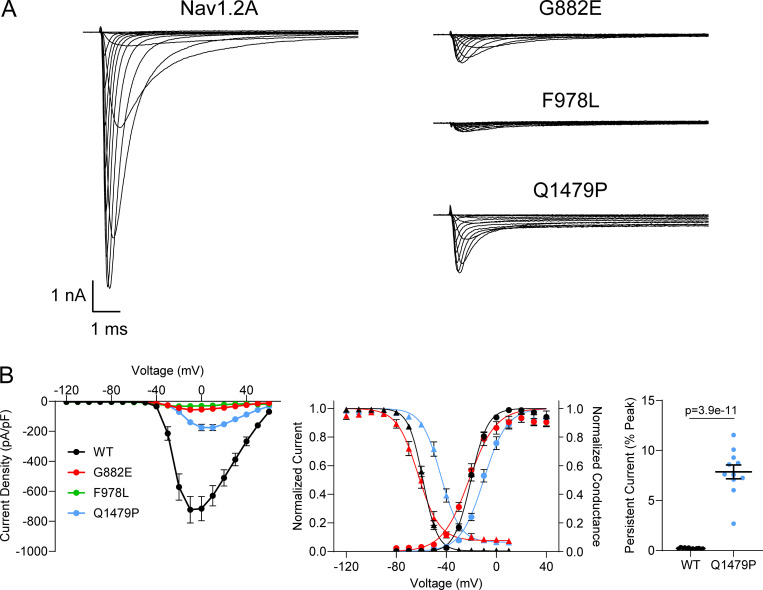
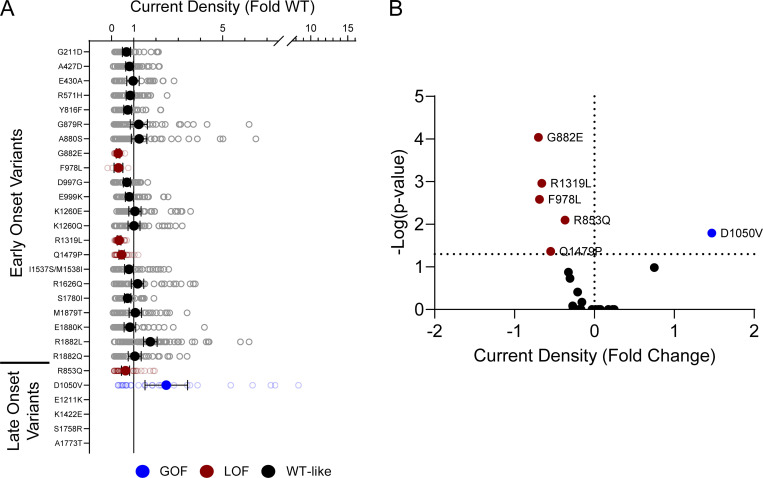
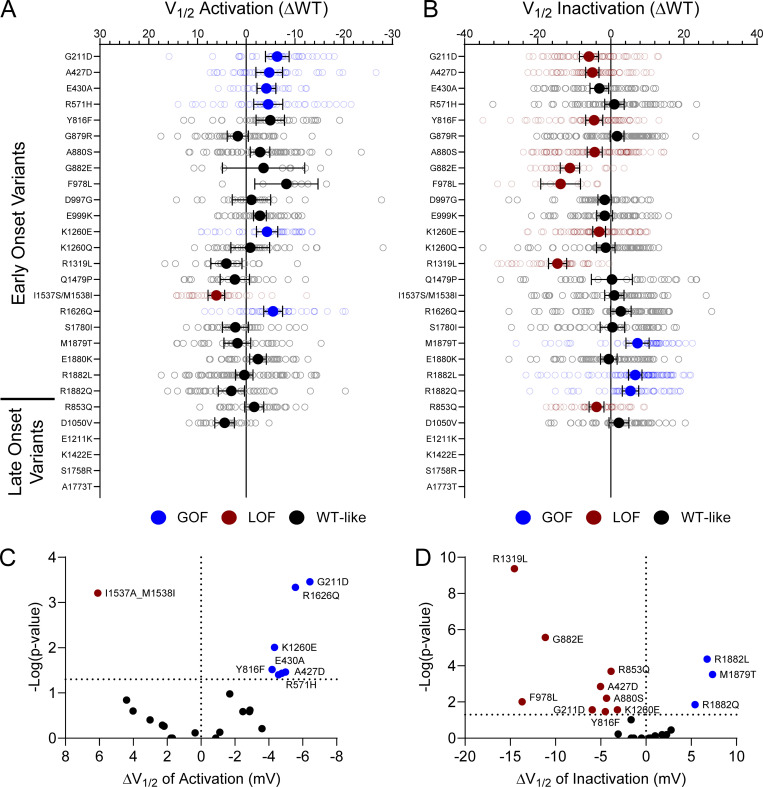
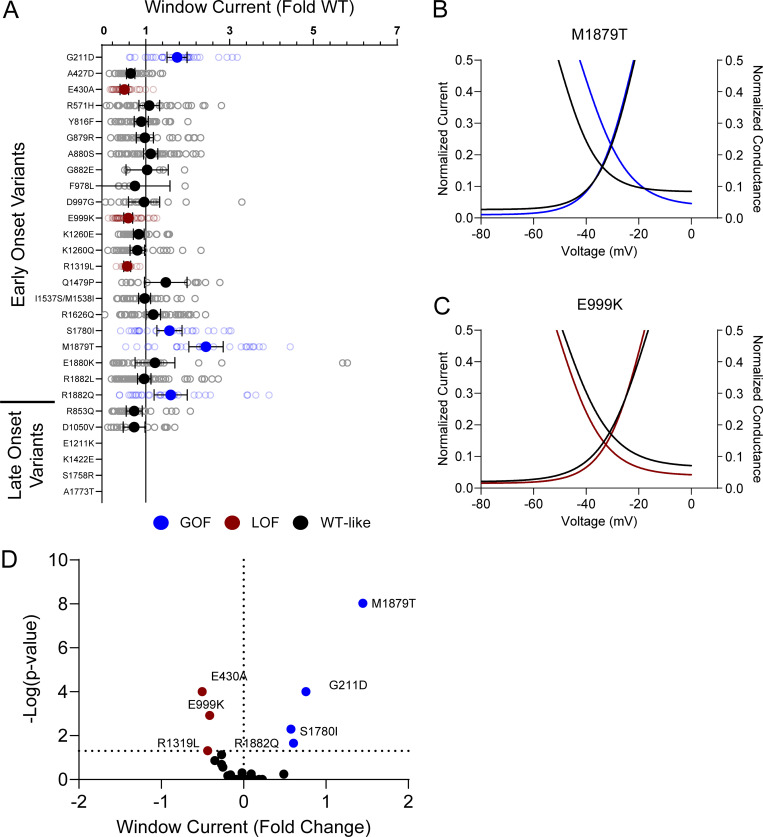
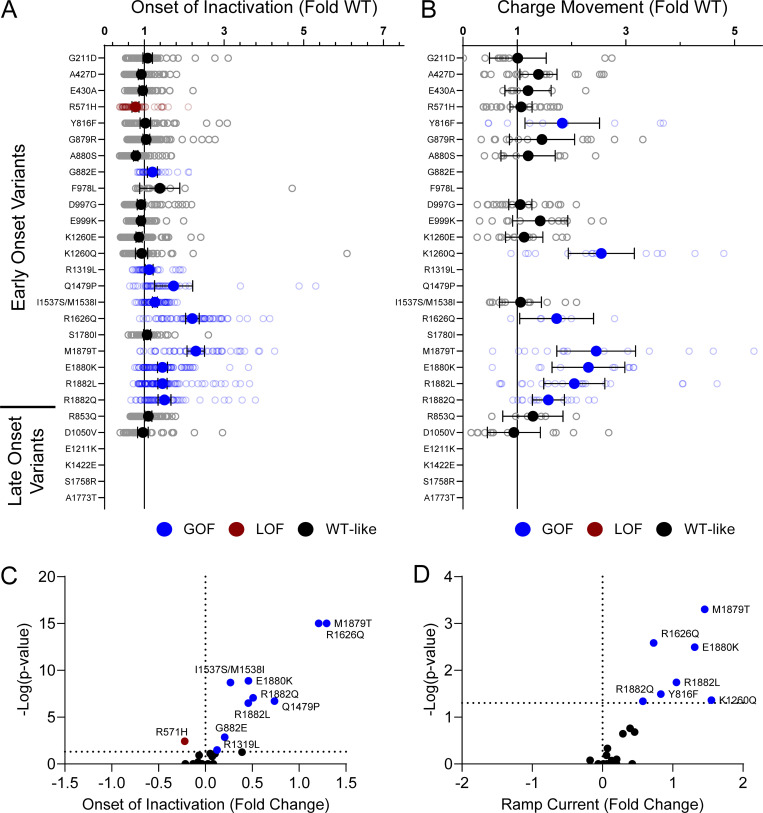
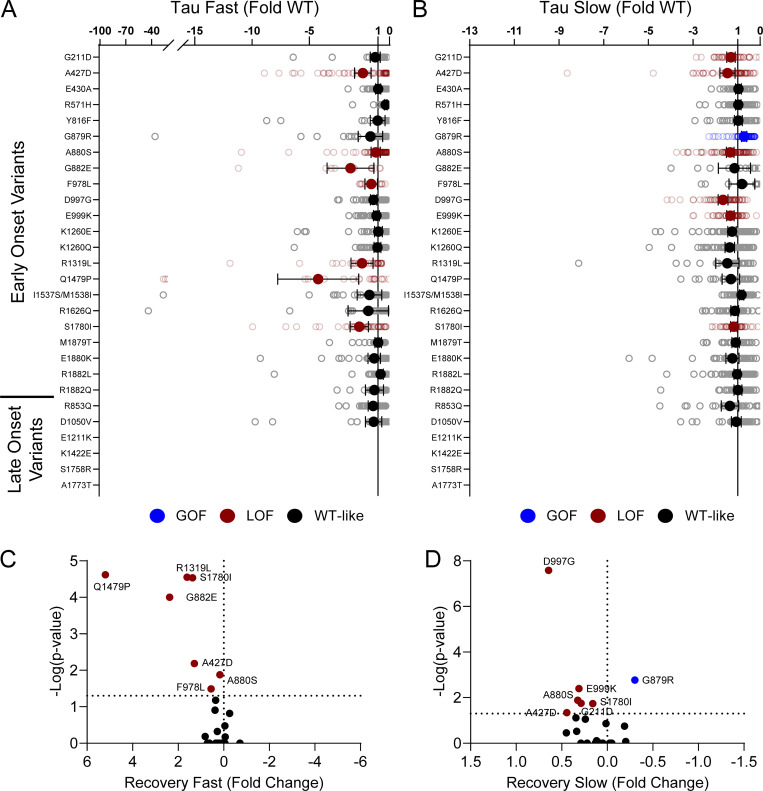
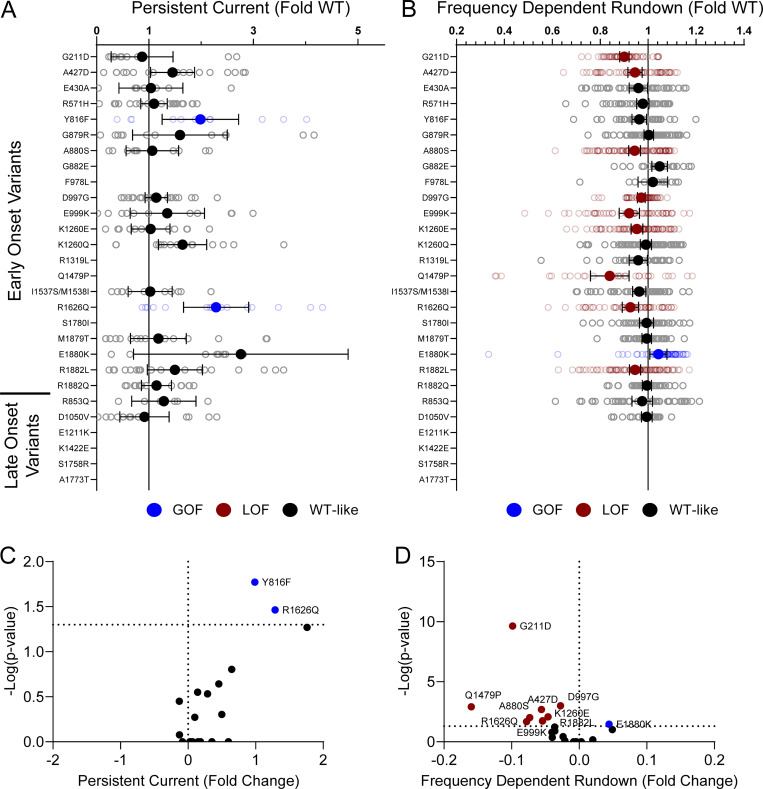
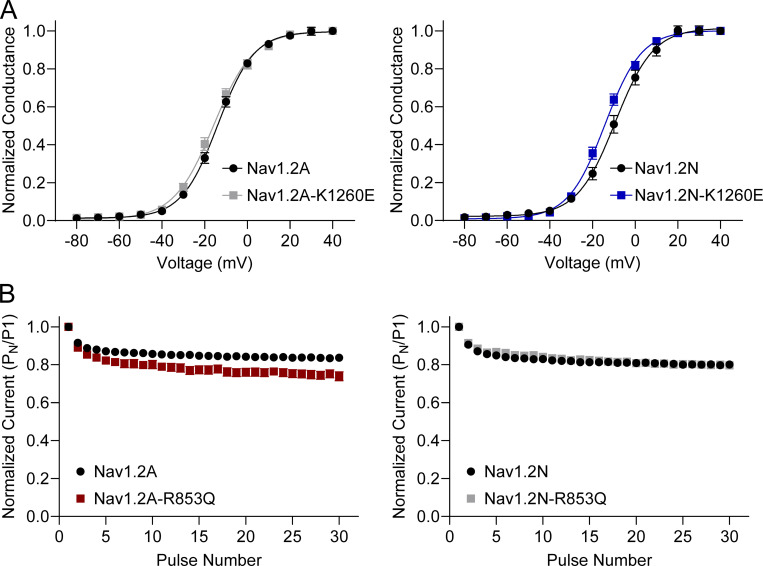
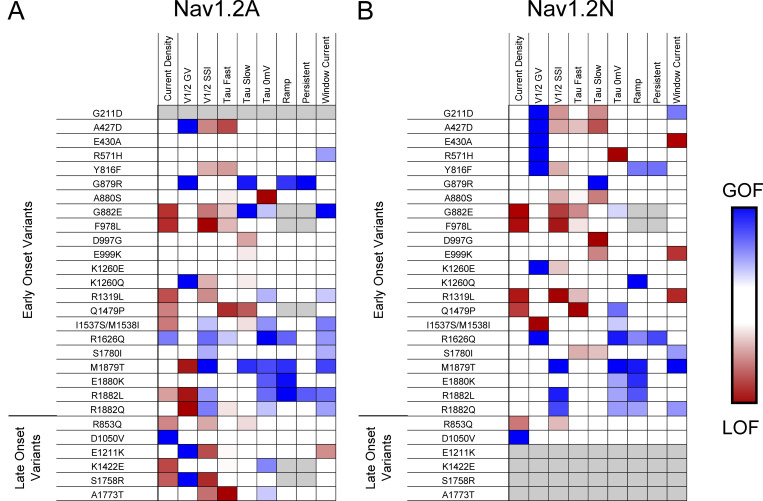
Pathogenic variants in voltage-gated sodium (NaV) channel genes including SCN2A, encoding NaV1.2, are discovered frequently in neurodevelopmental disorders with or without epilepsy. SCN2A is also a high-confidence risk gene for autism spectrum disorder (ASD) and nonsyndromic intellectual disability (ID). Previous work to determine the functional consequences of SCN2A variants yielded a paradigm in which predominantly gain-of-function variants cause neonatal-onset epilepsy, whereas loss-of-function variants are associated with ASD and ID. However, this framework was derived from a limited number of studies conducted under heterogeneous experimental conditions, whereas most disease-associated SCN2A variants have not been functionally annotated. We determined the functional properties of SCN2A variants using automated patch-clamp recording to demonstrate the validity of this method and to examine whether a binary classification of variant dysfunction is evident in a larger cohort studied under uniform conditions. We studied 28 disease-associated variants and 4 common variants using two alternatively spliced isoforms of NaV1.2 expressed in HEK293T cells. Automated patch-clamp recording provided a valid high throughput method to ascertain detailed functional properties of NaV1.2 variants with concordant findings for variants that were previously studied using manual patch clamp. Many epilepsy-associated variants in our study exhibited complex patterns of gain- and loss-of-functions that are difficult to classify by a simple binary scheme. The higher throughput achievable with automated patch clamp enables study of variants with greater standardization of recording conditions, freedom from operator bias, and enhanced experimental rigor. This approach offers an enhanced ability to discern relationships between channel dysfunction and neurodevelopmental disorders.


Conflict of interest statement

Disclosures: J.J. Millichap reported personal fees from Xenon, Praxis, and Biohaven outside the submitted work. A.L. George, Jr. reported grants from Praxis Precision Medicines and Neurocrine Biosciences during the conduct of the study. No other disclosures were reported.

Figures

Figure S1.
Figure S1.
Voltage protocols used to assess voltage-gated sodium channel biophysical parameters by both automated and manual electrophysiology.
Figure S2.
Figure S2.
Comparison of automated and manual patch-clamp evaluation of NaV1.2. (A) Average normalized whole-cell sodium currents from automated (top) and manual (bottom) patch-clamp recording of cells expressing WT NaV1.2A. (B) Summary of current–voltage relationships for automated recording of untransfected cells (open circles), automated recording of cell expressing NaV1.2A (black circles), and manual recording of cells expressing NaV1.2A (red squares). (C) Normalized whole-cell sodium currents comparing automated (black circles) and manual (red squares) recording methods. (D) Voltage-dependence of activation and inactivation of NaV1.2A comparing automated (black) and manual (red) recording methods. (E) Recovery from inactivation of NaV1.2A comparing automated (black circles) and manual (red squares) recording methods. (F) Time constant for the onset of inactivation of NaV1.2A as a function of membrane potential for automated (black circles) and manual (red squares) recording methods. All data are expressed as mean ± SEM from 14 to 1,253 cells. Error bars for automated patch recording data are obscured by symbols.
Figure 1.
Figure 1.
Functional validation of a training set of NaV1.2 variants. (A–C) Averaged whole-cell sodium current traces (not corrected for cell capacitance) of (A) WT NaV1.2A (left) untransfected cells (right), (B) a set of population variants, and (C) known pathogenic variants representing LOF (red) and GOF (blue) phenotypes. Traces were normalized to the average peak WT current amplitude. Average traces are from 5 to 65 cells.
Figure S3.
Figure S3.
Location of NaV1.2 variants. Topology diagram of NaV1.2 showing population (blue spheres), known pathogenic (red spheres), early-onset (green spheres), and late-onset (orange spheres) epilepsy associated variants.
Figure 2.
Figure 2.
NaV1.2 variants alter whole-cell current density. (A) Average deviation of whole-cell sodium current density from WT NaV1.2A for population and disease-associated variants. Data are plotted as mean ± 95% CI. (B) Averaged whole-cell sodium current traces (not corrected for cell capacitance) for WT NaV1.2A, a GOF variant, D1050V, and two LOF variants, R1319L and F978L. Traces were normalized to the average peak WT current amplitude. (C) Volcano plot highlighting variants significantly different from WT. Red symbols denote variants classified as LoF and blue symbols denote variants classified as GoF based on current density significantly different from WT channels (n = 5–77). Data were collected from two to four separate 384-well automated patch clamp experiments, and statistical comparisons were performed using a Kruskal–Wallis test followed by Dunn’s post-hoc test for multiple comparisons. Exact P values are presented in Tables S3 and S4.
Figure S4.
Figure S4.
Average normalized whole-cell currents of NaV1.2 variants. Averaged whole-cell sodium currents (not corrected for cell capacitance) of NaV1.2 variants organized by domain. Currents from the adult and neonatal splice isoforms of each variant are shown side-by-side. All average traces were from 5 to 77 cells.
Figure 3.
Figure 3.
NaV1.2 variants alter voltage-dependence of activation. (A) Average deviation from WT NaV1.2A for V½ of activation (in mV). Data are plotted as mean ± 95% CI. (B) GV curves showing a GoF (K1260Q) and a LoF (R1882L) variant. Data are plotted as mean ± SEM. (C) Volcano plot highlighting variants significantly different from WT. Red symbols denote LoF and blue symbols denote GoF variants classified based on activation voltage dependence significantly different from WT channels (n = 5–58). Data were collected from two to four separate 384-well automated patch clamp experiments, and statistical comparisons were performed using a Kruskal–Wallis test followed by Dunn’s post-hoc test for multiple comparisons. Exact P values are presented in Tables S3 and S4.
Figure 4.
Figure 4.
NaV1.2 variants alter voltage dependence of inactivation. (A) Average deviation from WT NaV1.2A for V½ of inactivation (in mV). Data are plotted as mean ± 95% CI. (B) Steady-state inactivation curves showing a GoF (R1626Q) and a LoF (A1773T) variant. Data are plotted as mean ± SEM. (C) Volcano plot highlighting variants significantly different from WT. Red symbols denote LoF and blue symbols denote GoF variants classified based upon inactivation voltage-dependent significantly different from WT channels (n = 8–122). Data were collected from two to four separate 384-well automated patch clamp experiments, and statistical comparisons were performed using a Kruskal–Wallis test followed by Dunn’s post-hoc test for multiple comparisons. Exact P values are presented in Tables S3 and S4.
Figure S5.
Figure S5.
NaV1.2 variants affect window current. (A) Average deviation from WT NaV1.2A for the window current area. Boltzmann fit lines of representative variants showing. Data are plotted as mean ± 95% CI. (B and C) GoF; M1879T (B) or LoF; E1211K (C) window current respective to WT. (D) Volcano plot highlighting variants significantly different from WT. Red symbols and lines denote LoF and blue symbols and lines denote GoF with P < 0.05 (n = 5–57). Data were collected from two to four separate 384-well automated patch clamp experiments, and statistical comparisons were performed using a Kruskal–Wallis test followed by Dunn’s post-hoc test for multiple comparisons. Exact P values are presented in Tables S3 and S4.
Figure 5.
Figure 5.
NaV1.2 variants alter inactivation time constants. (A) Average deviation of inactivation time constant (τ) measured at 0 mV from WT NaV1.2A for disease-associated variants. Data are plotted as mean ± 95% CI. (B) Average traces for WT NaV1.2A and a GoF variant M1879T recorded at 0 mV. (C) Volcano plot highlighting variants significantly different from WT. Red symbols denote LoF and blue symbols denote GoF variants classified based upon inactivation kinetics significantly different from WT channels (n = 9–120). Data were collected from two to four separate 384-well automated patch clamp experiments, and statistical comparisons were performed using a Kruskal–Wallis test followed by Dunn’s post-hoc test for multiple comparisons. Exact P values are presented in Tables S3 and S4.
Figure 6.
Figure 6.
NaV1.2 variants alter inactivation ramp currents. (A) Average deviation of ramp currents from WT NaV1.2A for disease-associated variants. Data are plotted as mean ± 95% CI. (B) Average traces for WT NaV1.2A and a GOF variant, M1879T. (C) Volcano plot highlighting variants significantly different from WT. Red symbols denote LoF and blue symbols denote GoF variants classified based upon ramp currents significantly different from WT channels (n = 5–45). Data were collected from two to four separate 384-well automated patch clamp experiments, and statistical comparisons were performed using a Kruskal–Wallis test followed by Dunn’s post-hoc test for multiple comparisons. Exact P values are presented in Tables S3 and S4.
Figure S6.
Figure S6.
NaV1.2 variants affect channel inactivation. (A and B) Average deviation from WT NaV1.2A for (A) persistent current and (B) frequency-dependent channel rundown at 20 Hz. Data are plotted as mean ± 95% CI. (C and D) Volcano plots highlighting variants significantly different from WT for (C) persistent current and (D) frequency-dependent rundown. Red symbols denote LoF and blue symbols denote GoF with P < 0.05 (n = 5–103). Data were collected from two to four separate 384-well automated patch clamp experiments, and statistical comparisons were performed using a Kruskal–Wallis test followed by Dunn’s post-hoc test for multiple comparisons. Exact P values are presented in Tables S3 and S4.
Figure S7.
Figure S7.
NaV1.2 variants affect recovery from inactivation. (A and B) Average deviation from WT NaV1.2A for the (A) fast and (B) slow time constants of recovery from inactivation. (C and D) Volcano plots highlighting variants significantly different from WT for (C) fast and (D) slow time constants of recovery from inactivation. Red symbols denote LoF and blue symbols denote GoF with P < 0.05 (n = 13–97). Data were collected from two to four separate 384-well automated patch clamp experiments, and statistical comparisons were performed using a Kruskal–Wallis test followed by Dunn’s post-hoc test for multiple comparisons. Exact P values are presented in Tables S3 and S4.
Figure 7.
Figure 7.
Validation of difficult-to-record NaV1.2 variants using manual patch clamp. (A) Average whole-cell current traces of WT and three difficult-to-characterize variants (G882E, F978L, and Q1479P) recorded using manual patch clamp. (B) Summary current–voltage relationship (left), voltage dependence of activation and inactivation (middle), and persistent current (right) of NaV1.2A variants recorded using manual patch clamp. All data were from 9 to 19 cells and are plotted as mean ± SEM. Data were collected from three individual transfections, and statistical analyses were performed using Student’s t test.
Figure S8.
Figure S8.
Disease-associated variants affect neonatal NaV1.2 whole-cell currents. (A) Average deviation of whole-cell sodium current density from neonatal WT NaV1.2N for epilepsy-associated variants. Data are plotted as mean ± 95% CI. (B) Volcano plot highlighting variants significantly different from WT. Red symbols denote LoF and blue symbols denote GoF with P < 0.05 (n = 9–76). Data were collected from two to four separate 384-well automated patch clamp experiments, and statistical comparisons were performed using a Kruskal–Wallis test followed by Dunn’s post-hoc test for multiple comparisons. Exact P values are presented in Table S5.
Figure S9.
Figure S9.
Disease-associated variants affect neonatal NaV1.2 voltage-dependence of activation and inactivation. (A and B) Average deviation from neonatal WT NaV1.2N for V1/2 of (A) activation and (B) steady-state inactivation (in mV). Data are plotted as mean ± 95% CI. (C and D) Volcano plots highlighting variants significantly different from WT for voltage dependence of (C) activation and (D) inactivation. Red symbols denote LoF and blue symbols denote GoF with P < 0.05 (n = 7–95). Data were collected from two to four separate 384-well automated patch clamp experiments, and statistical comparisons were performed using a Kruskal–Wallis test followed by Dunn’s post-hoc test for multiple comparisons. Exact P values are presented in Table S5.
Figure S10.
Figure S10.
Disease-associated variants affect neonatal NaV1.2 affect window current. (A) Average deviation from WT NaV1.2N for the window current area. Data are plotted as mean ± 95% CI. (B and C) Boltzmann fit lines of representative variants showing (B) GoF; M1879T or (C) LoF; E999K window current respective to WT. (D) Volcano plot highlighting variants significantly different from WT. Red symbols and lines denote LoF and blue symbols and lines denote GoF with P < 0.05 (n = 5–59). Data were collected from two to four separate 384-well automated patch clamp experiments, and statistical comparisons were performed using a Kruskal–Wallis test followed by Dunn’s post-hoc test for multiple comparisons. Exact P values are presented in Table S5.
Figure S11.
Figure S11.
Disease-associated variants affect neonatal NaV1.2 affect inactivation time constants and ramp currents. (A and B) Average deviation of (A) inactivation time constant (τ) and (B) ramp currents from neonatal WT NaV1.2N for epilepsy associated variants. Data are plotted as mean ± 95% CI. Red symbols denote LoF and blue symbols denote GoF with P < 0.05 (n = 6–101). Data were collected from two to four separate 384-well automated patch clamp experiments, and statistical comparisons were performed using a Kruskal–Wallis test followed by Dunn’s post-hoc test for multiple comparisons. Exact P values are presented in Table S5.
Figure S12.
Figure S12.
Disease-associated variants affect neonatal NaV1.2 affect recovery from inactivation. (A and B) Average deviation from neonatal WT NaV1.2N for the (A) fast and (B) slow time constants of recovery from inactivation. Data are plotted as mean ± 95% CI. (C and D) Volcano plots highlighting variants significantly different from WT for (C) fast and (D) slow time constants of recovery from inactivation. Red symbols denote LoF and blue symbols denote GoF with P < 0.05 (n = 12–84). Data were collected from two to four separate 384-well automated patch clamp experiments, and statistical comparisons were performed using a Kruskal–Wallis test followed by Dunn’s post-hoc test for multiple comparisons. Exact P values are presented in Table S5.
Figure S13.
Figure S13.
Disease-associated variants affect neonatal NaV1.2 affect persistent current and frequency-dependent channel rundown. (A and B) Average deviation from neonatal WT NaV1.2N for (A) persistent sodium current and (B) frequency-dependent channel rundown at 20 Hz. Data are plotted as mean ± 95% CI. (C and D) Volcano plots highlighting variants significantly different from WT for (C) persistent current and (D) frequency-dependent rundown. Red symbols denote LoF and blue symbols denote GoF with P < 0.05 (n = 6–88). Data were collected from two to four separate 384-well automated patch clamp experiments, and statistical comparisons were performed using a Kruskal–Wallis test followed by Dunn’s post-hoc test for multiple comparisons. Exact P values are presented in Table S5.
Figure S14.
Figure S14.
NaV1.2 variants exhibit splice isoform-dependent functional properties. (A) Voltage dependence of activation of adult (left) and neonatal (right) splice isoforms of K1260E. (B) Frequency-dependent channel rundown of adult (left) and neonatal (right) splice isoforms of R853Q. All data are expressed as mean ± SEM of 27–88 cells.
Figure 8.
Figure 8.
Comparison of epilepsy-associated variants in the adult and neonatal isoforms of NaV1.2. (A and B) Heat maps showing GoF (blue) and LoF (red) biophysical properties measured for epilepsy associated NaV1.2 variants in the (A) adult and (B) neonatal splice isoforms. Only properties that reached the threshold for statistical significance are highlighted.

Update of

Comment in

References

    1. Adney, S.K., Millichap J.J., DeKeyser J.M., Abramova T., Thompson C.H., and George A.L. Jr.. 2020. Functional and pharmacological evaluation of a novel SCN2A variant linked to early-onset epilepsy. Ann. Clin. Transl. Neurol. 7:1488–1501. 10.1002/acn3.51105 - DOI - PMC - PubMed
    1. Begemann, A., Acuña M.A., Zweier M., Vincent M., Steindl K., Bachmann-Gagescu R., Hackenberg A., Abela L., Plecko B., Kroell-Seger J., et al. . 2019. Further corroboration of distinct functional features in SCN2A variants causing intellectual disability or epileptic phenotypes. Mol. Med. 25:6. 10.1186/s10020-019-0073-6 - DOI - PMC - PubMed
    1. Ben-Shalom, R., Keeshen C.M., Berrios K.N., An J.Y., Sanders S.J., and Bender K.J.. 2017. Opposing effects on NaV1.2 function underlie differences between SCN2A variants observed in individuals with autism spectrum disorder or infantile seizures. Biol. Psychiatry. 82:224–232. 10.1016/j.biopsych.2017.01.009 - DOI - PMC - PubMed
    1. Ben-Shalom, R., Ladd A., Artherya N.S., Cross C., Kim K.G., Sanghevi H., Korngreen A., Bouchard K.E., and Bender K.J.. 2022. NeuroGPU: Accelerating multi-compartment, biophysically detailed neuron simulations on GPUs. J. Neurosci. Methods. 366:109400. 10.1016/j.jneumeth.2021.109400 - DOI - PMC - PubMed
    1. Berecki, G., Howell K.B., Deerasooriya Y.H., Cilio M.R., Oliva M.K., Kaplan D., Scheffer I.E., Berkovic S.F., and Petrou S.. 2018. Dynamic action potential clamp predicts functional separation in mild familial and severe de novo forms of SCN2A epilepsy. Proc. Natl. Acad. Sci. USA. 115:E5516–E5525. 10.1073/pnas.1800077115 - DOI - PMC - PubMed

Publication types

Substances