. 2023 Aug 14;19(8):e1011461.
doi: 10.1371/journal.ppat.1011461. eCollection 2023 Aug.

Viral burden is associated with age, vaccination, and viral variant in a population-representative study of SARS-CoV-2 that accounts for time-since-infection-related sampling bias

Affiliations

Viral burden is associated with age, vaccination, and viral variant in a population-representative study of SARS-CoV-2 that accounts for time-since-infection-related sampling bias

Helen R Fryer et al. PLoS Pathog. .

Erratum in

Abstract

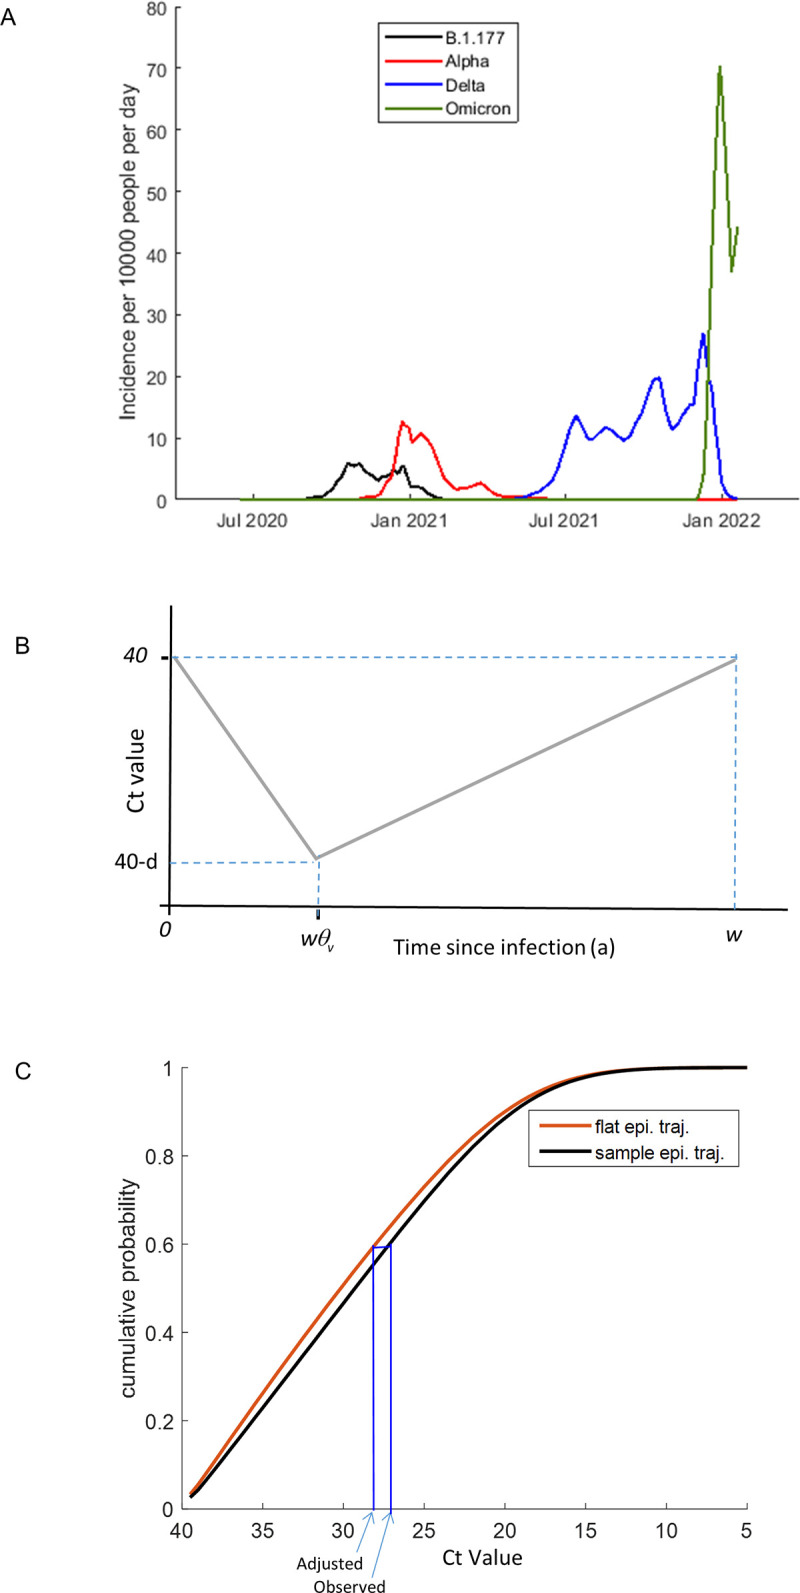
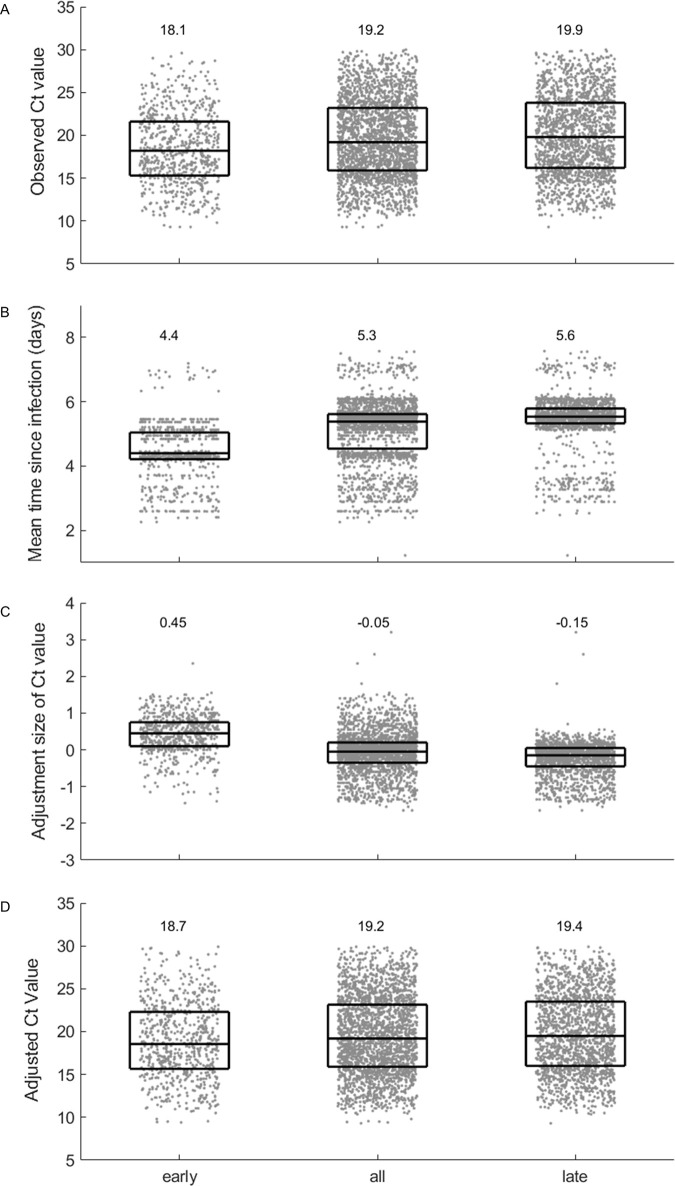
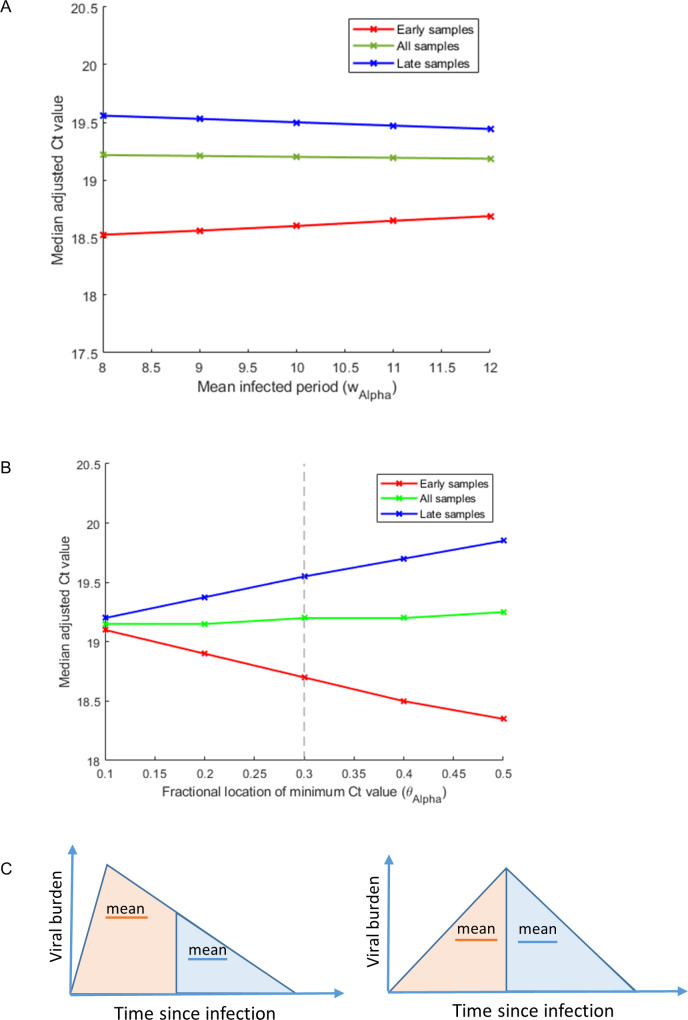
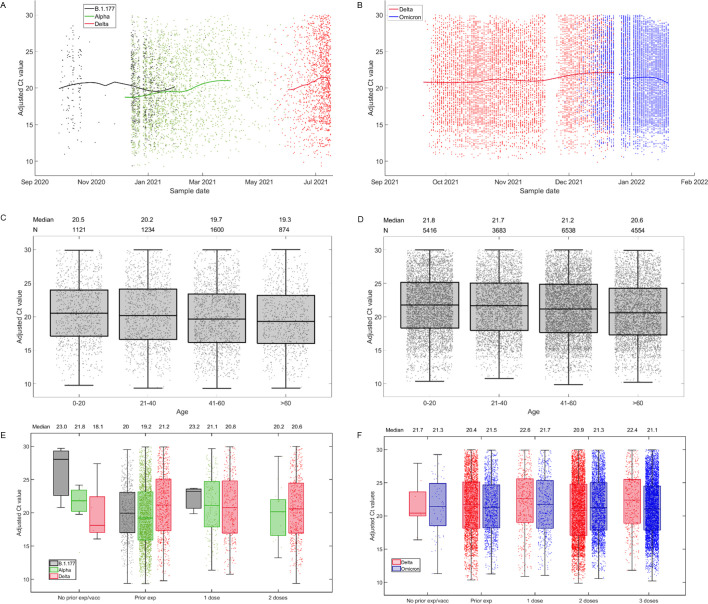
In this study, we evaluated the impact of viral variant, in addition to other variables, on within-host viral burden, by analysing cycle threshold (Ct) values derived from nose and throat swabs, collected as part of the UK COVID-19 Infection Survey. Because viral burden distributions determined from community survey data can be biased due to the impact of variant epidemiology on the time-since-infection of samples, we developed a method to explicitly adjust observed Ct value distributions to account for the expected bias. By analysing the adjusted Ct values using partial least squares regression, we found that among unvaccinated individuals with no known prior exposure, viral burden was 44% lower among Alpha variant infections, compared to those with the predecessor strain, B.1.177. Vaccination reduced viral burden by 67%, and among vaccinated individuals, viral burden was 286% higher among Delta variant, compared to Alpha variant, infections. In addition, viral burden increased by 17% for every 10-year age increment of the infected individual. In summary, within-host viral burden increases with age, is reduced by vaccination, and is influenced by the interplay of vaccination status and viral variant.


Conflict of interest statement

The authors have declared that no competing interests exist.

Figures

Fig 1
Fig 1. A method for estimating epidemiologically adjusted Ct values.
A) Inferred daily incidence with the B.1.177 lineage and the Alpha, Delta and BA.1 Omicron variants between July 2020 and January 2022 in the UK. These were estimated to equal the product of the daily incidence of SARS-CoV-2 and the fraction of incident infections of that variant. B) Within-host Ct trajectories were assumed to be valley shaped, with infected period (width) w, and depth d. The valley trough was estimated to be a fraction θv across the width. C) Adjusted Ct values were inferred by first estimating the cumulative probability distribution of Ct values based upon the sample date and the known epidemiological trajectory of the sample variant and identifying the percentile at which the observed Ct value falls within this distribution. Second, the cumulative probability distribution of Ct values under an assumption of a flat epidemiological trajectory was estimated and the Ct value at the selected percentile was identified.
Fig 2
Fig 2. Epidemiological adjustment results in more closely aligned estimates of mean viral burden from samples taken early and late during the Alpha wave.
Samples that correspond to Alpha-variant infections in individuals who were unvaccinated and had not been identified as having had a prior exposure were split according to sample date. Four metrics were applied to data from the early phase, all phases and the late phase. In each panel, median and interquartile ranges are overlaid onto individual data points (equivalent distribution plots are provided in S2 Fig). A) The observed Ct values are, on average, higher for late phase, compared to early phase samples. B) The estimated mean time since infection is, on average, longer for late-phase, compared to early-phase samples. C) The Ct adjustment size is, on average, positive for early phase samples, negative for late phase samples and negligible when all data are considered. D) On average, the adjusted Ct values relating to the early and late phase are more closely aligned than the observed Ct values. However, adjusted values remain, on average, higher in late-phase, compared to early-phase samples.
Fig 3
Fig 3. The epidemiological stage and the asymmetry of the within-host viral trajectory impact the Ct adjustment size.
In panels A) and B) samples that correspond to Alpha-variant infections in individuals who were unvaccinated and had not been identified as having had a prior exposure are split according to sample date. The medians of the adjusted Ct values are plotted for early samples (red), late samples (blue) and all samples (green) under different assumptions about the asymmetry and the mean width of the within-host viral burden trajectory. In panel A) the infected period is varied under an assumption that the viral burden trajectory is skewed towards the start of infection (θAlpha = 0.3). This shows that Ct values are lower (viral burden is higher) amongst samples taken earlier on during infection, but vary to only a limited degree with changes in the mean infected period (wAlpha). In panel B) the fractional location of the peak viral burden, θAlpha, is varied under the assumption that the mean infected period (with Ct value ≤40) is 10 days (wAlpha = 10) [16]. This shows that the asymmetry of the within-host viral burden trajectory measurably impacts the adjusted Ct values and that the early- and late-phase Alpha-variant samples are most closely aligned when θAlpha is smaller. Panel C) highlights how, when the within-host trajectory is skewed towards earlier during infection, viral burden sampled during early infection will on average be higher than that sampled later on in infection.
Fig 4
Fig 4. Adjusted Ct values plotted against different factors.
For samples sequenced at Oxford (A, C and E) and at Northumbria (d, e and f), adjusted Ct values are plotted against different variabless. Panel A) and B) show a LOESS fit (smoothing parameter = 0.55) of adjusted Ct values over sample date, categorised by variant. Panels C) and D) show box and whisker plots of adjusted Ct values by age category. Panels E) and F) show box and whisker plots of adjusted Ct values by prior vaccination and/or infection, by variant. Horizontal lines represent the median and interquartile range. Parameter values used in these calculations are listed in Table 3.
Fig 5
Fig 5. Sensitivity analysis investigating the impact of the shape of within-host viral trajectory on PLS regression analysis into the impact of variant on Ct values.
Panels A) and C) show Beta scores, which can be considered to be equivalent to regression coefficients, defining the magnitude of the effect of the variant on the adjusted Ct values. Panels B) and D) show VIP values defining the importance of the association–where values greater than 1 are typically considered to indicate importance. Panels A) and B) investigate the association between the variant being B.1.177 (relative to Alpha) and Ct values among unvaccinated individuals with no known prior exposure. The Beta scores and VIP values vary with changes to the assumed asymmetry of the within-host viral burden trajectory associated with the B.1.177 lineage and the Alpha variant. The asymmetry is determined by changes to the fractional location of the minimum Ct value (peak viral burden) for each variant (θB.1.177 and θAlpha, respectively). Data sampled at Oxford. Panels C) and D) investigate the association between the variant being Delta (relative to Alpha) and Ct values among vaccinated individuals and how the Beta scores and VIP values vary with changes to θAlpha and θDelta, respectively. Data from samples sequenced at Oxford.

References

    1. Davies NG, Abbott S, Barnard RC, Jarvis CI, Kucharski AJ, Munday JD, et al.. Estimated transmissibility and impact of SARS-CoV-2 lineage B.1.1.7 in England. Science. 2021;372(6538). Epub 2021/03/05. doi: 10.1126/science.abg3055 ; PubMed Central PMCID: PMC8128288. - DOI - PMC - PubMed
    1. Volz E, Mishra S, Chand M, Barrett JC, Johnson R, Geidelberg L, et al.. Assessing transmissibility of SARS-CoV-2 lineage B.1.1.7 in England. Nature. 2021;593(7858):266–9. Epub 2021/03/27. doi: 10.1038/s41586-021-03470-x . - DOI - PubMed
    1. Lyngse FP, Molbak K, Skov RL, Christiansen LE, Mortensen LH, Albertsen M, et al.. Increased transmissibility of SARS-CoV-2 lineage B.1.1.7 by age and viral load. Nat Commun. 2021;12(1):7251. Epub 2021/12/15. doi: 10.1038/s41467-021-27202-x ; PubMed Central PMCID: PMC8669007. - DOI - PMC - PubMed
    1. Allen H, Vusirikala A, Flannagan J, Twohig KA, Zaidi A, Chudasama D, et al.. Household transmission of COVID-19 cases associated with SARS-CoV-2 delta variant (B.1.617.2): national case-control study. Lancet Reg Health Eur. 2022;12:100252. Epub 2021/11/04. doi: 10.1016/j.lanepe.2021.100252 ; PubMed Central PMCID: PMC8552812. - DOI - PMC - PubMed
    1. Jorgensen SB, Nygard K, Kacelnik O, Telle K. Secondary Attack Rates for Omicron and Delta Variants of SARS-CoV-2 in Norwegian Households. JAMA. 2022;327(16):1610–1. Epub 2022/03/08. doi: 10.1001/jama.2022.3780 ; PubMed Central PMCID: PMC8902690. - DOI - PMC - PubMed

Publication types

Supplementary concepts