. 2023 Aug 14;19(8):e1011263.
doi: 10.1371/journal.ppat.1011263. eCollection 2023 Aug.

A conserved microtubule-binding region in Xanthomonas XopL is indispensable for induced plant cell death reactions

Affiliations

A conserved microtubule-binding region in Xanthomonas XopL is indispensable for induced plant cell death reactions

Simon Ortmann et al. PLoS Pathog. .

Abstract

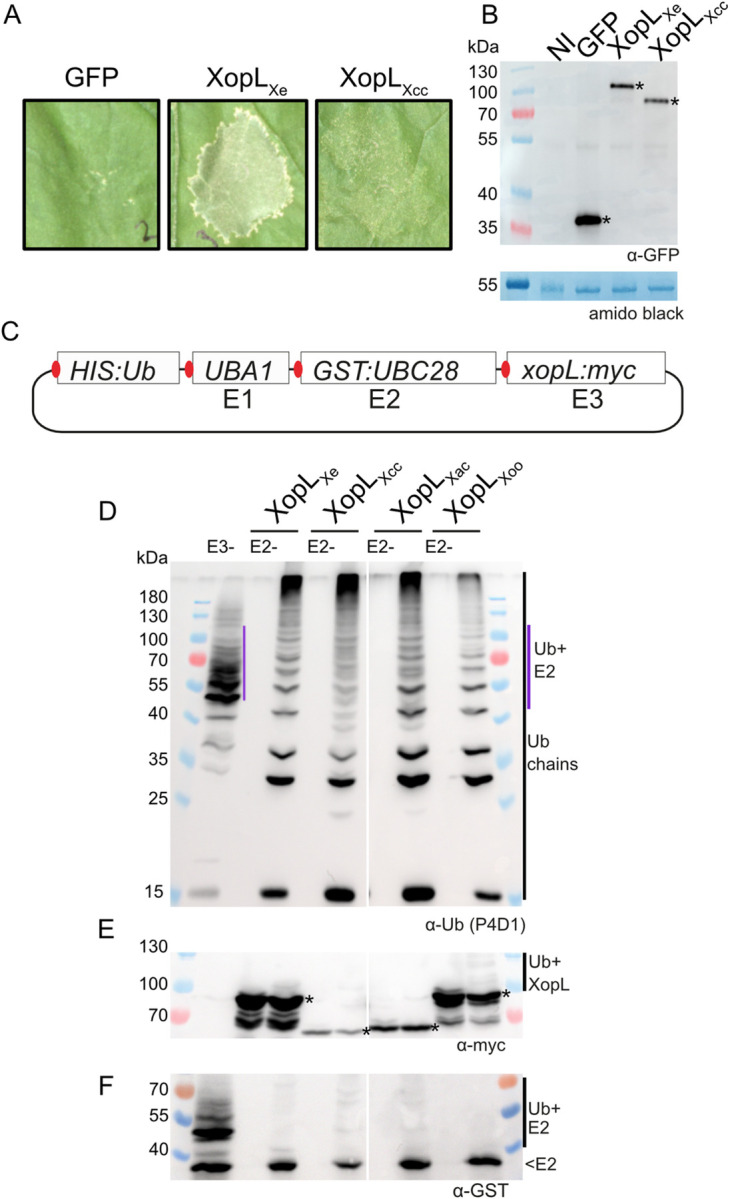
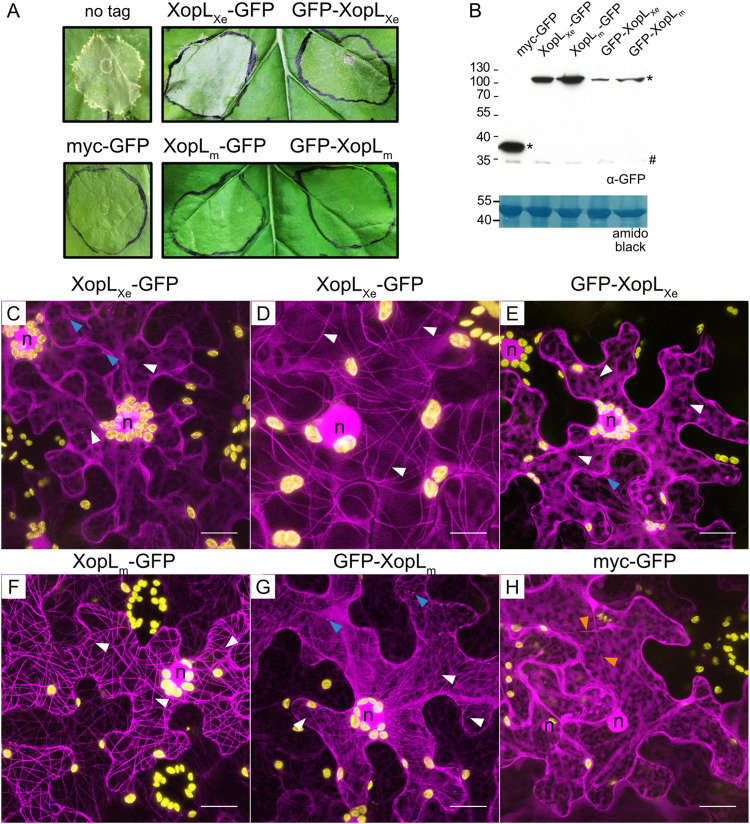
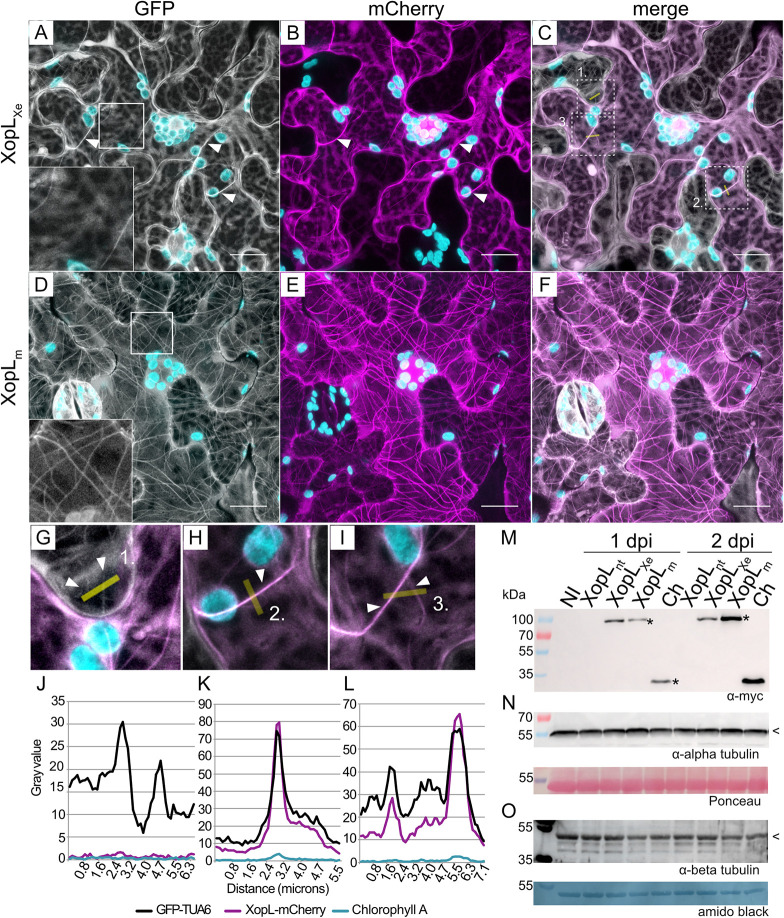
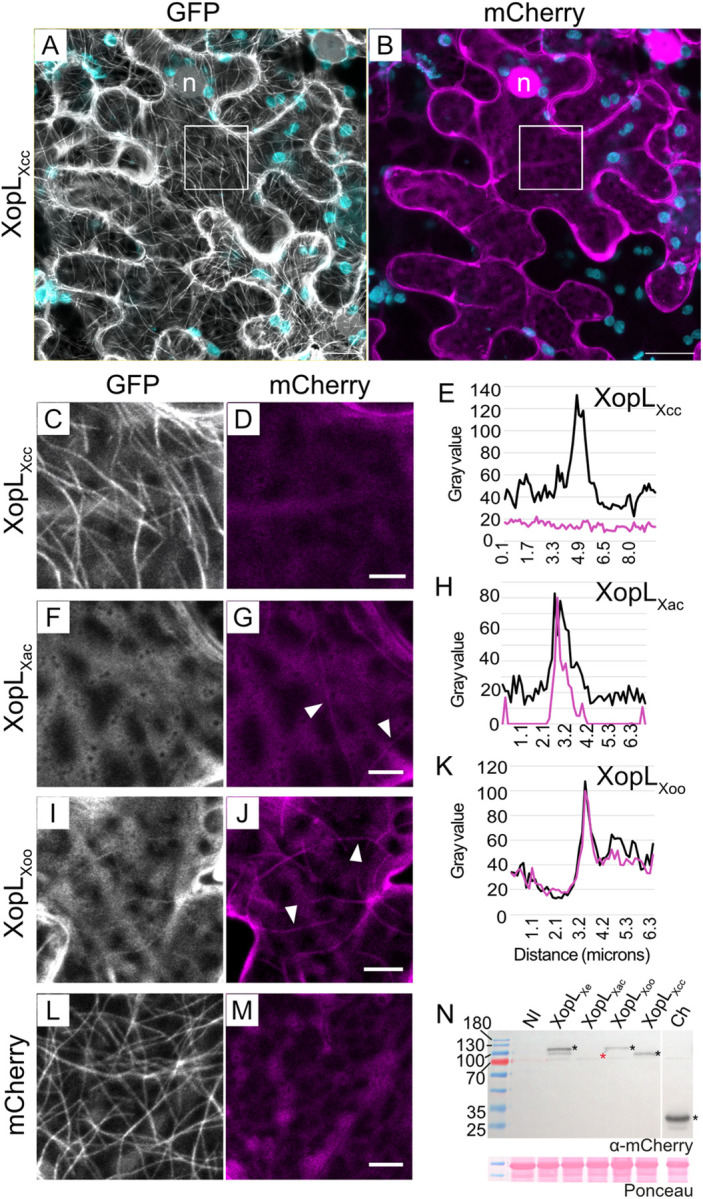
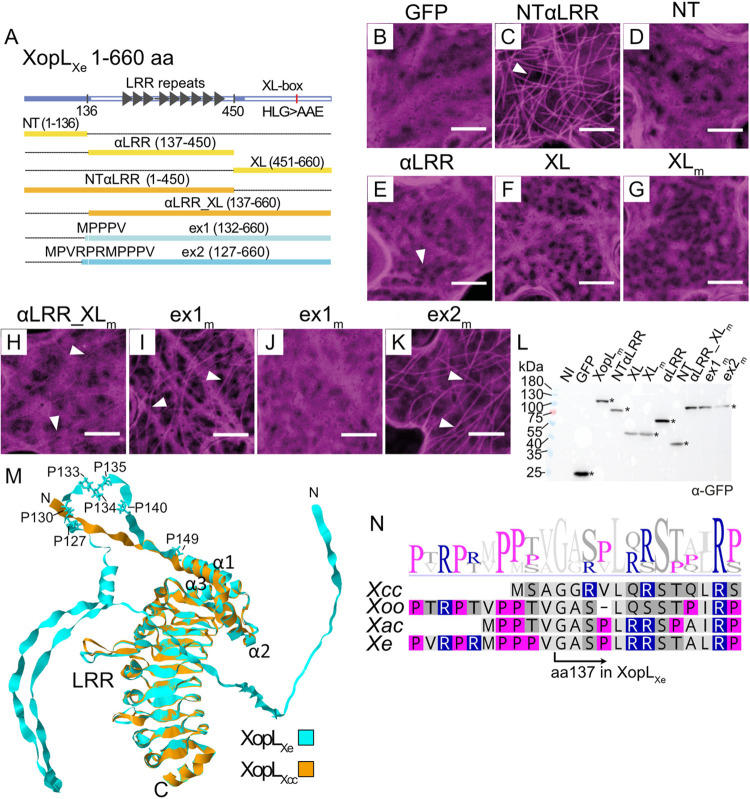
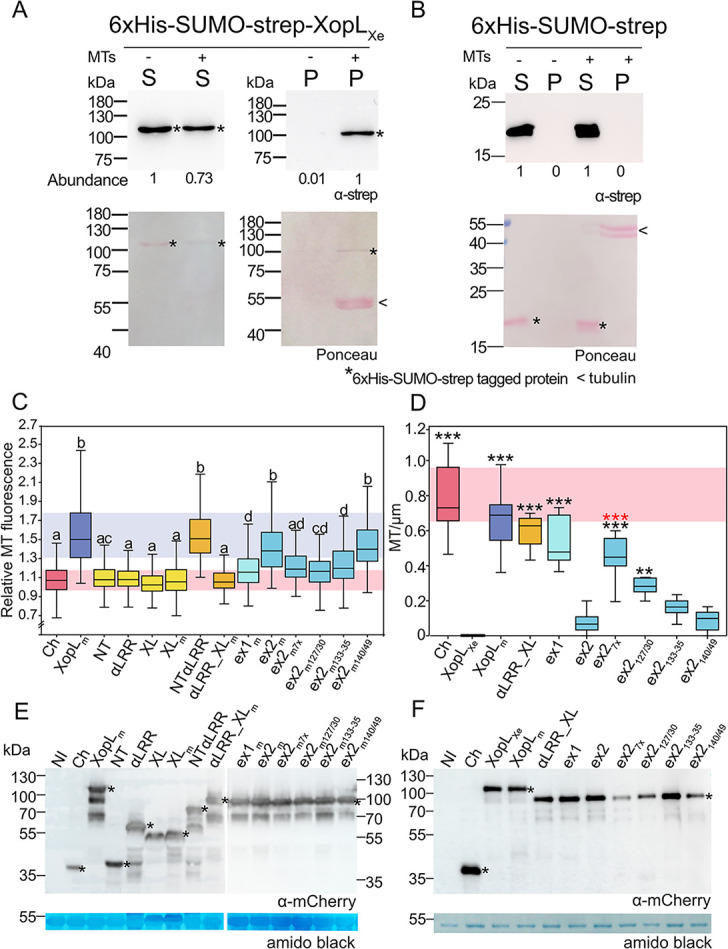
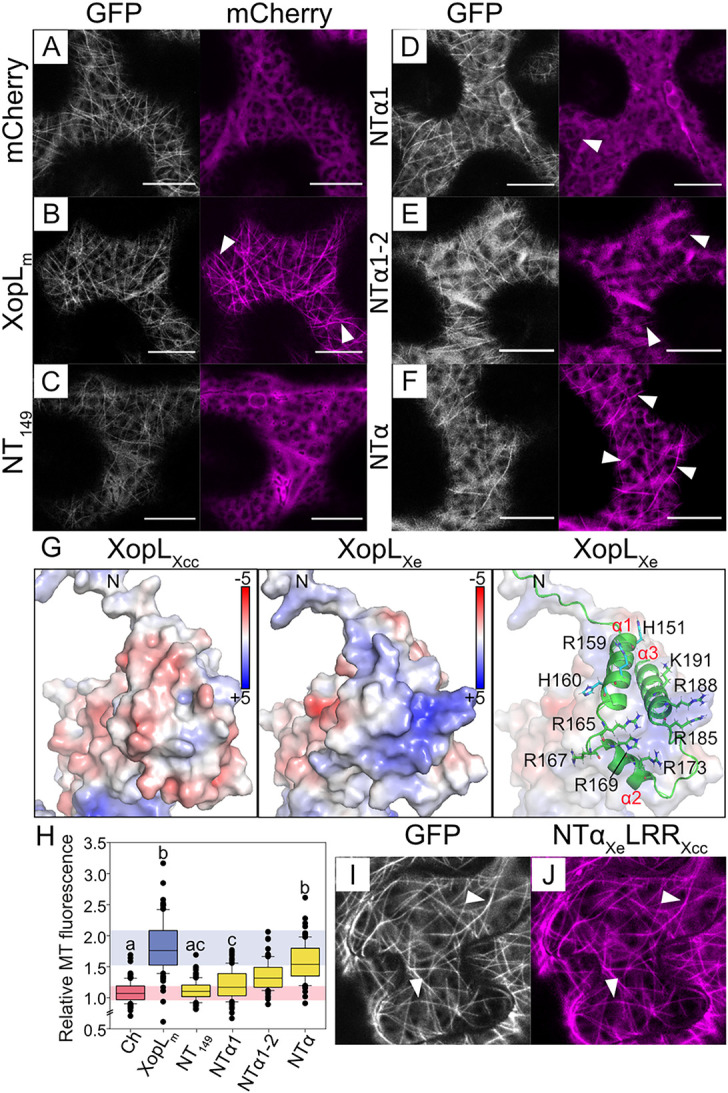
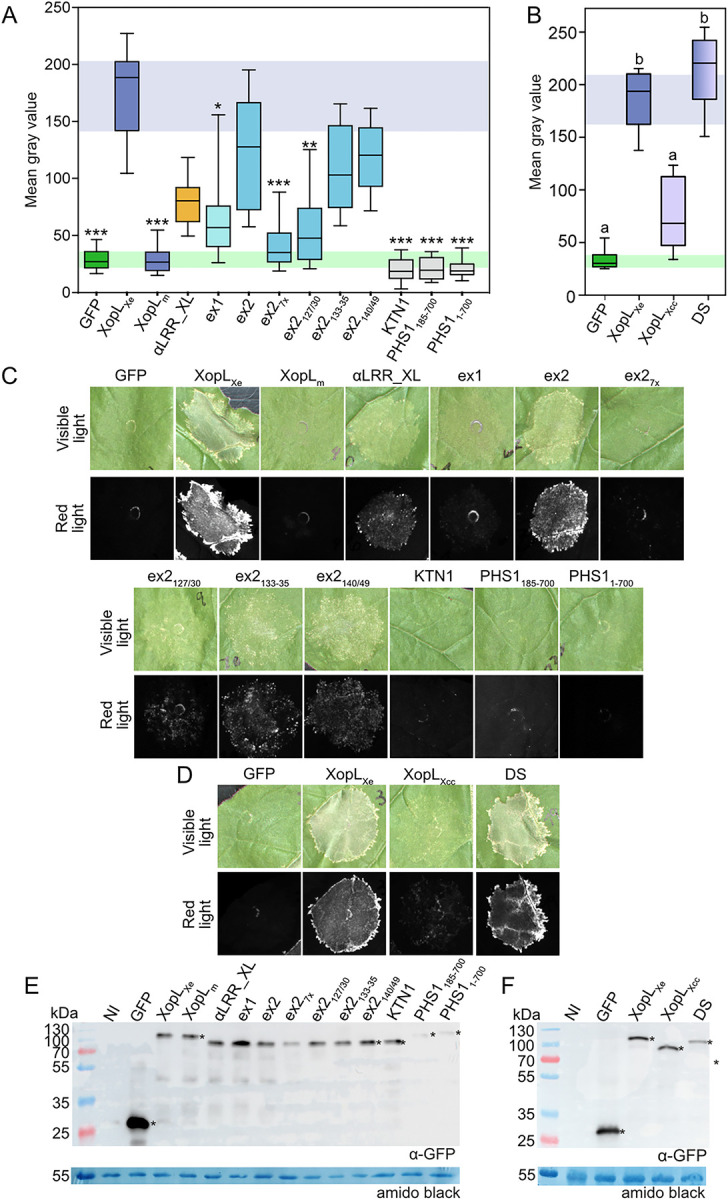
Pathogenic Xanthomonas bacteria cause disease on more than 400 plant species. These Gram-negative bacteria utilize the type III secretion system to inject type III effector proteins (T3Es) directly into the plant cell cytosol where they can manipulate plant pathways to promote virulence. The host range of a given Xanthomonas species is limited, and T3E repertoires are specialized during interactions with specific plant species. Some effectors, however, are retained across most strains, such as Xanthomonas Outer Protein L (XopL). As an 'ancestral' effector, XopL contributes to the virulence of multiple xanthomonads, infecting diverse plant species. XopL homologs harbor a combination of a leucine-rich-repeat (LRR) domain and an XL-box which has E3 ligase activity. Despite similar domain structure there is evidence to suggest that XopL function has diverged, exemplified by the finding that XopLs expressed in plants often display bacterial species-dependent differences in their sub-cellular localization and plant cell death reactions. We found that XopL from X. euvesicatoria (XopLXe) directly associates with plant microtubules (MTs) and causes strong cell death in agroinfection assays in N. benthamiana. Localization of XopLXe homologs from three additional Xanthomonas species, of diverse infection strategy and plant host, revealed that the distantly related X. campestris pv. campestris harbors a XopL (XopLXcc) that fails to localize to MTs and to cause plant cell death. Comparative sequence analyses of MT-binding XopLs and XopLXcc identified a proline-rich-region (PRR)/α-helical region important for MT localization. Functional analyses of XopLXe truncations and amino acid exchanges within the PRR suggest that MT-localized XopL activity is required for plant cell death reactions. This study exemplifies how the study of a T3E within the context of a genus rather than a single species can shed light on how effector localization is linked to biochemical activity.


Conflict of interest statement

The authors have declared that no competing interests exist.

Figures

Fig 1
Fig 1. E3 ligase activity is conserved among XopL homologs from different xanthomonads.
(A) Agroinfection of N. benthamiana leaves to express GFP-myc and XopL proteins from Xanthomonas strains Xe 85–10 (XopLXe) and Xcc 8004 (XopLXcc) fused to a C-terminal GFP (OD of 0.8). Plant reactions were monitored 5 dpi. (B) Western blot analysis of protein extracts isolated 2 dpi from samples depicted in (A). One ‘not inoculated’ (NI) sample was included as a negative control. Signals were detected using a GFP-specific antibody (*). The left side of the blot shows protein mass in kDa. Amido black staining is shown as a loading control. (C) Schematic of the UbiGate plasmid used to test for E3 ligase activity of XopL proteins. Components of the A. thaliana ubiquitination machinery (affinity-tagged for detection by western blot), UBIQUITIN 10 (HIS:Ub), UBIQUITIN ACTIVATING ENZYME 1 (UBA1) and UBIQUITIN CONJUGATING ENZYME 28 (GST:UBC28) were expressed from a single, IPTG-inducible plasmid together with xopL coding sequences. Each translational unit was equipped with an independent ribosome binding site (red). (D-F) Western blot analysis of protein extracts isolated from E. coli expressing different XopL proteins. Controls were samples lacking the E3 ligase (E3-) or the E2 enzyme (E2-). The XopL protein tested is indicated above the designated lanes. (D) Ubiquitin was detected using the P4D1 antibody. Polyubiquitin chains are indicated by a black line. E2-ubiquitin (Ub+E2) conjugates are visible in E3- control sample (purple line). (E) C-terminally tagged XopL proteins were detected with a myc-specific antibody (expected size indicated with ‘*’). In some cases, autoubiquitination is detectable (Ub+XopL). (F) N-terminally-tagged E2 enzyme was detected using a GST-specific antibody. Samples were run on different gels to clearly visualize ubiquitin and other proteins. Protein mass is expressed in kDa.
Fig 2
Fig 2. XopLXe-induced cell death and MT-localization are negatively affected by an N-terminal fluorescence tag.
(A) Analysis of cell death induction following agroinfection of N. benthamiana leaves to express untagged XopLXe and XopLm (E3 ligase-inactive, H584A, L585A, G586E) N- or C-terminally fused to GFP and GFP alone (OD600 of 0.4). Plant reactions were monitored 5 dpi. (B) Western blot analysis of protein extracts isolated 2 dpi from the experiment depicted in (A). Protein signals were detected with a GFP-specific antibody (*). The left side of the blot shows protein mass in kDa; # indicates a non-specific signal. Amido black staining is included as a loading control. (C-G) Confocal microscopy pictures of lower epidermal cells 2 dpi from the experiment depicted in (A). Images depict the subcellular phenotypes of (C) XopLXe-GFP, (D) a lower expressing cell from the same inoculation spot as in (C) (imaging with the LSM 780 required a laser intensity of 16.8% laser power vs. 10% used in (C), with identical gain settings), (E) GFP-XopLXe, (F) XopLm-GFP, (G) GFP-XopLm and (H) myc-GFP. GFP-labeled protein fusions are visible in magenta, plastid autofluorescence in yellow. Nuclei are labeled with ‘n’, blue arrows label mobile dots, white arrows point out microtubules and orange arrows label cytosolic strands. Scale bars are 20 μm for all images except (D), where the scale is 10 μm.
Fig 3
Fig 3. XopLXe destabilizes MTs but does not degrade tubulin.
(A-I) Confocal microscopy pictures of lower epidermal cells of GFP-TUA6 (labels MTs) transgenic N. benthamiana leaves. Leaves were agroinfected (OD600 of 0.4) to express (A-C) XopLXe-mCherry and (D-F) XopLm -mCherry. Samples were harvested at 2 dpi for microscopy. The GFP channel is visible in white (MTs), the mCherry channel in magenta (XopL derivatives). (C) and (F) are merged GFP and mCherry channels. Plastids are visible in cyan, examples of MTs are labeled with white arrows. Scale bars are 20 μm. Magnifications from (C) are shown in (G-I); yellow lines represent the location of intensity plot measurements. (J-L) Intensity plots. (J) Shows a plot of a neighboring cell without XopLXe expression (negative control). (K-L) Measurements across filaments in a XopLXe-expressing cell show co-localization. The signal from the chlorophyll channel was included as a negative control (cyan lines). (M-O) Western blot analysis of protein extracts isolated from N. benthamiana tissue that was not inoculated (NI) or agroinfected (OD600 of 0.4) to express the myc-mCherry control (Ch) or XopL derivatives (XopLnt = untagged, XopLXe and XopLm with C-terminal myc tags) 1 and 2 dpi. (M) Expression of proteins fusion was confirmed via detection with a myc-specific antibody. Expected size of myc-tagged proteins is marked with ‘*’. (N and O) The abundance of tubulin monomers was tested using antibodies specific to endogenous α and β tubulin. Expected tubulin size is marked with ‘<‘. The left side of the blot shows protein mass in kDa. Ponceau and amido black staining of tubulin blots were used as loading controls.
Fig 4
Fig 4. XopLXcc does not localize to MTs.
Confocal microscopy pictures of lower epidermal cells of GFP-TUA6 (labels MTs) transgenic N. benthamiana leaves. Leaves were agroinfected (OD600 of 0.4) to express XopL proteins translationally fused to a C-terminal mCherry. Samples were harvested 2 dpi for microscopy. The GFP channel is visible in white (MTs), the mCherry channel in magenta (XopL derivatives) and plastids in cyan. (A-B) Plant cell expressing XopLXcc-mCherry. Scale bars are 20 μm. Insets from (A) and (B) (area outlined with a white box) are magnified in (C) and (D), respectively. (F-G) show a cell expressing XopLXac-mCherry and (I-J) XopLXoo-mCherry. (L-M) is the mCherry control. Scale bars for (C-M) are 5 μm. Examples of MT labeling are indicated by white arrows. (E, H and J) Fluorescence intensity plot across MTs to test for co-localization of GFP-TUA6 with (E) XopLXcc, (H) XopLXac and (K) XopLXoo. Magenta lines show the intensity of the XopL-mCherry signal, black represents GFP-TUA6. (N) Western blot analysis of protein extracts isolated 2 dpi from tissue used for microscopy in (A-M). Signals were detected using an mCherry-specific antibody (*), with exception of XopLXac (*) which was not detectable. Samples that were not inoculated ‘NI’ or expressing mCherry ‘Ch’ were loaded as controls. The left side of the blot shows protein mass in kDa. Ponceau staining shown as a loading control.
Fig 5
Fig 5. Comparative sequence analysis of XopL homologs identifies a proline-rich-region (PRR) important for MT localization.
(A) Domain structure of XopLXe and derivatives used to functionally analyze the PRR. Domains crystalized by Singer et al. (2013) are denoted with a white bar, LRR repeats by dark gray arrows. Amino acid exchanges in the XL-box of XopLXe to generate XopLm are indicated. Single domain derivatives are annotated in yellow, multiple domain in orange, and ‘extension’ (ex) constructs in blue. Amino acids added to the αLRR_XL in ex1 and ex2 are shown at the N-terminus of the corresponding construct. Amino acid positions included in each derivative are shown in brackets. (B-K) Confocal microscopy pictures of lower epidermal cells of wild-type N. benthamiana leaves. Leaves were agroinfected (OD600 of 0.4) to express (B) a GFP control, (C) NTαLRR, (D) NT, (E) αLRR, (F) XL, (G) XLm, (H) αLRR_XLm, (I) ex1m; cell with MT localization, (J) ex1m; cell without MT localization and (K) ex2m. Subscript ‘m’ indicates a triple amino acid exchange in the E3 ligase domain (H584A, L585A, G586E) that renders the derivative E3 ligase-inactive. Samples were harvested at 2 dpi for microscopy. All XopL derivatives are tagged at the C-terminus with GFP (visible in magenta). Examples of MT association are indicated by white arrows. Scale bars are 5 μm. (L) Western blot analysis of protein extracts isolated 2 dpi from experiment in (B-K). Signals were detected using a GFP-specific antibody (*). The left side of the blot shows protein mass in kDa. (M) An alignment of XopLXcc (orange) and XopLXe (cyan) 3D structural models generated in AlphaFold2. The alignment includes the unstructured NT, α-helical (α1–3) and LRR regions. The cluster of prolines conserved in MT-localizing XopLs are labeled and represented in stick format. N- and C-termini are marked with N and C, respectively. Models do not include the C-terminal XL-box. (N) Alignment of XopLXcc, XopLXe, XopLXac and XopLXoo at the junction between NT and αLRR constructs. Amino acids are colored based on polarity (Geneious Prime), basic amino acids are in blue, and fuchsia highlights prolines. The boundary between the NT and αLRR constructs is annotated at amino acid 137. The sequence logo above the alignment shows sequence conservation at specific positions.
Fig 6
Fig 6. Prolines within the PRR are essential to MT-association of XopLXe.
(A-B) Western blot analysis of MT co-sedimentation assay utilizing (A) 5 μg of affinity-purified XopLXe (88.1 kDa) protein tagged with 6xHis-SUMO-strep or (B) the tag-alone control. Supernatant fractions are marked ‘S’ and pellet fractions ‘P’. Samples with MTs are marked ‘+’ and without by ‘-’. Recombinant protein was detected using a strep-specific antibody (*). The intensity of the XopL signal (abundance) is shown below corresponding lane. Ponceau stained membranes show tubulin at 55 kDa in the pellet fraction with MTs (<). The left side of the blots show protein mass in kDa. Experiments with XopL were repeated at least three times and the tag-only control experiment was repeated two times. (C) Quantification of MT-association of XopLm derivatives from confocal images of agroinfected GFP-TUA6 lower leaf epidermis (2 dpi, OD600 of 0.8). MT binding is expressed as ‘Relative MT fluorescence’ (see Materials and Methods). Treatments that are not significantly different (p>0.05) are labeled with the same letter (Kruskal-Wallis One Way Analysis of Variance on Ranks, pairwise Dunn’s post-hoc). Background colors are included for ease of comparison between key controls XopLm (blue) and mCherry (red). (D) Quantification of confocal images to evaluate MT density following the expression of XopLXe derivatives in agroinfected GFP-TUA6 lower leaf epidermis (2 dpi, OD600 of 0.8). Treatments that were significantly different than XopLXe are marked with black asterisks (* = p<0.05, ** = p<0.01, *** = p>0.001; Kruskal-Wallis One Way ANOVA on Ranks, Dunn’s post-hoc against XopL). ex2 proline to alanine exchanges that were significantly different than ex2 are marked with red asterisks (*** = p>0.001; Kruskal-Wallis One Way ANOVA on Ranks, Dunn’s post-hoc against ex2). Red box in the background is included for ease of comparison with the mCherry control (red). (C and D) Boxes represents first to third quartiles and the median is represented by a horizontal line. Whiskers represent the distribution of remaining data points. (E and F) Western blot analysis of protein extracts isolated from the experiments in (C) and (D), respectively. Signals of XopL derivatives and the mCherry control were detected using an mCherry-specific antibody (*). ‘NI’ and ‘Ch’ refer to not inoculated and mCherry control, respectively. Protein mass is expressed in kDa. (F) Amido black staining is shown as a loading control.
Fig 7
Fig 7. The exchange of the NTα region of XopLXe and XopLXcc is sufficient to engineer a MT-binding XopLXcc.
(A-F, H-J) Confocal microscopy images of lower epidermal cells of GFP-TUA6 (labels MTs) transgenic N. benthamiana leaves. Leaves were agroinfected (OD600 of 0.8) to express (A) mCherry and (B) XopLm controls and (C-F) XopL derivatives: (C) XopLXe 1–149 aa (NT149), (D) XopLXe 1–164 aa (NTα1), (E) XopLXe 1–179 aa (NTα1–2), (F) XopLXe 1–210 aa (NTα; α1–3). Scale bars are 15 μm. The mCherry channel is visible in magenta and GFP (MTs) is white. White arrows point out examples of MT labeling. The corresponding western blot is shown in S9 Fig. (G) Electrostatic surface potential comparison of the α-helical regions of XopLXcc and XopLXe modelled with AlphaFold2/PyMOL. Values are expressed on a color scale from -5 (red) to +5 (blue) kT/e. The right panel depicts an overlay of the electrostatic map of XopLXe with its ribbon structure to show the locations of α 1–3. Basic residues are represented in stick format. N-terminal ends of proteins are marked ‘N’ in all panels (H) Quantification of MT-association of XopL derivatives from confocal images of agroinfected GFP-TUA6 lower leaf epidermis (2 dpi, OD600 of 0.8) depicted in (A-F). MT binding is expressed as ‘Relative MT fluorescence’ (see Materials and Methods). Treatments that are not significantly different (p>0.05) are labeled with the same letter (Kruskal-Wallis One Way Analysis of Variance on Ranks, pairwise Tukey post-hoc). Background colors are included for ease of comparison between key controls XopLm (blue) and mCherry (red). Boxes represents first to third quartiles and the median is represented by a horizontal line. Whiskers represent the distribution of remaining data points. (I-J) Confocal microscopy image of XopLXe 1–210 aa translationally fused with XopLXcc 78–428 aa (NTαXeLRRXcc) from the same experiment as depicted in (A-F). (I) GFP labeled MTs are in white, (J) the domain swapped XopL in magenta. White arrows point out examples of MT labeling. Scale bars are 15 μm. The corresponding western blot is shown in S9 Fig.
Fig 8
Fig 8. Cell death is correlated with MT association of XopL.
(A-B) Quantification of plant cell death via red fluorescence scanning of agroinfected leaves expressing XopL derivatives tagged with GFP 5 dpi (OD600 of 0.8). (A) Cell death in leaves expressing MT-binding and non-binding derivatives of XopLXe or Arabidopsis proteins KTN1 and PHS1. Treatments that were significantly different than XopLXe are marked with asterisks (* = p<0.05, ** = p<0.01, *** = p>0.001; Kruskal-Wallis One Way ANOVA on Ranks, Dunn’s post-hoc test against XopLXe). (B) Cell death following expression of XopLXe, XopLXcc, and NTαXeLRRXccXLXcc; termed DS. Treatments that are not significantly different are marked with the same letter (p>0.05; One way analysis of variance, pairwise Bonferroni t-tests post-hoc). (A-B) Boxes represent first to third quartiles, while the median is marked by a horizontal line and whiskers show the distribution of remaining data points. (C-D) Examples of visible light and red-light photos of agroinfection spots recording cell death from the experiments in (A) and (B) respectively. (E) and (F) Western blot analysis of protein extracts isolated from tissue analyzed in experiments in (A) and (B), respectively. Signals were detected using a GFP-specific antibody (*). The left side of blots shows protein mass in kDa. Amido black staining was included as a loading control.

Similar articles

Cited by

References

    1. Timilsina S, Potnis N, Newberry EA, Liyanapathiranage P, Iruegas-Bocardo F, White FF, et al.. Xanthomonas diversity, virulence and plant-pathogen interactions. Nat Rev Microbiol. 2020;18(8):415–27. - PubMed
    1. An SQ, Potnis N, Dow M, Vorholter FJ, He YQ, Becker A, et al.. Mechanistic insights into host adaptation, virulence and epidemiology of the phytopathogen Xanthomonas. FEMS Microbiol Rev. 2020;44(1):1–32. - PMC - PubMed
    1. Büttner D, Bonas U. Regulation and secretion of Xanthomonas virulence factors. FEMS Microbiol Rev. 2010;34(2):107–33. - PubMed
    1. Büttner D, He SY. Type III protein secretion in plant pathogenic bacteria. Plant Physiol. 2009;150(4):1656–64. doi: 10.1104/pp.109.139089 - DOI - PMC - PubMed
    1. Büttner D. Protein export according to schedule: architecture, assembly, and regulation of type III secretion systems from plant- and animal-pathogenic bacteria. Microbiol Mol Biol Rev. 2012;76(2):262–310. doi: 10.1128/MMBR.05017-11 - DOI - PMC - PubMed

Publication types

MeSH terms

Substances