serosim: An R package for simulating serological data arising from vaccination, epidemiological and antibody kinetics processes
- PMID: 37578985
- PMCID: PMC10449138
- DOI: 10.1371/journal.pcbi.1011384
serosim: An R package for simulating serological data arising from vaccination, epidemiological and antibody kinetics processes
Abstract
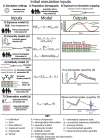
serosim is an open-source R package designed to aid inference from serological studies, by simulating data arising from user-specified vaccine and antibody kinetics processes using a random effects model. Serological data are used to assess population immunity by directly measuring individuals' antibody titers. They uncover locations and/or populations which are susceptible and provide evidence of past infection or vaccination to help inform public health measures and surveillance. Both serological data and new analytical techniques used to interpret them are increasingly widespread. This creates a need for tools to simulate serological studies and the processes underlying observed titer values, as this will enable researchers to identify best practices for serological study design, and provide a standardized framework to evaluate the performance of different inference methods. serosim allows users to specify and adjust model inputs representing underlying processes responsible for generating the observed titer values like time-varying patterns of infection and vaccination, population demography, immunity and antibody kinetics, and serological sampling design in order to best represent the population and disease system(s) of interest. This package will be useful for planning sampling design of future serological studies, understanding determinants of observed serological data, and validating the accuracy and power of new statistical methods.
Copyright: © 2023 Menezes et al. This is an open access article distributed under the terms of the Creative Commons Attribution License, which permits unrestricted use, distribution, and reproduction in any medium, provided the original author and source are credited.
Conflict of interest statement
The authors have declared that no competing interests exist.
Figures


Similar articles
-
serojump: A Bayesian tool for inferring infection timing and antibody kinetics from longitudinal serological data.medRxiv [Preprint]. 2025 Mar 5:2025.03.04.25323335. doi: 10.1101/2025.03.04.25323335. medRxiv. 2025. PMID: 40093253 Free PMC article. Preprint.
-
Development and Implementation of Dried Blood Spot-Based COVID-19 Serological Assays for Epidemiologic Studies.Microbiol Spectr. 2022 Jun 29;10(3):e0247121. doi: 10.1128/spectrum.02471-21. Epub 2022 May 25. Microbiol Spectr. 2022. PMID: 35612315 Free PMC article.
-
Longitudinal Serological Surveillance for COVID-19 Antibodies after Infection and Vaccination.Microbiol Spectr. 2022 Oct 26;10(5):e0202622. doi: 10.1128/spectrum.02026-22. Epub 2022 Sep 19. Microbiol Spectr. 2022. PMID: 36121258 Free PMC article.
-
Applications of SARS-CoV-2 serological testing: impact of test performance, sample matrices, and patient characteristics.Crit Rev Clin Lab Sci. 2024 Jan;61(1):70-88. doi: 10.1080/10408363.2023.2254390. Epub 2024 Jan 5. Crit Rev Clin Lab Sci. 2024. PMID: 37800891 Review.
-
Influenza vaccination in cancer patients undergoing systemic therapy.Clin Med Insights Oncol. 2014 May 1;8:57-64. doi: 10.4137/CMO.S13774. eCollection 2014. Clin Med Insights Oncol. 2014. PMID: 24855405 Free PMC article. Review.
Cited by
-
Serodynamics: A primer and synthetic review of methods for epidemiological inference using serological data.Epidemics. 2024 Dec;49:100806. doi: 10.1016/j.epidem.2024.100806. Epub 2024 Nov 30. Epidemics. 2024. PMID: 39647462 Free PMC article. Review.
-
serojump: A Bayesian tool for inferring infection timing and antibody kinetics from longitudinal serological data.medRxiv [Preprint]. 2025 Mar 5:2025.03.04.25323335. doi: 10.1101/2025.03.04.25323335. medRxiv. 2025. PMID: 40093253 Free PMC article. Preprint.
-
RSero: A user-friendly R package to reconstruct pathogen circulation history from seroprevalence studies.PLoS Comput Biol. 2025 Feb 3;21(2):e1012777. doi: 10.1371/journal.pcbi.1012777. eCollection 2025 Feb. PLoS Comput Biol. 2025. PMID: 39899643 Free PMC article.
-
serocalculator, an R package for estimating seroincidence from cross-sectional serological data.medRxiv [Preprint]. 2025 Aug 4:2025.06.04.25328941. doi: 10.1101/2025.06.04.25328941. medRxiv. 2025. PMID: 40502584 Free PMC article. Preprint.
-
Linking multiple serological assays to infer dengue virus infections from paired samples using mixture models.medRxiv [Preprint]. 2024 Dec 10:2024.12.08.24318683. doi: 10.1101/2024.12.08.24318683. medRxiv. 2024. PMID: 39711706 Free PMC article. Preprint.
References
-
- Bjørnstad ON, Finkenstädt BF, Grenfell BT. Dynamics of Measles Epidemics: Estimating Scaling of Transmission Rates Using a Time Series SIR Model. Ecol Monogr. 2002;72: 169–184.
Publication types
MeSH terms
Substances
Grants and funding
LinkOut - more resources
Full Text Sources
Medical
Miscellaneous

