. 2023 Sep:95:104753.
doi: 10.1016/j.ebiom.2023.104753. Epub 2023 Aug 12.

The viral fitness and intrinsic pathogenicity of dominant SARS-CoV-2 Omicron sublineages BA.1, BA.2, and BA.5

Affiliations

The viral fitness and intrinsic pathogenicity of dominant SARS-CoV-2 Omicron sublineages BA.1, BA.2, and BA.5

Huiping Shuai et al. EBioMedicine. 2023 Sep.

Abstract

Background: Among the Omicron sublineages that have emerged, BA.1, BA.2, BA.5, and their related sublineages have resulted in the largest number of infections. While recent studies demonstrated that all Omicron sublineages robustly escape neutralizing antibody response, it remains unclear on whether these Omicron sublineages share any pattern of evolutionary trajectory on their replication efficiency and intrinsic pathogenicity along the respiratory tract.

Methods: We compared the virological features, replication capacity of dominant Omicron sublineages BA.1, BA.2 and BA.5 in the human nasal epithelium, and characterized their pathogenicity in K18-hACE2, A129, young C57BL/6, and aged C57BL/6 mice.

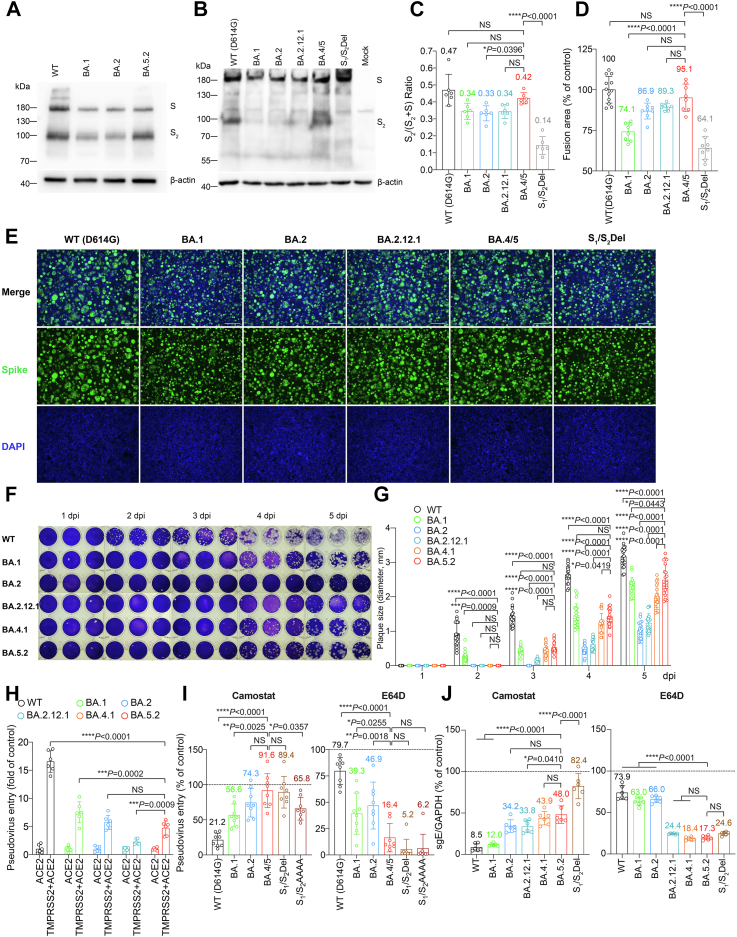
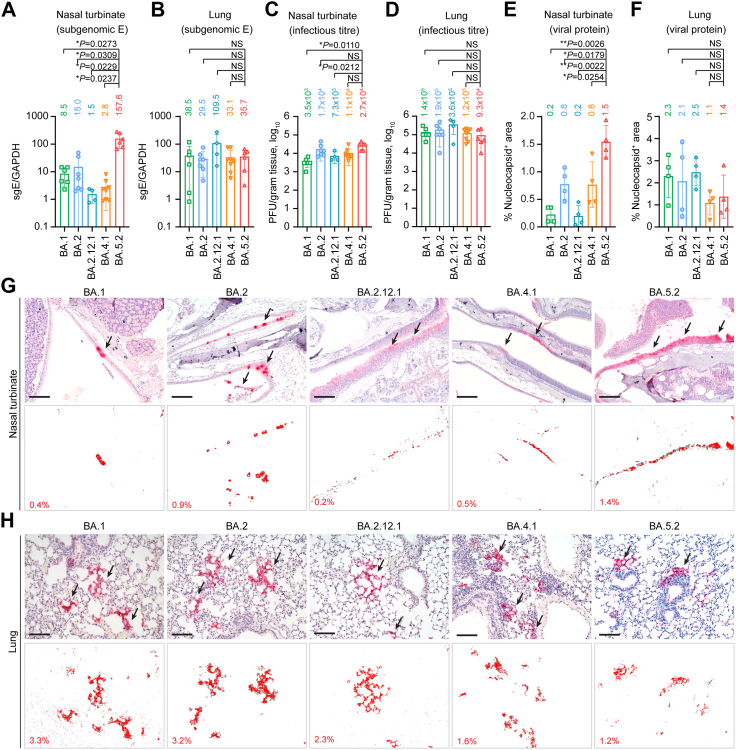
Findings: We found that BA.5 replicated most robustly, followed by BA.2 and BA.1, in the differentiated human nasal epithelium. Consistently, BA.5 infection resulted in higher viral gene copies, infectious viral titres and more abundant viral antigen expression in the nasal turbinates of the infected K18-hACE2 transgenic mice. In contrast, the Omicron sublineages are continuously attenuated in lungs of infected K18-hACE2 and C57BL/6 mice, leading to decreased pathogenicity. Nevertheless, lung manifestations remain severe in Omicron sublineages-infected A129 and aged C57BL/6 mice.

Interpretation: Our results suggested that the Omicron sublineages might be gaining intrinsic replication fitness in the upper respiratory tract, therefore highlighting the importance of global surveillance of the emergence of hyper-transmissive Omicron sublineages. On the contrary, replication and intrinsic pathogenicity of Omicron is suggested to be further attenuated in the lower respiratory tract. Effective vaccination and other precautions should be in place to prevent severe infections in the immunocompromised populations at risk.

Funding: A full list of funding bodies that contributed to this study can be found in the Acknowledgements section.

Keywords: Animal models; BA.5; COVID-19; Evolution trajectory; Mice; Omicron; Pathogenicity; Replication; SARS-CoV-2; Spike.


Conflict of interest statement

Declaration of interests The authors declare no competing interests.

Figures

Fig. 1
Fig. 1
Virus replication kinetics of Omicron sublineages. (A) The change in proportion of the genome sequences of SARS-CoV-2 Omicron sublineages deposited in GISAID from January 2022 to October 2022. The x-axis indicated the sequence collection date. The y-axis indicated the proportion of the SARS-CoV-2 Omicron sublineage sequences. (B) Amino-acid sequence alignment of SARS-CoV-2 reference strain Wuhan-hu-1, BA.1, BA.2, BA.2.12.1, BA.4, BA.4.1, BA.5, and BA.5.2 spike. Amino acid positions are designated based on SARS-CoV-2 reference strain. (C and D) Cells were challenged with SARS-CoV-2 WT, Delta, BA.1, BA.2, BA.2.12.1, BA.4.1 or BA.5.2 at 0.5 MOI (for Calu3) (C) or 0.1 MOI (VeroE6) (D). Cell lysates were harvested at the designated time points for quantification of the subgenomic RNA of the envelope (sgE) gene (n = 8). Infectious viral particles in supernatant samples were titrated with TCID50 assays (n = 4). (E) Cell viability of VeroE6-TMPRSS2 cells infected with WT, Delta, BA.1, BA.2, BA.2.12.1, BA.4.1 or BA.5.2 at 0.1 MOI was quantified at the designated time points (n = 8). Data represents mean ± SD from the indicated number of biological repeats. Statistical significances were determined using two way-ANOVA with Sidak's multiple comparisons test (C–D) or with Dunnett's multiple comparisons test (E). Data were obtained from three independent experiments. Each data point represents one biological repeat. ∗ represented p < 0.05 and ∗∗ represented p < 0.01. ∗∗∗ represented p < 0.001, ∗∗∗∗ represented p < 0.0001. NS, not statistically significant; WT, wildtype SARS-CoV-2.
Fig. 2
Fig. 2
Virological features of Omicron sublineages in vitro. (A and B) Representative image of spike cleavage in VeroE6 and 293T cells. (A) VeroE6 cells were infected with the indicated Omicron subvariants. (B) 293T cells were transfected with the indicated spike plasmids. Viral-infected or spike-transfected cell lysates were harvested at 24 hpi. for detection of SARS-CoV-2 spike cleavage with Western blotting using an anti-spike S2 antibody. Representative image of spike was shown with β-actin added as a sample processing control. Spike and β-actin were run on different gels and detected on different membranes. The experiment was repeated six times independently with similar results. (C) The cleavage ratio of spike proteins from six independent experiments in (B) was quantified by ImageJ. (D) Representative images of spike-mediated cell-cell fusion. 293T cells (effectors cells) were co-transfected with the indicated spike with GFP1-10, and were co-cultured with 293T cells co-transfected with hACE2, TMPRSS2, and GFP11 (target cells) at a 1:1 ratio. The co-cultured cells were fixed with 4% PFA, permeabilized with 0.1% Triton-X100, and stained with DAPI. Representative images were from four independent experiments with similar results. (E) The fusion area was quantified by ImageJ. Results were normalized with the SARS-CoV-2-WT (D614G) group. (F) Plaque assay images of SARS-CoV-2 WT, BA.1, BA.2, BA.2.12.1, BA.4.1 and BA.5.2 in VeroE6-TMPRSS2 cells. VeroE6-TMPRSS2 cells were challenged with SARS-CoV-2 WT, BA.1, BA.2, BA.2.12.1, BA.4.1 and BA.5. The infected cells were fixed with 4% paraformaldehyde at the designated time points and stained with crystal violet (n = 3). The experiment was repeated three times independently with similar results. Each well represents one biological repeat. (G) Plaque diameters at the indicated time points were measured by Adobe Photoshop (n = 20). (H) 293T cells were transfected with hACE2 or co-transfected with hACE2 and TMPRSS2, followed by transduction with pseudoviruses expressing the spike of SARS-CoV-2 WT (D614G), BA.1, BA.2, BA.2.12.1, BA.4/5 at 24 h post-transfection. Pseudovirus entry was quantified by measuring the luciferase signal (n = 6). Fold change in the luciferase signal was normalized to the mean luciferase readouts of cells with only hACE2 overexpression. (I) VeroE6-TMPRSS2 cells were pre-treated with 50 μM camostat (left panel) and E64D (right panel) for 2 h followed by transduction with pseudoviruses expressing the spike of SARS-CoV-2 WT (D614G), BA.1, BA.2, BA.4/5, S1/S2Del, S1/S2AAAA at 24 h post-transfection. Pseudovirus entry was quantified by measuring the luciferase signal (n = 8). The luciferase signal was normalized to the mean luciferase readouts of cells treated with DMSO. (J) Calu3 (left panel) and VeroE6 (right panel) cells were pre-treated with 25 μM camostat and E64D, respectively, for 2 h followed by challenge with authentic viruses SARS-CoV-2 WT, BA.1, BA.2, BA.2.12.1, BA.4.1, BA.5.2, SARS-CoV-2 S1/S2Del. Viral-infected cell lysates were harvested at 24 hpi for quantification of the subgenomic RNA of the envelope (sgE) gene (n = 6). Data represents mean ± SD from the indicated number of biological repeats. Statistical significance was determined with one-way ANOVA (C, D, I, and J) or two-way ANOVA (G and H). Data were obtained from three independent experiments. Each data point represents one biological repeat. ∗ represented p < 0.05 and ∗∗ represented p < 0.01. ∗∗∗ represented p < 0.001, ∗∗∗∗ represented p < 0.0001. NS, not statistically significant. WT, wildtype SARS-CoV-2.
Fig. 3
Fig. 3
Virological assessment of Omicron BA.1, BA.2, BA.4.1, BA.5.2 in primary human nasal epithelial cells. (A) Gene expression level of the respiratory tract epithelial cell markers in primary human nasal epithelial cells (hNECs) and Calu3 cells (n = 3). (B) Gene expression level of the nose-enriched markers in hNECs and Calu3 cells (n = 3). (C) Gene expression level of SARS-CoV-2 entry factors in hNECs and Calu3 cells (n = 3). (D) hNECs were pre-treated with 10 μM camostat (left panel) or E64D (right panel) for 2 h followed by SARS-CoV-2 WT, BA.1, BA.2, BA.4.1, or BA.5.2 infection at 2 MOI (n = 3). Supernatant samples were harvested at 72 hpi and the viral RdRp gene level was quantified with qRT-PCR. (E–G) hNECs were infected with BA.1, BA.2, BA.4.1, BA.5.2, or WT SARS-CoV-2 at 2 MOI (n = 3). Supernatants were harvested for titration of (E) infectious viral titres with TCID50 assays at 2, 24, 48 and 72 hpi and quantification of (F) viral RdRp gene copies at 72 hpi. (G) Cell lysates were harvested at 72 hpi for quantification of viral subgenomic E gene (sgE) copies and were normalized with housekeeping gene GAPDH (n = 3). (H) hNECs infected with BA.1, BA.2, BA.4.1, BA.5.2, or WT SARS-CoV-2 at 2 MOI were fixed at 24 hpi for the visualization of ciliated cell marker beta-tubulin (red) and SARS-CoV-2 nucleocapsid protein (green) by immunofluorescence staining. Scale bar, 20 μm. Data were obtained from three independent experiments. Each data point represents one biological repeat. Data represent mean ± SD from the indicated number of biological repeats. Statistical significance was determined with multiple two-tailed Student’s t-test (A–C), one-way ANOVA with Dunnett’s multiple comparison tests (D, F, and G), and two-way ANOVA with Sidak's multiple comparison tests (E). ∗p < 0.05, ∗∗p < 0.01, ∗∗∗p < 0.001, ∗∗∗∗p < 0.0001. NS, not statistically significant. WT, wildtype SARS-CoV-2.
Fig. 4
Fig. 4
Virological assessment of Omicron BA.1, BA.2, BA.2.12.1, BA.4.1 and BA.5.2 in K18-hACE2 transgenic mice. 6-to-10-week-old male and female K18-hACE2 transgenic mice were challenged with 5000 PFU Omicron subvariants BA.1 (n = 6), BA.2 (n = 7), BA.2.12.1 (n = 4), BA.4.1.2 (n = 8) and BA.5.2 (n = 6). Mice were euthanized at 2 dpi for collection of nasal turbinate and lung tissues for detection of viral burden and viral antigen expression. (A and B) Viral sgE copies were quantified with probe-specific RT-qPCR in the (A) nasal turbinate and (B) lung. (C and D) Infectious viral titres were quantified with plaque assays in the (C) nasal turbinate and (D) lung samples. (E and F) SARS-CoV-2 nucleocapsid protein in the (E) nasal turbinate and (F) lung was quantified with ImageJ. Four mice from each experiment group were used for viral antigen expression quantification. (G and H) Representative images of immunohistochemistry staining for the detection of SARS-CoV-2 nucleocapsid protein (red, indicated with arrows) in the (G) nasal turbinate and (H) lung. Scale bar, 100 μm. Data represent mean ± SD from the indicated number of biological repeats. Statistical significance was determined with Brown-Forsythe and Welch one-way ANOVA with Dunnett's T3 multiple comparisons tests (A–F). Data were obtained from three independent experiments. Each data point represents one biological repeat. Mean value for each experiment group were shown. ∗p < 0.05, ∗∗p < 0.01. NS, not statistically significant.
Fig. 5
Fig. 5
Pathogenicity and replication fitness of Omicron BA.1, BA.2, BA.2.12.1, BA.4.1 and BA.5.2 in K18-hACE2 transgenic mice. (A) Representative images of H&E staining of the nasal turbinate and lung. Dashed circles, necrotic cell debris; closed arrowheads, epithelium desquamation; arrows, perivascular inflammatory cell infiltration; cross, proteinaceous exudation; open arrowheads, lamina propria infiltration; asterisk, alveolar septa thickening. Three sections were taken from each animal for immunochemistry analysis. Scale bar, 100 μm. (B–D) Semiquantitative analysis of the pathological changes in the nasal turbinate. (B) Nasal epithelium damage (0 = normal structure; 1 = mild epithelial cell loss; 2 = moderate epithelium desquamation; 3 = severe epithelium detachment) and (C) nasal cavity abnormality (necrotic epithelial cell debris, protein/fibrin deposition, and inflammatory cell infiltration each scored 1 point) were scored accordingly. (D) Pathology scores of the of the nasal turbinate were shown by adding the histological scores of nasal epithelium damage and abnormalities in the nasal cavity of each animal. (E–H) Semiquantitative analysis of the pathological changes in the lung. (E) Bronchiolitis (0 = normal structure; 1 = mild peribronchiolar infiltration; 2 = peribronchiolar infiltration plus epithelial cell death; 3 = score 2 plus intrabronchiolar wall infiltration and epithelium desquamation), (F) alveolar damage (0 = normal structure; 1 = alveolar wall thickening and congestion; 2 = focal alveolar space infiltration or exudation; 3 = diffused alveolar space infiltration or exudation or haemorrhage) and (G) perivascular infiltration (0 = normal structure; 1 = mild perivascular oedema or infiltration; 2 = vessel wall infiltration; 3 = severe endothelium infiltration) were scored accordingly. (H) Pathology scores of lungs were shown by adding the histological scores of bronchiolitis, alveolar damage, and perivascular infiltration in the lung of each animal. (I) Logistic regression based on the lung pathology scores presented in (H) and the peak count date of the indicated Omicron sublineages. Each sublineages were shown according to the individual peak count date proportionally since COVID-19 outbreak. Logistic regression coefficient (β), its 95% confidence interval (CI) and the p-value (P) were shown. (J–M) BA.2 and BA.5.2 or BA.4.1 and BA.5.2 were mixed at 1:1 ratio based on their infectious viral titres at 5000 PFU, followed by intranasal inoculation of the mixture into three to four 6-to-8-week-old female K18-hACE2 transgenic mice. Nasal turbinate was harvested at 2 dpi and subject to next generation sequencing (NGS) analysis. Proportion of viral genome copies of the nasal turbinate samples determined with NGS analysis were shown from the competition assay between (J) BA.2 and BA.5.2 (n = 4) and (L) BA.4.1 and BA.5.2 (n = 3). Viral genome abundance (K) between BA.2 and BA.5.2 (n = 4) and (M) between BA.4.1 and BA.5.2 (n = 3) was compared with that of the inoculum and shown in fold change. Data represent mean ± SD from the indicated number of biological repeats. Statistical significance was determined with Brown-Forsythe and Welch one-way ANOVA with Dunnett's T3 multiple comparisons tests (B–H) and two-tailed Student’s t-tests (K and M). Data were obtained from three independent experiments. Each data point represents one biological repeat. Mean value for each experiment group were shown. ∗p < 0.05, ∗∗p < 0.01, ∗∗∗p < 0.001. NS, not statistically significant.
Fig. 6
Fig. 6
Virological assessment of Omicron BA.2, BA.4.1 and BA.5.2 in WT C57BL/6, aged C57BL/6, and A129 mice. 6-to-8-week-old female C57BL/6 (n = 4 for BA.4.1; n = 5 for B.1.351, BA.2, and BA.5.2), 10-to-11-month old female C57BL/6 (n = 3 for B.1.351, BA.2, BA.4.1, and BA.5.2) and 6-to-8-week-old female A129 (n = 4 for B.1.351, BA.2, BA.4.1 and BA.5.2) mice were challenged with 1 × 105 PFU Omicron subvariants BA.2, BA.4.1, BA.5.2, or B.1.351 (Beta). Mice were euthanized at 2 dpi for collection of nasal turbinate and lung tissues for detection of viral burden and lung tissues for viral antigen expression. (A and B) Viral sgE copies in the (A) nasal turbinate and (B) lung were quantified with probe-specific RT-qPCR. (C) Infectious viral titres in the lungs were quantified with plaque assays. (D) Viral antigen expression in the lung was quantified with the SARS-CoV-2 nucleocapsid protein expression by ImageJ. Four mice from each experimental group were used for viral antigen expression quantification. (E) Representative images of immunohistochemistry staining for the detection of SARS-CoV-2 nucleocapsid protein (red, indicated with arrows) in the lung. The corresponding nucleocapsid protein positive area was quantified with ImageJ and shown. Three sections were taken from each animal for immunochemistry analysis. Scale bar, 100 μm. Data represent mean ± SD from the indicated number of biological repeats. Statistical significance was determined with Brown-Forsythe and Welch one-way ANOVA with Dunnett's T3 multiple comparisons test in (A–D). Data were obtained from three independent experiments. Each data point represents one biological repeat. ∗p < 0.05, ∗∗p < 0.01. NS, not statistically significant.
Fig. 7
Fig. 7
Pathogenicity of Omicron BA.2, BA.4.1 and BA.5.2 in WT C57BL/6, aged C57BL/6, and A129 mice. 6-to-8-week-old female C57BL/6, 10-to-11-month old female C57BL/6 and 6-to-8-week-old female A129 challenged with 1 × 105 PFU Omicron subvariants BA.2, BA.4.1, BA.5.2, or B.1.351 (Beta) and were euthanized at 2 dpi to collect lung tissues for pathological examination (n = 4 for young C57BL/6 and A129 mice, n = 3 for aged C57BL/6 mice). (A) Representative images of H&E staining of the nasal turbinate and lung. Dashed circles, necrotic cell debris; closed arrowheads, epithelium desquamation; arrows, perivascular inflammatory cell infiltration; cross, proteinaceous exudation; open arrowheads, lamina propria infiltration; dashed ellipse, haemorrhage; asterisk, alveolar septa thickening. Three sections were taken from each animal for immunochemistry analysis. Scale bar, 100 μm. (B–E) Semiquantitative analysis of the pathological changes in the lung. (B) Bronchiolitis (0 = normal structure; 1 = mild peribronchiolar infiltration; 2 = peribronchiolar infiltration plus epithelial cell death; 3 = score 2 plus intrabronchiolar wall infiltration and epithelium desquamation), (C) alveolar damage (0 = normal structure; 1 = alveolar wall thickening and congestion; 2 = focal alveolar space infiltration or exudation; 3 = diffused alveolar space infiltration or exudation or haemorrhage) and (D) perivascular infiltration (0 = normal structure; 1 = mild perivascular oedema or infiltration; 2 = vessel wall infiltration; 3 = severe endothelium infiltration) were scored accordingly. (E) Pathology scores of the of the lung were shown by adding up the histological scores of bronchiolitis, alveolar damage, and perivascular infiltration in the lung of each animal. Four mice from each experimental group were used for histology analysis and semiquantitative analysis. Statistical significance was determined with Kruskal–Wallis nonparametric test followed by Holm-Sidak's multiple comparisons test in (B–E). Data were obtained from three independent experiments. Each data point represents one biological repeat. Mean value for each experiment group were shown. ∗p < 0.05, ∗∗p < 0.01. NS, not statistically significant.
Original blots
Original blots

References

    1. Cao Y., Wang J., Jian F., et al. Omicron escapes the majority of existing SARS-CoV-2 neutralizing antibodies. Nature. 2022;602(7898):657–663. - PMC - PubMed
    1. Carreno J.M., Alshammary H., Tcheou J., et al. Activity of convalescent and vaccine serum against SARS-CoV-2 Omicron. Nature. 2022;602(7898):682–688. - PubMed
    1. Cele S., Jackson L., Khoury D.S., et al. Omicron extensively but incompletely escapes Pfizer BNT162b2 neutralization. Nature. 2022;602(7898):654–656. - PMC - PubMed
    1. Halfmann P.J., Iida S., Iwatsuki-Horimoto K., et al. SARS-CoV-2 Omicron virus causes attenuated disease in mice and hamsters. Nature. 2022;603(7902):687–692. - PMC - PubMed
    1. Iketani S., Liu L., Guo Y., et al. Antibody evasion properties of SARS-CoV-2 Omicron sublineages. Nature. 2022;604(7906):553–556. - PMC - PubMed