. 2023 Aug 14;14(1):4645.
doi: 10.1038/s41467-023-40391-x.

GATA2 mitotic bookmarking is required for definitive haematopoiesis

Affiliations

GATA2 mitotic bookmarking is required for definitive haematopoiesis

Rita Silvério-Alves et al. Nat Commun. .

Abstract

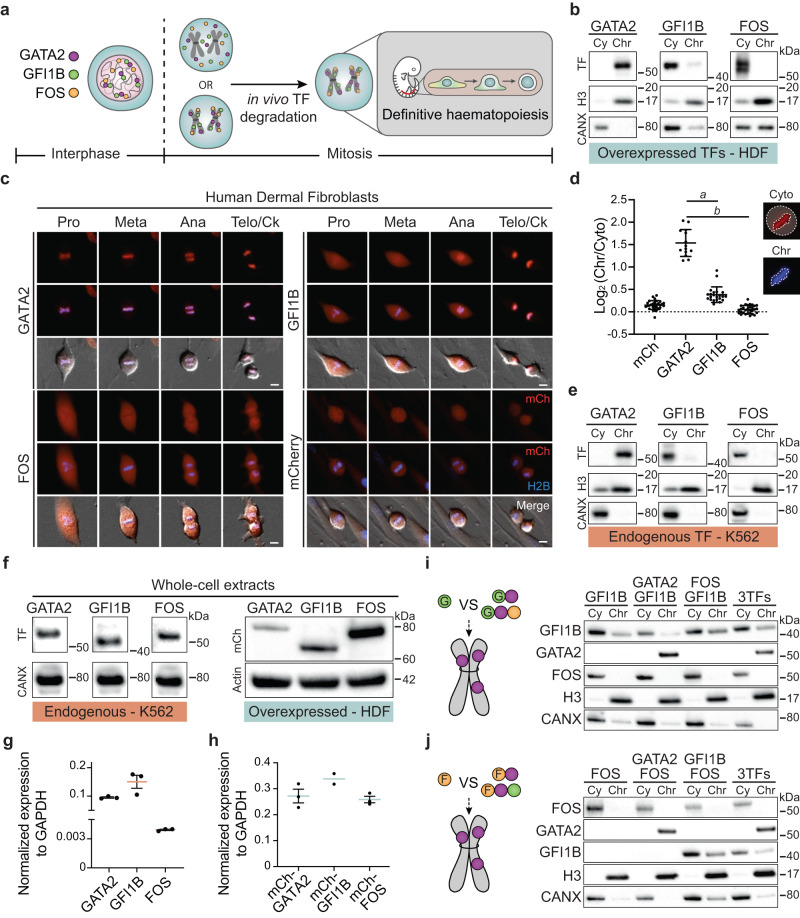
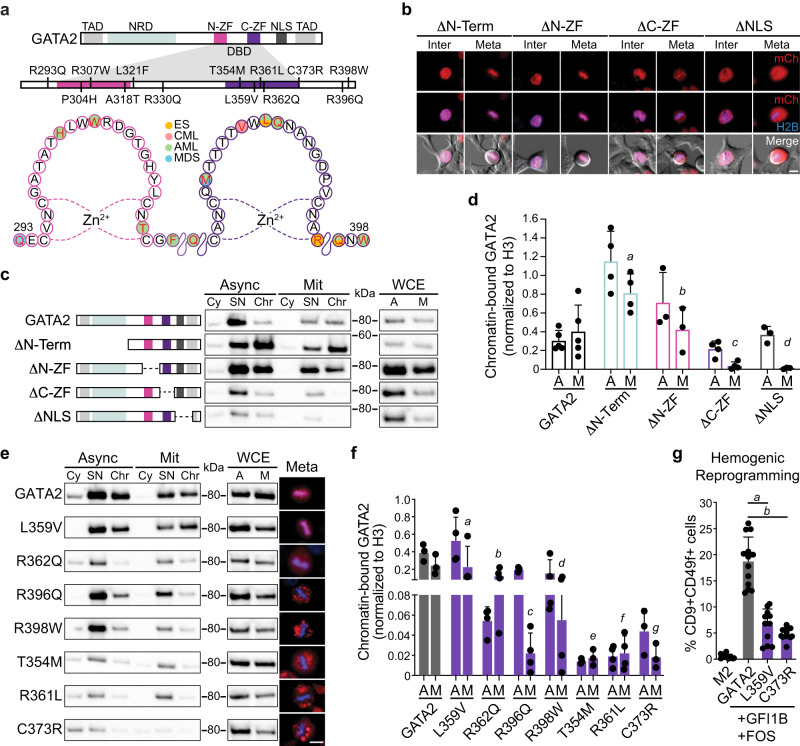
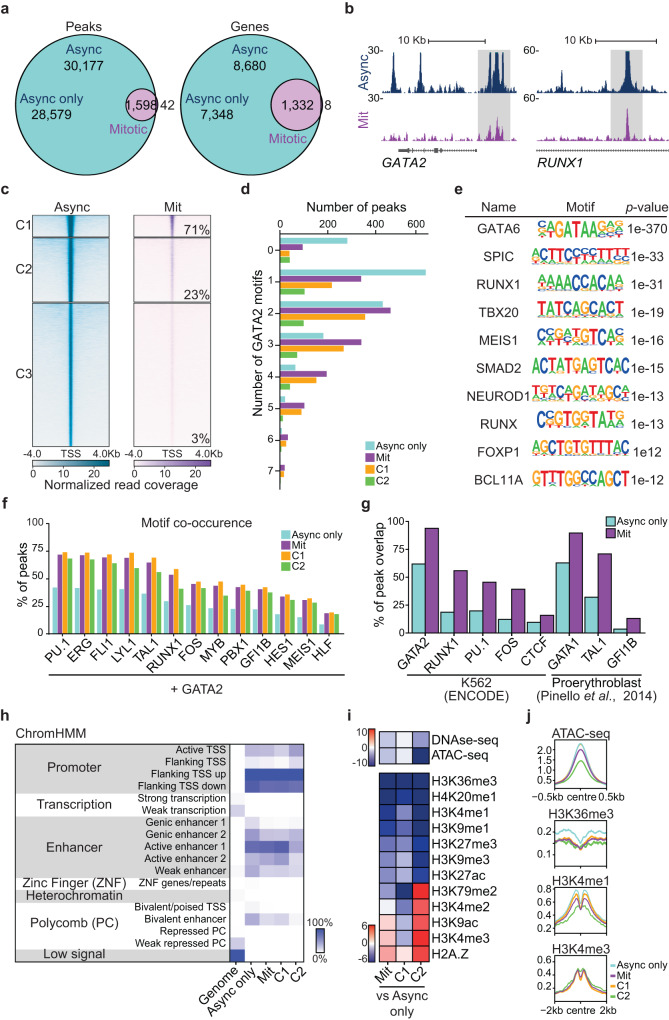
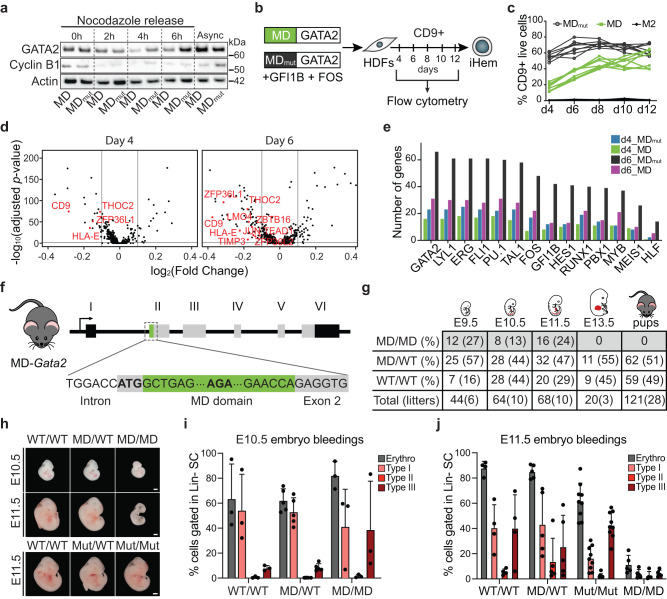
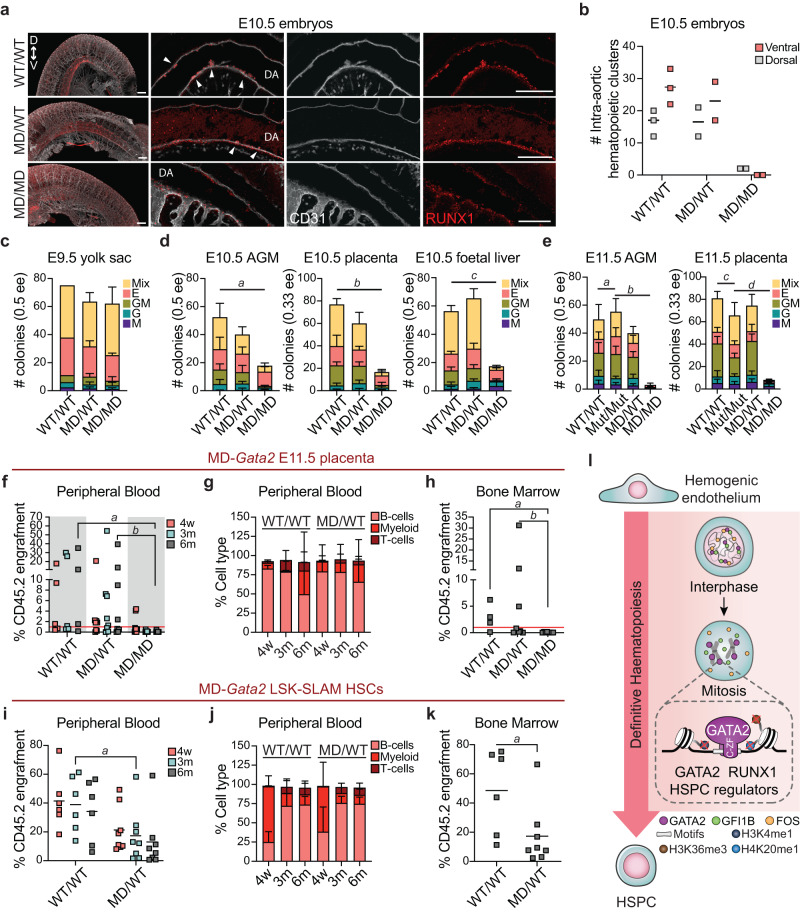
In mitosis, most transcription factors detach from chromatin, but some are retained and bookmark genomic sites. Mitotic bookmarking has been implicated in lineage inheritance, pluripotency and reprogramming. However, the biological significance of this mechanism in vivo remains unclear. Here, we address mitotic retention of the hemogenic factors GATA2, GFI1B and FOS during haematopoietic specification. We show that GATA2 remains bound to chromatin throughout mitosis, in contrast to GFI1B and FOS, via C-terminal zinc finger-mediated DNA binding. GATA2 bookmarks a subset of its interphase targets that are co-enriched for RUNX1 and other regulators of definitive haematopoiesis. Remarkably, homozygous mice harbouring the cyclin B1 mitosis degradation domain upstream Gata2 partially phenocopy knockout mice. Degradation of GATA2 at mitotic exit abolishes definitive haematopoiesis at aorta-gonad-mesonephros, placenta and foetal liver, but does not impair yolk sac haematopoiesis. Our findings implicate GATA2-mediated mitotic bookmarking as critical for definitive haematopoiesis and highlight a dependency on bookmarkers for lineage commitment.


Conflict of interest statement

The authors declare no competing interests.

Figures

Fig. 1
Fig. 1. GATA2 is retained at mitotic chromatin independently of cell context.
a Experimental approach to address mitotic bookmarking function of the hemogenic reprogramming transcription factors (TFs) GATA2, GFI1B and FOS, and their role in vivo for definitive haematopoiesis. b TF expression in the cytoplasmic (Cy) and chromatin-bound (Chr) protein fractions of mitotic human dermal fibroblasts (HDFs) expressing the indicated TF. Histone 3 (H3) and calnexin (CANX) were used as loading controls. kDA, kilodaltons. c Live-cell images of HDFs overexpressing mCherry (mCh)-TFs fusion proteins (red) during mitosis (Pro – prophase, Meta – metaphase, Telo/Ck – Telophase/Cytokinesis). Histone 2B (H2B)-mTurquoise (blue) signal shows DNA content. Mitotic events: n(GATA2) = 48, n(GFI1B) = 24, n(FOS) = 30, n(mCherry) = 137. Scale bars, 10 µm. d Quantification of the ratio between signal intensity of chromatin-retained and cytoplasm-localised TFs in metaphasic HDFs. n(mCherry)=30, n(GATA2) = 14, n(GFI1B) = 22, n(FOS) = 30. Mean ± SD is represented. Statistical significance was analysed by one-way ANOVA followed by Bonferroni’s multiple comparison test. a and b, p < 0.001. e Endogenous expression of GATA2, GFI1B and FOS in cytoplasmic and chromatin-bound fractions of mitotic K562 cells. H3 and CANX were used as loading controls. f Protein expression from asynchronous HDFs (overexpressed TFs, right panel) and K562 (endogenous TFs, left panel) whole-cell extracts. HDFs were transduced with mCh-TFs and the same number of mCh+ cells were FACS-purified for western blotting. CANX and Actin were used as loading controls. g Transcript levels of each endogenous TF in K562 cells. n = 3 biological independent samples per condition. Expression was normalised to GAPDH. h Transcript levels for overexpressed mCh-TFs in mCh+ FACS-purified HDFs. n(mCh-GATA2) = 3 technical replicates, n(mCh-GFI1B) = 2 technical replicates. (mCh-FOS) = 3 technical replicates. g, h Mean ± SD is represented. Expression was normalised to GAPDH. i, j Protein levels of GATA2, GFI1B and FOS in Cy and Chr fractions of mitotic HEK 293T cells when GFI1B (i) or FOS (j), were transduced individually or in combination with one or two additional TFs. Western blots were performed twice. Source data are provided as a Source Data file.
Fig. 2
Fig. 2. Point mutations in GATA2 C-terminal zinc finger associated with leukaemia and Emberger syndrome reduce mitotic retention.
a Representation of GATA2 domains highlighting leukaemia and Emberger syndrome (ES)-associated point mutations in the N- and C- terminal zinc fingers (ZF) of DNA-binding domain (DBD). TAD – transactivation domain. NRD – negative regulatory domain. NLS – nuclear localisation signal. CML – chronic myeloid leukaemia. AML – acute myeloid leukaemia. MDS – myelodysplastic syndrome. b Live-cell images of 293T cells overexpressing mCherry (mCh)-GATA2 deletion (Δ) constructs (red) excluding the N-terminal (amino acids 1-235), N-ZF (287–342), C-ZF (243–379) or NLS (380–440) in interphase (Inter) and metaphase (Meta). Mitotic events: n(ΔN-Terminal) = 395, n(ΔN-ZF) = 375, n(ΔC-ZF) = 100, n(ΔNLS) = 52. Scale bar, 10 µm. c, Protein expression in whole-cell extracts (WCE), cytoplasmic (Cy), soluble nucleus (SN) and chromatin-bound (Chr) fractions of both asynchronous (A, Async) and mitotic (M, Mit) 293T cells overexpressing deletion constructs. Representative blots were acquired with the same exposure time for asynchronous and mitotic cells. kDA, kilodaltons. d, Western blot quantifications of GATA2 deletions at Chr fraction in asynchronous and mitotic cells after normalising to H3. n(GATA2) = 5, n(ΔN-Term) = 4, n(ΔN-ZF) = 3, n(ΔC-ZF) = 4, n(ΔNLS) = 3. Statistical analysis performed by two-way ANOVA followed by Fisher’s LSD test and comparisons of mitotic retention of each deletion to GATA2 are shown. a, p = 0.005; b, p = 0.89, c and d, p = 0.01. e Protein expression of mCherry-fused GATA2 mutants in the Cy, SN and Chr protein fractions of asynchronous and mitotic 293T. Representative cells in metaphase are shown (right). Histone 2B (H2B)-mTurquoise signal (blue) indicates DNA content. Scale bar, 10 µm. f Quantification of GATA2 mutants at Chr fraction. n(GATA2) = 3, n(L359V) = 4, n(R362Q) = 4, n(R396Q) = 4, n(R398W) = 4, n(T354M) = 3, n(R361L) = 4, n(C373R) = 3. Statistical analysis performed by two-way ANOVA followed by Fisher’s LSD test and comparisons of mitotic retention of each mutant to GATA2 are shown. a, p = 0.86; b, p = 0.17, c and f, p = 0.01; d, p = 0.03; e and g, p = 0.02. g Hemogenic reprogramming efficiency (% CD9+CD49f+ cells) with GATA2, L359V or C373R, plus GFI1B and FOS. M2rtTA (M2) was used as control. n(M2) = 10, n(GATA2) = 13, n(L359V) = 11, n(C373R) = 11. Mean ± SD is represented. Statistical significance was analysed by one-way ANOVA followed by Bonferroni’s test. a and b, p < 0.001. Source data are provided as Source Data file.
Fig. 3
Fig. 3. GATA2 bookmarks a subset of interphasic target genes with roles in definitive haematopoiesis.
a Venn diagram showing the number of ChIP-seq GATA2 peaks and genes shared between asynchronous (Async) and mitotic K562 cells. Async only refers to non-bookmarked peaks and genes in asynchronous cells. b Gene tracks for GATA2 binding sites at GATA2 and RUNX1 loci showing both mitotic (Mit) bookmarked (grey) and asynchronous unique peaks. Kb – kilobase. c K-means clustering of Async (left) and Mit peaks (right). The percentage of mitotic (bookmarked) peaks overlapping with asynchronous peaks in each cluster is shown. The 42 mitotic-unique peaks are not shown. d Number of GATA2 motifs in Async only peaks, mitotic peaks and mitotic clusters 1 (C1) and 2 (C2). e De novo motif enrichment analysis for GATA2 mitotic bookmarked target sites. Top ten motifs are shown with respective p-values. f Percentage of GATA2 peaks where motifs for relevant HSPCs regulators are also present. g Percentage of overlap between GATA2 peaks and peaks for HSPC regulators from available ChIP-seq datasets. h Chromatin-state enrichment heatmap representing the percentage of genome occupancy of GATA2 per group of peaks. Scale represents the percentage of peaks at each genomic segment. TSS – Transcription start site. i Integration heatmap with histones marks, DNAse-seq and ATAC-seq data for K562 cells (ENCODE). Scale represents the accumulated sum differences across bins between Async only and mitotic peaks and clusters. j Histone marks and ATAC-seq profiles at peak summit (centre). Source data are provided as Source Data file.
Fig. 4
Fig. 4. GATA2 is required at the mitosis-to-G1 transition in vivo for embryonic development.
a Western blot analysis of GATA2 and cyclin B1 proteins in HEK 293T expressing GATA2 fused to the mitotic degradation (MD) domain of cyclin B1 or an inactive form (MDmut) before (0 h) and 2, 4 and 6 hours (h) after release from nocodazole arrest. Actin shown as loading control. Async – Asynchronous cells. Western blots were performed twice. kDA, kilodaltons. b Direct reprogramming strategy to convert human dermal fibroblast (HDFs) into induced hemogenic cells (iHem). HDFs were transduced with lentivirus encoding MD- or MDmut-GATA2, plus GFI1B and FOS factors, and the kinetics of CD9 activation was evaluated by flow cytometry. c Quantification of CD9 expression from day (d) 4 to d12. M2rtTA (M2) was used as control. d Volcano plots showing differential gene expression of GATA2 bookmarked genes at day 4 and 6 of reprogramming with MD-GATA2 and MDmut-GATA2. Relevant genes downregulated in MD-GATA2 condition (left) are highlighted in red. e Number of bookmarked differentially expressed genes between MD-GATA2 and MDmut-GATA2 conditions at d4 and d6, with binding sites for HSPC regulators. Upregulated genes in MDmut-GATA2 condition at d4 and d6 (d4_MDmut and d6_MDmut, respectively), and upregulated genes in MD-GATA2 at d4 and d6 (d4_MD and d6_MD, respectively) are shown. f Schematic representation of the mouse model developed to assess mitotic degradation of GATA2 in vivo by inserting the MD domain upstream Gata2 gene. g Frequency of homozygous (MD/MD), heterozygous (MD/WT) and wild-type (WT/WT) embryos at embryonic day (E) 9.5, E10.5, E11.5, E13.5 and pups, after crossing heterozygous mice. h Representative images of MD-Gata2 embryos at E10.5 and E11.5, and control MDmut-Gata2 embryos at E11.5. Scale bars, 1 mm. i, j Flow cytometry quantification of E10.5 (i) and E11.5 (j) erythroblasts after whole-embryo bleeding. Graphs show percentage of total erythroblasts (Erythro) or immature (type I) to mature (Type III) erythroblasts gated within lineage negative (Lin-) live single cell (SC) population. n(E10.5 WT/WT) = 3, n(E10.5 MD/WT) = 5, n(E10.5 MD/MD) = 3 n(E11.5 WT/WT) = 4, n(E11.5 MD/WT) = 5, n(E11.5 Mut/Mut) = 9, n(E11.5 MD/MD) = 5. Mean ± SD is shown. Source data are provided as Source Data file.
Fig. 5
Fig. 5. GATA2 bookmarking is required for definitive haematopoiesis.
a Immunohistochemistry images representing E10.5 wild-type (WT/WT), heterozygous (MD/WT) and homozygous (MD/MD) intra-aortic hematopoietic clusters expressing RUNX1 (red) and CD31 (white) in the ventral (V) or dorsal (D) sides of the dorsal aorta (DA). White arrowheads indicate clusters. Scale bars, 150 µm. b Number (#) of intra-aortic hematopoietic clusters per genotype. n(WT/WT) = 3, n(MD/WT) = 2, n(MD/MD) = 2 embryos. Mean is shown. ce Colony-forming units for E9.5 yolk sac (c), for E10.5 aorta-gonad-mesonephros (AGM), placenta and foetal liver (d) and for E11.5 AGM and placenta (e) cell suspensions. n(WT/WT) = 2-5, n(MD/WT) = 3−4, n(MD/MD) = 3−5, n(Mut/Mut) = 5 embryos. Mean ± SD is represented. Macrophage (M), granulocyte (G), granulocyte/macrophage (GM), erythroid (E) and mixed colonies (Mix) are shown per embryo equivalent (ee). d, e Statistical significance for the total number of colonies was calculated by one-way ANOVA followed by Bonferroni’s multiple comparison test. d, a, p = 0.01; b, p < 0.001, c, p = 0.002. e, a, b, c and d, p < 0.001. f, Percentage of donor chimerism (CD45.2+) 4 weeks (w), and 3 and 6 months (m) after transplantation with E11.5 placenta cells. Red line indicates 1% chimerism. n(WT/WT, 4w, 3m) = 5, n(WT/WT, 6m)=4, n(MD/WT, 4w, 3m, 6m) = 8, n(MD/MD, 4w, 3m, 6m) = 8. a, p = 0.011; b, p = 0.016. g, Quantification of donor contribution to myeloid and lymphoid lineages. Only mice with donor chimerism above 1% were considered. n(WT/WT, 4w, 3m, 6m) = 3, n(WT/WT, 6m) = 4, n(MD/WT, 4w, 3m) = 5, n(MD/WT, 6m) = 4. h Percentage of donor chimerism in bone marrow 6 months after transplantation. n(WT/WT) = 4, n(MD/WT) = 8, n(MD/MD) = 8. a, p = 0.023; b, p = 0.028. f, h Statistical significance at 6 months was calculated with Kruskal-Wallis test followed by uncorrected Dunn’s test. i Percentage of donor chimerism 4 weeks, 3 months and 6 months after competitive transplantation (see Supplementary Fig. 7, Methods). n(WT/WT) = 6, n(MD/WT) = 8. a, p = 0,029. j Quantification of donor contribution to blood lineages. n(WT/WT, 4w, 3m, 6m) = 6, n(MD/WT, 4w, 3m, 6m) = 8. k Percentage of donor chimerism in bone marrow 6 m after transplantation. n(WT/WT) = 6, n(MD/WT) = 8. a, p = 0.020. i, k Statistical significance was calculated with two-tailed Mann–Whitney test at 3 months (i) or at 6 months (k). l Proposed model for the role of GATA2 bookmarking for definitive haematopoiesis. HSPC, hematopoietic stem and progenitor cell. Source data are provided as Source Data file.

References

    1. Martínez-Balbás MA, Dey A, Rabindran SK, Ozato K, Wu C. Displacement of sequence-specific transcription factors from mitotic chromatin. Cell. 1995;83:29–38. doi: 10.1016/0092-8674(95)90231-7. - DOI - PubMed
    1. Terasaki M, et al. A new model for nuclear envelope breakdown. Mol. Biol. Cell. 2001;12:503–510. doi: 10.1091/mbc.12.2.503. - DOI - PMC - PubMed
    1. Palozola KC, et al. Mitotic transcription and waves of gene reactivation during mitotic exit. Science. 2017;358:119–122. doi: 10.1126/science.aal4671. - DOI - PMC - PubMed
    1. Djeghloul D, et al. Identifying proteins bound to native mitotic ESC chromosomes reveals chromatin repressors are important for compaction. Nat. Commun. 2020;11:1–15. doi: 10.1038/s41467-020-17823-z. - DOI - PMC - PubMed
    1. Soares MAF, Oliveira RA, Castro DS. Function and regulation of transcription factors during mitosis-to-G1 transition. Open Biol. 2022;12:1–11. doi: 10.1098/rsob.220062. - DOI - PMC - PubMed

Publication types