. 2023 Oct;20(10):1171-1185.
doi: 10.1038/s41423-023-01073-2. Epub 2023 Aug 14.

NAD+ salvage governs the immunosuppressive capacity of mesenchymal stem cells

Affiliations

NAD+ salvage governs the immunosuppressive capacity of mesenchymal stem cells

Jiankai Fang et al. Cell Mol Immunol. 2023 Oct.

Abstract

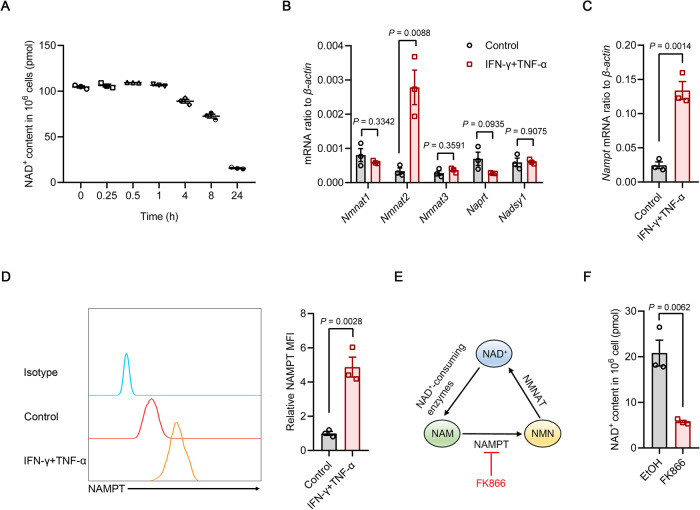
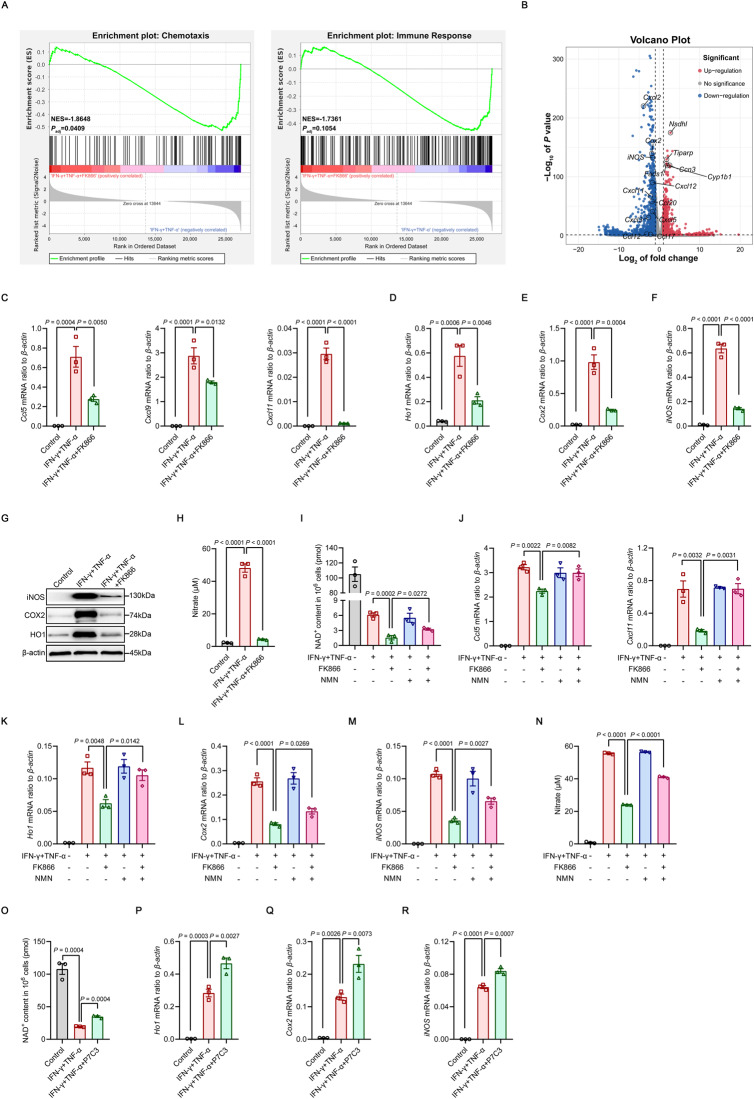
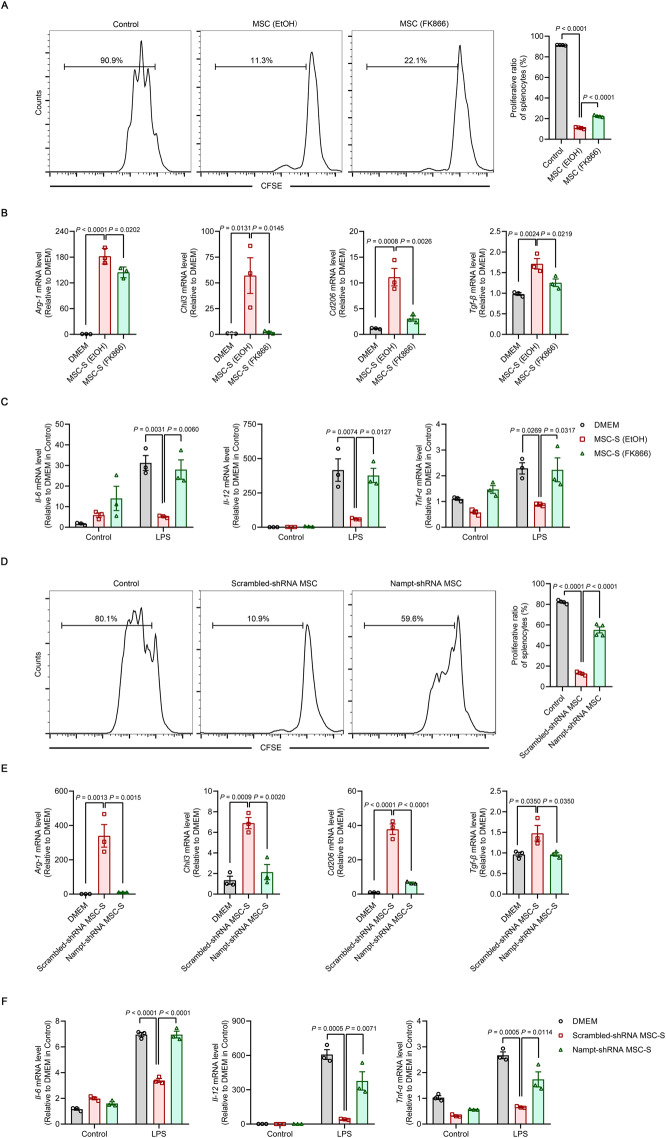
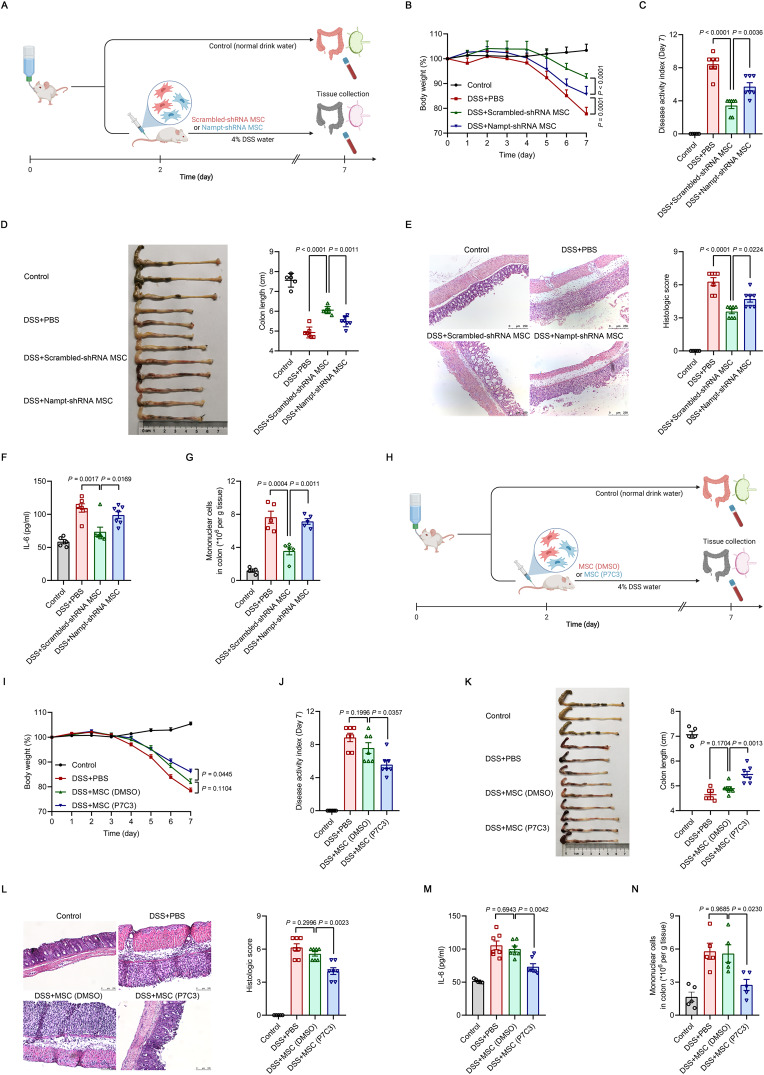
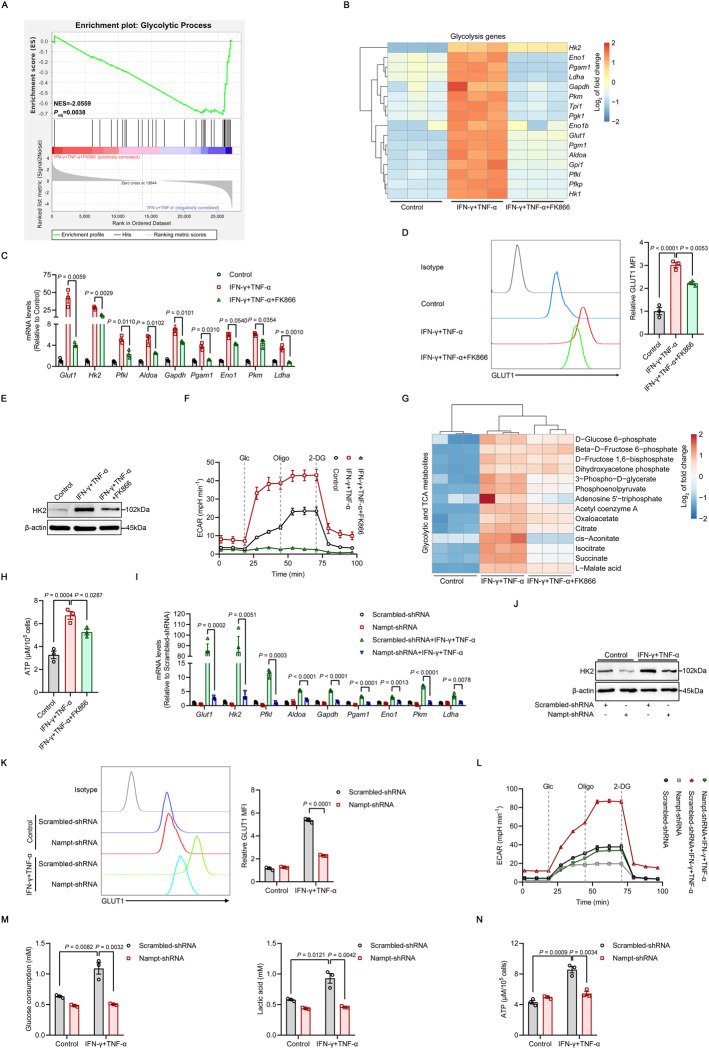
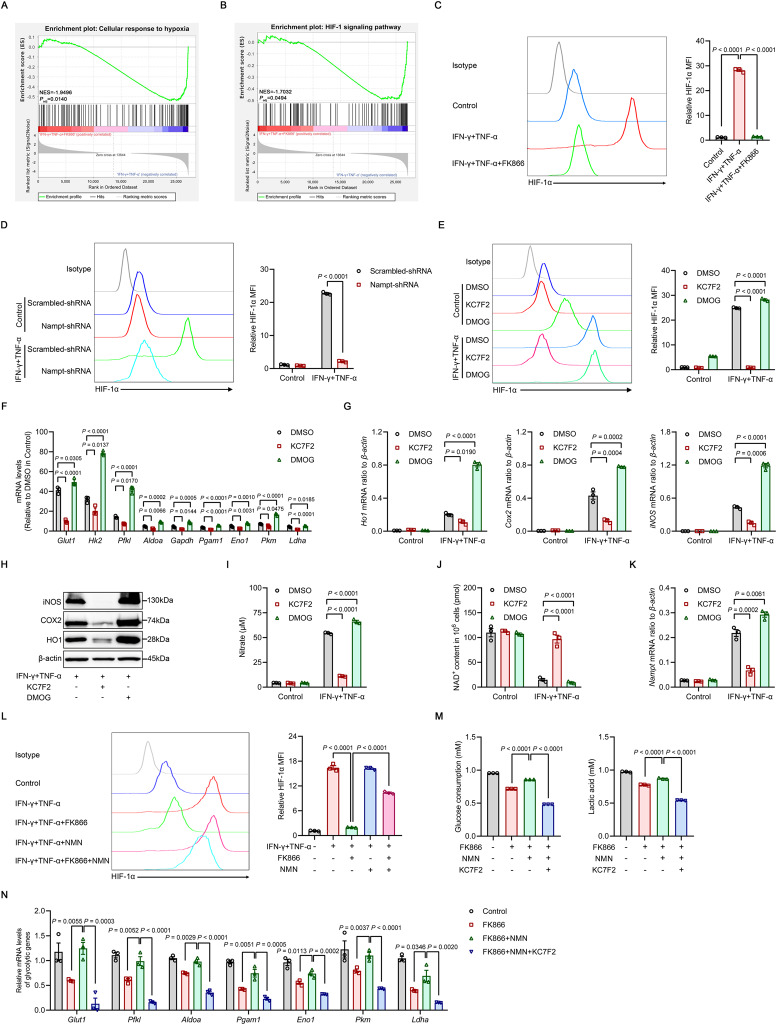
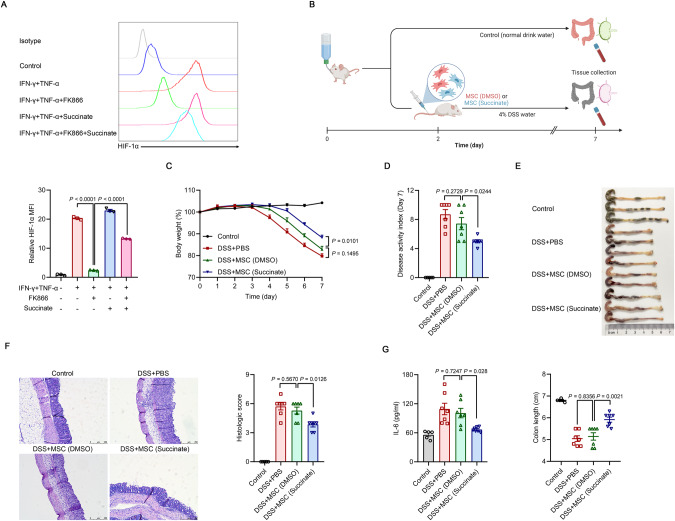
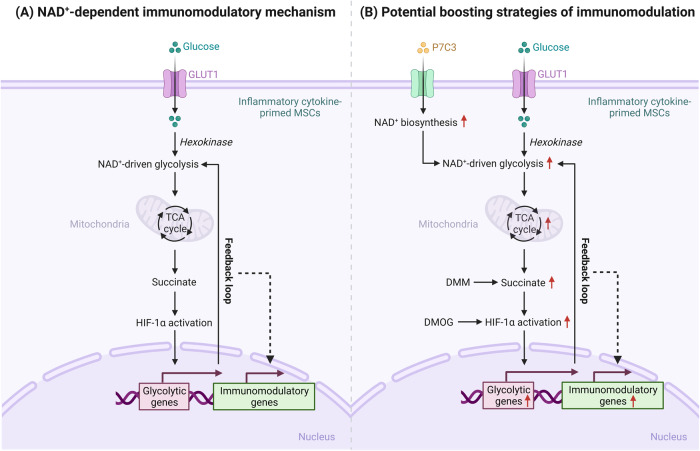
Mesenchymal stem/stromal cells (MSCs) possess robust immunoregulatory functions and are promising therapeutics for inflammatory disorders. This capacity is not innate but is activated or 'licensed' by inflammatory cytokines. The licensing mechanism remains unclear. Here, we examined whether inflammatory cytokines metabolically reprogrammed MSCs to confer this immunoregulatory capacity. In response to stimulation by inflammatory cytokines, MSCs exhibited a dramatic increase in the consumption of glucose, which was accompanied by an enhanced use of nicotinamide adenine dinucleotide (NAD+) and increased expression of nicotinamide phosphoribosyltransferase (NAMPT), a central enzyme in the salvage pathway for NAD+ production. When NAD+ synthesis was blocked by inhibiting or depleting NAMPT, the immunosuppressive function of MSCs induced by inflammatory cytokines was greatly attenuated. Consequently, when NAD+ metabolism in MSCs was perturbed, their therapeutic benefit was decreased in mice suffering from inflammatory bowel disease and acute liver injury. Further analysis revealed that NAMPT-driven production of NAD+ was critical for the inflammatory cytokine-induced increase in glycolysis in MSCs. Furthermore, the increase in glycolysis led to succinate accumulation in the tricarboxylic acid cycle, which led to hypoxia-inducible factor 1α (HIF-1α) stabilization and subsequently increased the transcription of key glycolytic genes, thereby persistently maintaining glycolytic flux. This study demonstrated that unlike its proinflammatory role in immune cells, NAD+ metabolism governs the anti-inflammatory function of MSCs during inflammation.

Keywords: Glycolysis; HIF-1α; Immunomodulation; Mesenchymal stem/stromal cells; NAD+ metabolism; Succinate.


Conflict of interest statement

The authors declare no competing interests.

Figures

Fig. 1
Fig. 1
The NAD+ salvage pathway is upregulated in inflammatory cytokine-primed MSCs. A NAD+ levels in MSCs stimulated with IFN-γ and TNF-α (10 ng/ml each) over time (n = 3). B The expression of NAD+-related biosynthetic enzymes in MSCs stimulated with IFN-γ and TNF-α (10 ng/ml each) for 24 h was assayed by quantitative real-time polymerase chain reaction (qRT‒PCR) (n = 3). C The expression of Nampt mRNA in MSCs stimulated with IFN-γ and TNF-α (10 ng/ml each) for 24 h was assayed by qRT‒PCR (n = 3). D Flow cytometric analysis of NAMPT protein expression in MSCs stimulated with IFN-γ and TNF-α (10 ng/ml each) for 24 h (n = 3). E Schematic representation of the NAD+ salvage pathway. F NAD+ levels in MSCs stimulated with IFN-γ and TNF-α (10 ng/ml each) for 24 h in the presence or absence of 50 nM FK866 (n = 3). MFI, mean fluorescence intensity. Values are presented as the mean ± SEM. Statistical analysis was performed by two-tailed unpaired t test
Fig. 2
Fig. 2
NAMPT function is required for the expression of chemokines and immunomodulatory genes in inflammatory cytokine-primed MSCs. A, B RNA-seq was performed on MSCs stimulated with IFN-γ and TNF-α (10 ng/ml each) for 24 h in the presence or absence of 50 nM FK866. The enrichment of chemotaxis and immune response genes was analyzed by GSEA. NES, normalized enrichment score; Padj, adjusted P value: two-tailed, corrected for multiple comparisons using the Benjamini‒Hochberg method (A). Volcano plot of differentially expressed chemokine and anti-inflammatory mediator genes (B) (n = 3). CF The expression of chemokines and immunomodulatory genes in MSCs stimulated with IFN-γ and TNF-α (10 ng/ml each) for 24 h in the presence or absence of 50 nM FK866 was assayed by qRT‒PCR (n = 3). G The expression of HO1, COX2, iNOS and β-actin (loading control) in MSCs stimulated with IFN-γ and TNF-α (10 ng/ml each) for 24 h in the presence or absence of 50 nM FK866 were determined by immunoblotting. H MSCs were stimulated with IFN-γ and TNF-α (10 ng/ml each) for 24 h in the presence or absence of 50 nM FK866, and the supernatants was assayed for nitrate by a modified Griess reagent (n = 3). I NAD+ levels in MSCs stimulated with IFN-γ and TNF-α (10 ng/ml each) with or without 50 nM FK866, 1 mM NMN or both for 24 h (n = 3). JM The expression of chemokines and immunomodulatory genes in MSCs stimulated with IFN-γ and TNF-α (10 ng/ml each) with or without 50 nM FK866, 1 mM NMN or both for 24 h were determined by qRT‒PCR (n = 3). N MSCs were stimulated with IFN-γ and TNF-α (10 ng/ml each) for 24 h in the presence or absence of 50 nM FK866 and 1 mM NMN, and the supernatants was assayed for nitrate by a modified Griess reagent (n = 3). O NAD+ levels in MSCs stimulated with IFN-γ and TNF-α (5 ng/ml each) for 24 h in the presence or absence of 5 μM P7C3 (n = 3). PR The expression of immunomodulatory genes in MSCs stimulated with IFN-γ and TNF-α (5 ng/ml each) for 24 h in the presence or absence of 5 μM P7C3 was assayed by qRT‒PCR (n = 3). Values are presented as the mean ± SEM. Statistical analysis was performed by one-way analysis of variance
Fig. 3
Fig. 3
NAMPT is required for the immunomodulatory effects of MSCs on T cells and macrophages. A Splenocytes were stained with CFSE and cocultured with EtOH-pretreated MSCs or FK866-pretreated MSCs (2.5 × 104 cells per well in 48-well plates) at a ratio of 1:20 (MSC:splenocyte) for 72 h in the presence of anti-CD3 (1 μg/ml). The reduction in the CFSE fluorescence intensity in splenocytes was detected by flow cytometry (n = 4). B Bone marrow-derived macrophages (BMDMs) were treated with different MSC supernatants (MSC-S) for 48 h. The expression of anti-inflammatory genes Arg-1, Chil3, Cd206 and Tgf-β in mature BMDMs was determined by qRT‒PCR (n = 3). C BMDMs were treated with different MSC-S for 48 h and subsequently treated with LPS (100 ng/mL) for 24 h. The expression of the proinflammatory genes Il-6, Il-12 and Tnf-α in inflammatory macrophages was determined by qRT‒PCR (n = 3). D Splenocytes were stained with CFSE and cocultured with Scrambled-shRNA or Nampt-shRNA MSCs (2.5 × 104 cells per well in 48-well plates) at a ratio of 1: 20 (MSC:splenocyte) for 72 h in the presence of anti-CD3 (1 μg/ml). The reduction in the CFSE fluorescence intensity in splenocytes was detected by flow cytometry (n = 4). E BMDMs were treated with different MSC-S for 48 h. The expression of the anti-inflammatory genes Arg-1, Chil3, Cd206 and Tgf-β in mature BMDMs was determined by qRT‒PCR (n = 3). F BMDMs were treated with different MSC-S for 48 h and subsequently treated with LPS (100 ng/mL) for 24 h. The expression of the proinflammatory genes Il-6, Il-12 and Tnf-α in inflammatory macrophages was determined by qRT‒PCR (n = 3). Values are presented as the mean ± SEM. Statistical analysis was performed by one-way analysis of variance
Fig. 4
Fig. 4
The beneficial effects of MSCs on inflammatory bowel disease (IBD) require NAMPT. A Treatment of DSS-induced IBD by Scrambled-shRNA or Nampt-shRNA MSCs (1 × 106) administered intravenously to mice on Day 2 after the beginning of DSS treatment. Mice in the control group received normal drinking water. On Day 7, the mice were euthanized, and the colons were excised. BD Body weight, disease activity index and colon length of IBD mice treated with Scrambled-shRNA or Nampt-shRNA MSCs. E Representative H&E-stained colon sections and histological scores of IBD mice treated with scrambled-shRNA or Nampt-shRNA MSCs. Scale bars, 250 μm. F Interleukin-6 (IL-6) levels in the serum of IBD mice treated with Scrambled-shRNA or Nampt-shRNA MSCs were assayed by enzyme-linked immunosorbent assay (ELISA) (Control: n = 5, DSS + PBS: n = 7, DSS+Scrambled-shRNA MSC: n = 7, DSS+Nampt-shRNA MSC: n = 7). G Mononuclear cell counts in the colon lamina propria of IBD mice treated with Scrambled-shRNA or Nampt-shRNA MSCs, as determined by flow cytometry (Control: n = 4, DSS + PBS: n = 5, DSS+Scrambled-shRNA MSC: n = 5, DSS+Nampt-shRNA MSC: n = 5). H Treatment of DSS-induced IBD by DMSO-pretreated MSCs or P7C3-pretreated MSCs (1 × 10⁵) administered intravenously to mice on Day 2 after the beginning of DSS treatment. Mice in the control group received normal drinking water. On Day 7, the mice were euthanized, and the colons were excised. IK Body weight, disease activity index and colon length of IBD mice administered DMSO-pretreated MSCs or P7C3-pretreated MSCs. L Representative H&E-stained colon sections and histological scores of IBD mice administered DMSO-pretreated MSCs or P7C3-pretreated MSCs. Scale bars, 100 μm. M IL-6 levels in the serum of IBD mice administered DMSO-pretreated MSCs or P7C3-pretreated MSCs were assayed by ELISA (Control: n = 5, DSS + PBS: n = 7, DSS + MSC (DMSO): n = 7, DSS + MSC (P7C3): n = 7). N Mononuclear cell counts in the colon lamina propria of IBD mice administered DMSO-pretreated MSCs or P7C3-pretreated MSCs, as determined by flow cytometry (Control: n = 5, DSS + PBS: n = 5, DSS + MSC (DMSO): n = 5, DSS + MSC (P7C3): n = 5). Values are presented as the mean ± SEM. Statistical analysis was performed by one-way analysis of variance
Fig. 5
Fig. 5
Primed MSCs require NAMPT to drive glycolysis. A, B RNA-seq was performed on MSCs stimulated with IFN-γ and TNF-α (10 ng/ml each) for 24 h in the presence or absence of 50 nM FK866. The enrichment of glycolytic genes process was analyzed by GSEA. NES, normalized enrichment score; Padj, adjusted P value: two-tailed, corrected for multiple comparisons using the Benjamini‒Hochberg method (A). Hierarchical clustering of glycolysis-related gene expression (B) (n = 3). C The expression of several glycolytic genes in MSCs stimulated with IFN-γ and TNF-α (10 ng/ml each) for 24 h in the presence or absence of 50 nM FK866 was assayed by qRT‒PCR (n = 3). D, E GLUT1 expression was examined by flow cytometry, and HK2 expression was examined by immunoblotting in MSCs stimulated with IFN-γ and TNF-α (10 ng/ml each) for 24 h in the presence or absence of 50 nM FK866 (n = 3). F Real-time ECAR changes in MSCs stimulated with IFN-γ and TNF-α (10 ng/ml each) combined with 50 nM FK866 for 24 h using the Seahorse Analyzer (n = 3). Glc, glucose; Oligo, oligomycin; 2-DG, 2-deoxyglucose. G Hierarchical clustering of targeted metabolomics in MSCs stimulated with IFN-γ and TNF-α (10 ng/ml each) for 24 h in the presence or absence of 50 nM FK866 (n = 3). H ATP levels in MSCs stimulated with IFN-γ and TNF-α (10 ng/ml each) for 24 h in the presence or absence of 50 nM FK866 (n = 3). I The expression of several glycolytic genes in MSCs that were transduced with Scrambled-shRNA or Nampt-shRNA and stimulated with IFN-γ and TNF-α (10 ng/ml each) for 24 h was assayed by qRT‒PCR (n = 3). J, K GLUT1 expression was examined by flow cytometry, and HK2 expression was examined by immunoblotting in MSCs transduced with Scrambled-shRNA or Nampt-shRNA and stimulated with IFN-γ and TNF-α (10 ng/ml each) for 24 h (n = 3). L Real-time ECAR changes in MSCs transduced with Scrambled-shRNA or Nampt-shRNA and stimulated with IFN-γ and TNF-α (10 ng/ml each) using a Seahorse Analyzer (n = 3). M Analysis of 24-h glucose consumption and lactate production in the supernatant of MSCs transduced with Scrambled-shRNA or Nampt-shRNA and stimulated with IFN-γ and TNF-α (10 ng/ml each) (n = 3). N ATP levels in MSCs transduced with Scrambled-shRNA or Nampt-shRNA and stimulated with IFN-γ and TNF-α (10 ng/ml each) for 24 h (n = 3). MFI, mean fluorescence intensity. Values are presented as the mean ± SEM. Statistical analysis was performed by one-way analysis of variance
Fig. 6
Fig. 6
HIF-1α mediates NAD+-driven glycolysis in inflammatory cytokine-primed MSCs. A, B RNA-seq was performed on MSCs stimulated with IFN-γ and TNF-α (10 ng/ml each) for 24 h in the presence or absence of 50 nM FK866. The enrichment of genes in the cellular response to hypoxia was determined by GO enrichment analysis (A), and the HIF-1 signaling pathway was determined by KEGG enrichment analysis (B) and analyzed by GSEA. NES, normalized enrichment score; Padj, adjusted P value: two-tailed, corrected for multiple comparisons using the Benjamini‒Hochberg method (n = 3). C HIF-1α expression was examined by flow cytometry in MSCs stimulated with IFN-γ and TNF-α (10 ng/ml each) for 24 h in the presence or absence of 50 nM FK866 (n = 3). D HIF-1α expression was examined by flow cytometry in MSCs transduced with Scrambled-shRNA or Nampt-shRNA and stimulated with IFN-γ and TNF-α (10 ng/ml each) for 24 h (n = 3). E HIF-1α expression was examined by flow cytometry in MSCs stimulated with IFN-γ and TNF-α (10 ng/ml each) for 24 h in the presence of 40 μM KC7F2 or 500 μM DMOG (n = 3). F, G The expression of glycolytic and immunomodulatory factors in MSCs stimulated with IFN-γ and TNF-α (10 ng/ml each) for 24 h in the presence of 40 μM KC7F2 or 500 μM DMOG was assayed by qRT‒PCR (n = 3). H The expression of HO1, COX2, iNOS and β-actin (loading control) determined by immunoblotting in MSCs stimulated with IFN-γ and TNF-α (10 ng/ml each) for 24 h in the presence of 40 μM KC7F2 or 500 μM DMOG. I MSCs were stimulated with IFN-γ and TNF-α (10 ng/ml each) for 24 h in the presence of 40 μM KC7F2 or 500 μM DMOG, and the supernatants were assayed for nitrate by a modified Griess reagent (n = 3). J NAD+ levels in MSCs stimulated with IFN-γ and TNF-α (10 ng/ml each) for 24 h in the presence of 40 μM KC7F2 or 500 μM DMOG (n = 3). K The expression of Nampt mRNA in MSCs stimulated with IFN-γ and TNF-α (10 ng/ml each) for 24 h in the presence of 40 μM KC7F2 or 500 μM DMOG was assayed by qRT‒PCR (n = 3). L HIF-1α levels in MSCs stimulated with IFN-γ and TNF-α (10 ng/ml each) and treated with or without 50 nM FK866, 1 mM NMN or both FK866 and NMN for 24 h (n = 3). M Analysis of 24-h glucose consumption and lactate production in the supernatant of MSCs stimulated with IFN-γ and TNF-α (10 ng/ml each) with or without 50 nM FK866, 1 mM NMN or 40 μM KC7F2 for 24 h (n = 3). N The expression of glycolytic genes in MSCs stimulated with IFN-γ and TNF-α (10 ng/ml each) and the indicated combinations of 50 nM FK866, 1 mM NMN or 40 μM KC7F2 for 24 h was assayed by qRT‒PCR (n = 3). MFI, mean fluorescence intensity. Values are presented as the mean ± SEM. Statistical analysis was performed by one-way analysis of variance
Fig. 7
Fig. 7
Succinate drives HIF-1α-mediated immunomodulation in inflammatory cytokine-primed MSCs. A HIF-1α levels in MSCs stimulated with IFN-γ and TNF-α (10 ng/ml each) with or without 50 nM FK866 or 20 mM succinate for 24 h (n = 3). B Treatment of DSS-induced IBD by DMSO-pretreated MSCs or succinate-pretreated MSCs (1 × 10⁵) administered intravenously to the mice on Day 2 after the beginning of DSS treatment. Mice in the control group received normal drinking water. On Day 7, the mice were euthanized, and the colons were excised. CE Body weight, disease activity index and colon length of IBD mice administered DMSO-pretreated MSCs or succinate-pretreated MSCs. F Representative H&E-stained colon sections and histological scores of IBD mice that were administered DMSO-pretreated MSCs or succinate-pretreated MSCs. Scale bars, 250 μm. G IL-6 levels in the serum of IBD mice administered DMSO-pretreated MSCs or succinate-pretreated MSCs were assayed by ELISA (Control: n = 5, DSS + PBS: n = 7, DSS + MSC (DMSO): n = 7, DSS + MSC (Succinate): n = 7). MFI, mean fluorescence intensity. Values are presented as the mean ± SEM. Statistical analysis was performed by one-way analysis of variance
Fig. 8
Fig. 8
A schematic model of NAD+ metabolism-mediated immunomodulation in MSCs. A Inflammatory cytokine-primed MSCs rely on NAMPT in the NAD+ salvage pathway to maintain intracellular NAD+ pools, which are indispensable for glycolytic flux. The increase in glycolysis is accompanied by the accumulation of succinate, an intermediate metabolite of the mitochondrial tricarboxylic acid (TCA) cycle, which stabilizes the hypoxia-inducible factor-1α (HIF-1α) protein, increases glycolytic gene transcription and consequently shapes the NAD+-dependent immunoregulatory properties of inflammatory cytokine-primed MSCs through this feedback loop. B Increasing NAD+ biosynthesis by promoting NAMPT activity with P7C3 may be a novel strategy for optimizing the therapeutic efficacy of MSCs in inflammatory conditions. Moreover, enhancing succinate accumulation with DMM and increasing HIF-1α levels with DMOG are alternative approaches to elevating the immunoregulatory potential of inflammatory cytokine-primed MSCs

References

    1. Uccelli A, Moretta L, Pistoia V. Mesenchymal stem cells in health and disease. Nat Rev Immunol. 2008;8:726–36. doi: 10.1038/nri2395. - DOI - PubMed
    1. Shi Y, Su J, Roberts AI, Shou P, Rabson AB, Ren G. How mesenchymal stem cells interact with tissue immune responses. Trends Immunol. 2012;33:136–43. doi: 10.1016/j.it.2011.11.004. - DOI - PMC - PubMed
    1. Shi Y, Hu G, Su J, Li W, Chen Q, Shou P, et al. Mesenchymal stem cells: a new strategy for immunosuppression and tissue repair. Cell Res. 2010;20:510–518. doi: 10.1038/cr.2010.44. - DOI - PubMed
    1. Wang Y, Chen X, Cao W, Shi Y. Plasticity of mesenchymal stem cells in immunomodulation: pathological and therapeutic implications. Nat Immunol. 2014;15:1009–16. doi: 10.1038/ni.3002. - DOI - PubMed
    1. Shi Y, Du L, Lin L, Wang Y. Tumour-associated mesenchymal stem/stromal cells: emerging therapeutic targets. Nat Rev Drug Discov. 2017;16:35–52. doi: 10.1038/nrd.2016.193. - DOI - PubMed

Publication types

LinkOut - more resources