. 2023 Aug 14;13(1):13201.
doi: 10.1038/s41598-023-39471-1.

Very high particulate pollution over northwest India captured by a high-density in situ sensor network

Affiliations

Very high particulate pollution over northwest India captured by a high-density in situ sensor network

Tanbir Singh et al. Sci Rep. .

Abstract

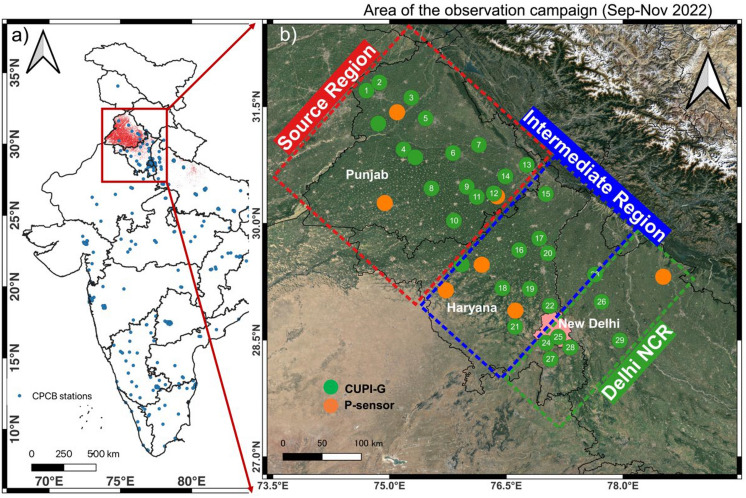
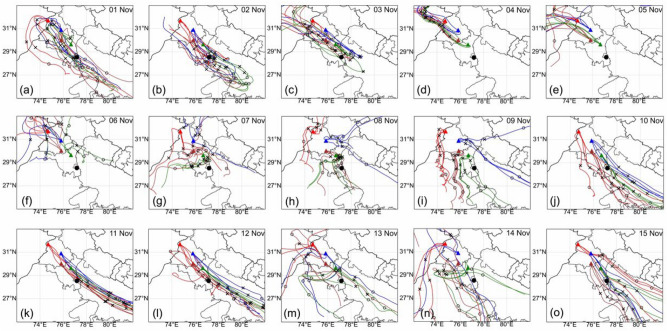
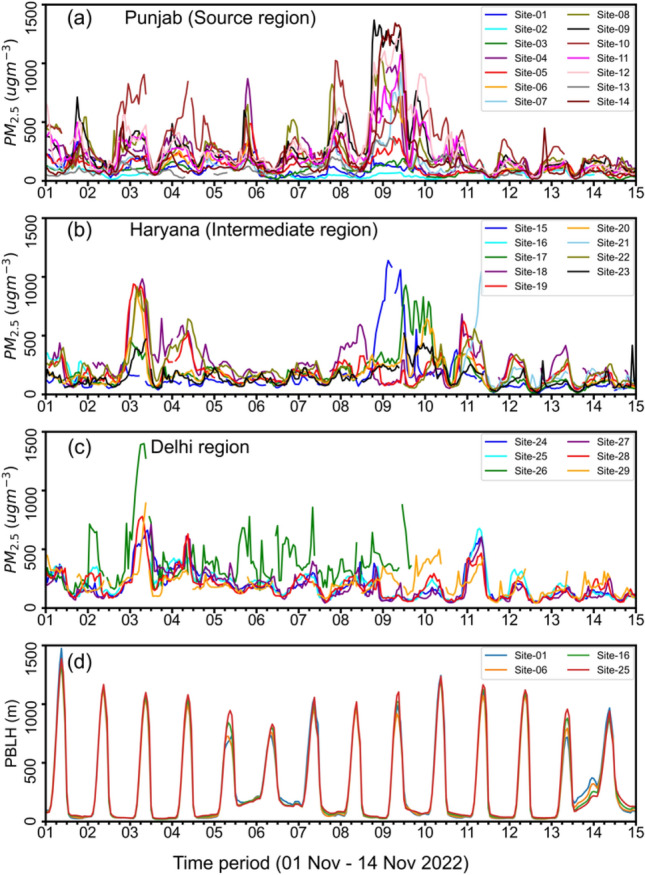
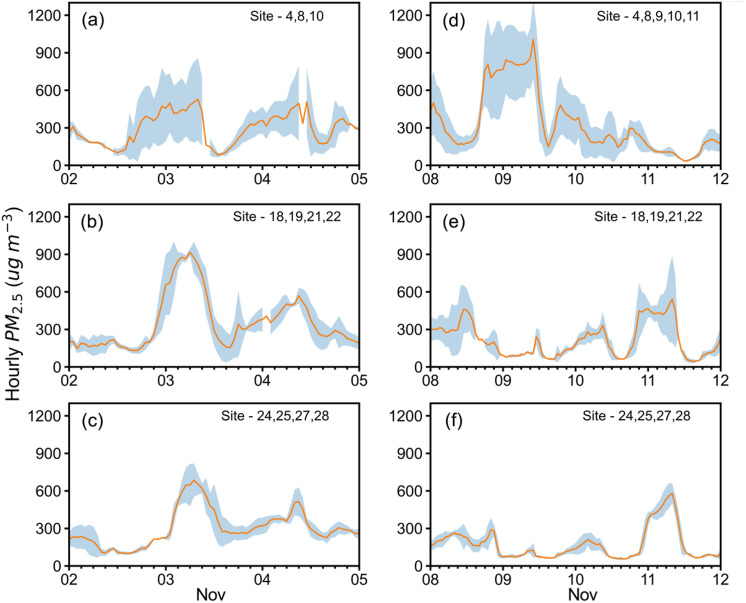
Exposure to particulate matter less than 2.5 µm in diameter (PM2.5) is a cause of concern in cities and major emission regions of northern India. An intensive field campaign involving the states of Punjab, Haryana and Delhi national capital region (NCR) was conducted in 2022 using 29 Compact and Useful PM2.5 Instrument with Gas sensors (CUPI-Gs). Continuous observations show that the PM2.5 in the region increased gradually from < 60 µg m-3 in 6-10 October to up to 500 µg m-3 on 5-9 November, which subsequently decreased to about 100 µg m-3 in 20-30 November. Two distinct plumes of PM2.5 over 500 µg m-3 are tracked from crop residue burning in Punjab to Delhi NCR on 2-3 November and 10-11 November with delays of 1 and 3 days, respectively. Experimental campaign demonstrates the advantages of source region observations to link agricultural waste burning and air pollution at local to regional scales.


Conflict of interest statement

The authors declare no competing interests.

Figures

Figure 1
Figure 1
Geographical location of the study area (north-west IGP) of the intensive campaign; the small red dot in left panel (a) depicts the VIIRS-based fire counts (FC) in 2022, and blue dots on the map () are the locations of CPCB air quality monitoring stations. In the right panel (b), green and orange circles show the location of CUPI-G and P-sensors respectively deployed for air pollutants measurements in a downwind direction in different regions (background depicts the mean landuse-landcover pattern from Google Earth Satellite Imagery). Sites marked by numbers, starting in west Punjab and ending in Delhi NCR, are used in the current analysis. The shapefile for India map is obtained from https://www.aigr.co.in/page/download (last accessed: 22 July 2023) and the plot is generated using QGIS (https://www.qgis.org/en/site/).
Figure 2
Figure 2
Daily mean PM2.5 concentrations over different regions, i.e., Punjab (a: source), Haryana (b: intermediate) and Delhi NCR (c) during the intensive field campaign (1 September–30 November 2022) along with daily VIIRS-based fire counts and over Punjab and Haryana and Global Satellite Mapping of Precipitation (GSMaP) based rainfall (d). PM2.5 concentrations along with aerosol optical depth (AOD) at individual sites are shown in Fig. S1.
Figure 3
Figure 3
HYSPLIT based 72-h forward trajectories of air mass at 500 m height started at 05:30 IST from four representative locations in source and intermediate region (site# 1: red, 6: blue, 10: dark brown and 16: green) in the source and intermediate region from 01 to 15 November 2022; where the colored triangles show the site location, cross and open circle indicates the location of airmass at 24-h back in time. The black dot shows the location of site 25 (JNU) at Delhi NCR, which is considered as a receptor site. The shapefile for Indian district boundary map is obtained from https://www.aigr.co.in/page/download (last accessed: 22 July 2023) and the plot is generated using QGIS (https://www.qgis.org/en/site/).
Figure 4
Figure 4
Hourly variations in PM2.5 during 01–14 November 2022, i.e., during the period of high CRB over different regions of Punjab (a: source), Haryana (b. intermediate) and Delhi NCR (c). The PBL height from ERA-5 are shown in the bottom panel (d).
Figure 5
Figure 5
HYSPLIT based 72-h backward trajectories of air masses at 500 m height arriving at Delhi NCR on two haze events (1: top row, on 3 November 2022; 2: bottom row, on 11 November 2022) along with Suomi NPP/VIIRS fire counts (red dots) of the previous 3 days. Fire counts over 3 previous days are shown to avoid gaps in active fire detection due to cloud cover on specific days. The cross and open circle show the location of airmass 24-h and 48-h back in time, respectively. The shapefile for Indian district boundary map is obtained from https://www.aigr.co.in/page/download (last accessed: 22 July 2023) and the plot is generated using QGIS (https://www.qgis.org/en/site/).
Figure 6
Figure 6
Hourly mean variations in PM2.5 along with standard deviation (shaded area) during two haze periods over different regions (a,d) in Punjab, (b,d) in Haryana, and (c,f) in Delhi NCR.
Figure 7
Figure 7
Time series of hourly mean PM2.5 concentrations at US Embassy, New Delhi (top right), in comparison with 4 of our sites in the Delhi NCR (red lines). A hand drawn reference line is depicted on each panel for easier comparison of the baselines at different sites (black lines). Location of the sites are marked on the map. The map is taken from https://www.google.com/maps.

References

    1. Badarinath KVS, Chand TRK, Prasad VK. Agriculture crop residue burning in the Indo-Gangetic Plains: A study using IRS-P6 AWiFS satellite data. Curr. Sci. 2006;91:1085–1089.
    1. Singh K. Act to save groundwater in Punjab: Its impact on water table, electricity subsidy and environment. Agric. Econ. Res. Rev. 2009;22:365–386.
    1. Tiwari VM, Wahr J, Swenson S. Dwindling groundwater resources in northern India, from satellite gravity observations. Geophys. Res. Lett. 2009;36(18):39401. doi: 10.1029/2009GL039401. - DOI
    1. Balwinder-Singh, et al. Tradeoffs between groundwater conservation and air pollution from agricultural fires in northwest India. Nat. Sustain. 2019;2:580–583. doi: 10.1038/s41893-019-0304-4. - DOI
    1. Sawlani R, et al. The severe Delhi SMOG of 2016: A case of delayed crop residue burning, coincident firecracker emissions, and atypical meteorology. Atmos. Pollut. Res. 2019;10:868–879. doi: 10.1016/j.apr.2018.12.015. - DOI