

Improving the Efficacy of ACR TI-RADS Through Deep Learning-Based Descriptor Augmentation
- PMID: 37580483
- PMCID: PMC10584788
- DOI: 10.1007/s10278-023-00884-z
Improving the Efficacy of ACR TI-RADS Through Deep Learning-Based Descriptor Augmentation
Abstract
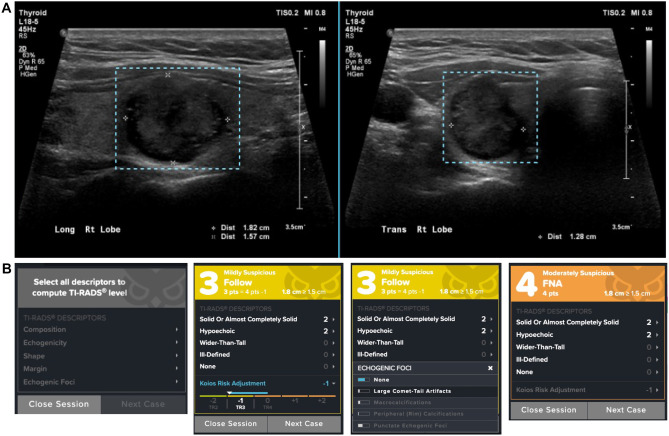
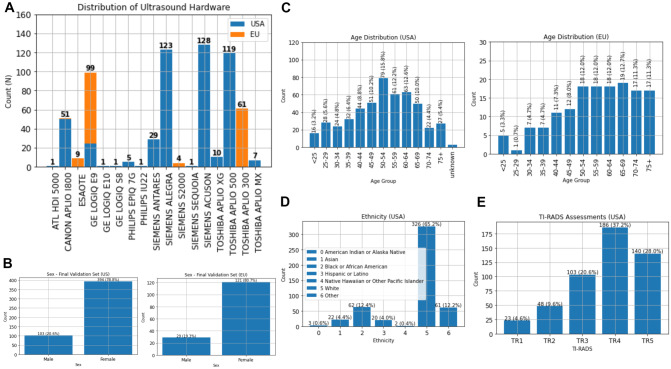
Thyroid nodules occur in up to 68% of people, 95% of which are benign. Of the 5% of malignant nodules, many would not result in symptoms or death, yet 600,000 FNAs are still performed annually, with a PPV of 5-7% (up to 30%). Artificial intelligence (AI) systems have the capacity to improve diagnostic accuracy and workflow efficiency when integrated into clinical decision pathways. Previous studies have evaluated AI systems against physicians, whereas we aim to compare the benefits of incorporating AI into their final diagnostic decision. This work analyzed the potential for artificial intelligence (AI)-based decision support systems to improve physician accuracy, variability, and efficiency. The decision support system (DSS) assessed was Koios DS, which provides automated sonographic nodule descriptor predictions and a direct cancer risk assessment aligned to ACR TI-RADS. The study was conducted retrospectively between (08/2020) and (10/2020). The set of cases used included 650 patients (21% male, 79% female) of age 53 ± 15. Fifteen physicians assessed each of the cases in the set, both unassisted and aided by the DSS. The order of the reading condition was randomized, and reading blocks were separated by a period of 4 weeks. The system's impact on reader accuracy was measured by comparing the area under the ROC curve (AUC), sensitivity, and specificity of readers with and without the DSS with FNA as ground truth. The impact on reader variability was evaluated using Pearson's correlation coefficient. The impact on efficiency was determined by comparing the average time per read. There was a statistically significant increase in average AUC of 0.083 [0.066, 0.099] and an increase in sensitivity and specificity of 8.4% [5.4%, 11.3%] and 14% [12.5%, 15.5%], respectively, when aided by Koios DS. The average time per case decreased by 23.6% (p = 0.00017), and the observed Pearson's correlation coefficient increased from r = 0.622 to r = 0.876 when aided by Koios DS. These results indicate that providing physicians with automated clinical decision support significantly improved diagnostic accuracy, as measured by AUC, sensitivity, and specificity, and reduced inter-reader variability and interpretation times.
Keywords: Artificial intelligence; Clinical decision support; Diagnostic workflows; TI-RADS; Thyroid ultrasound.
© 2023. The Author(s) under exclusive licence to Society for Imaging Informatics in Medicine.
Conflict of interest statement
Edward G. Grant was financially compensated for his time as a reader in this study.
Iñaki Arguelles was financially compensated for his time as a reader in this study.
Jordi Reverter was financially compensated for his time as a reader in this study.
Michael D. Beland was financially compensated for his time as a reader in this study.
Ross W. Filice was financially compensated for his time as a reader in this study.
Lev Barinov is a scientific and clinical advisor at Koios Medical.
Ajit Jairaj is an employee of Koios Medical.
No other authors have any disclosures.
Figures


References
-
- Davies, L., & Welch, H. G. (2006). Increasing incidence of thyroid cancer in the United States, 1973–2002. JAMA. 2006;295(18):2164–2167. 10.1001/jama.295.18.2164 - PubMed
Publication types
MeSH terms
Grants and funding
LinkOut - more resources
Full Text Sources
