Clinical Trial
. 2023 Sep;29(9):2366-2374.
doi: 10.1038/s41591-023-02507-0. Epub 2023 Aug 14.

Cerebellar deep brain stimulation for chronic post-stroke motor rehabilitation: a phase I trial

Affiliations
Clinical Trial

Cerebellar deep brain stimulation for chronic post-stroke motor rehabilitation: a phase I trial

Kenneth B Baker et al. Nat Med. 2023 Sep.

Abstract

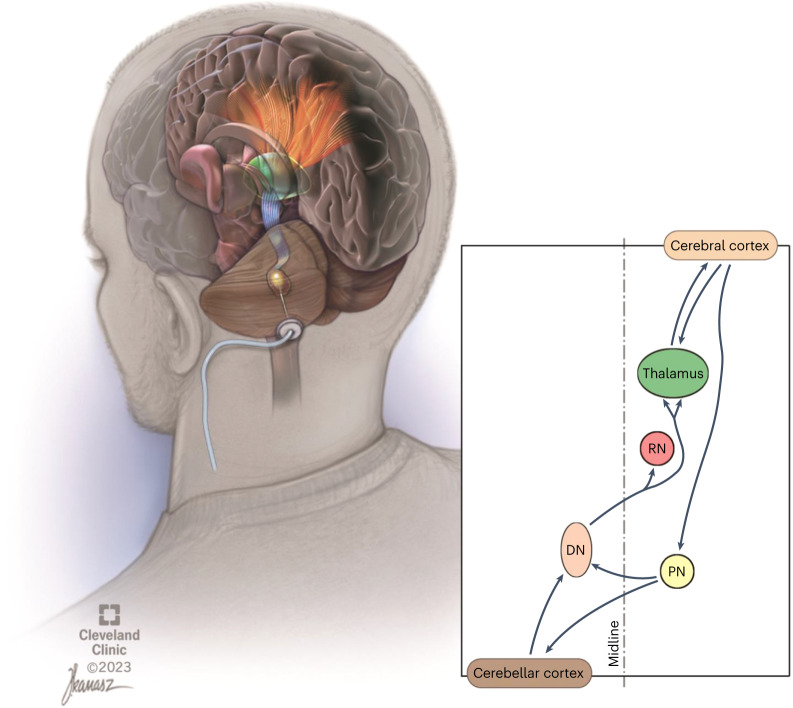
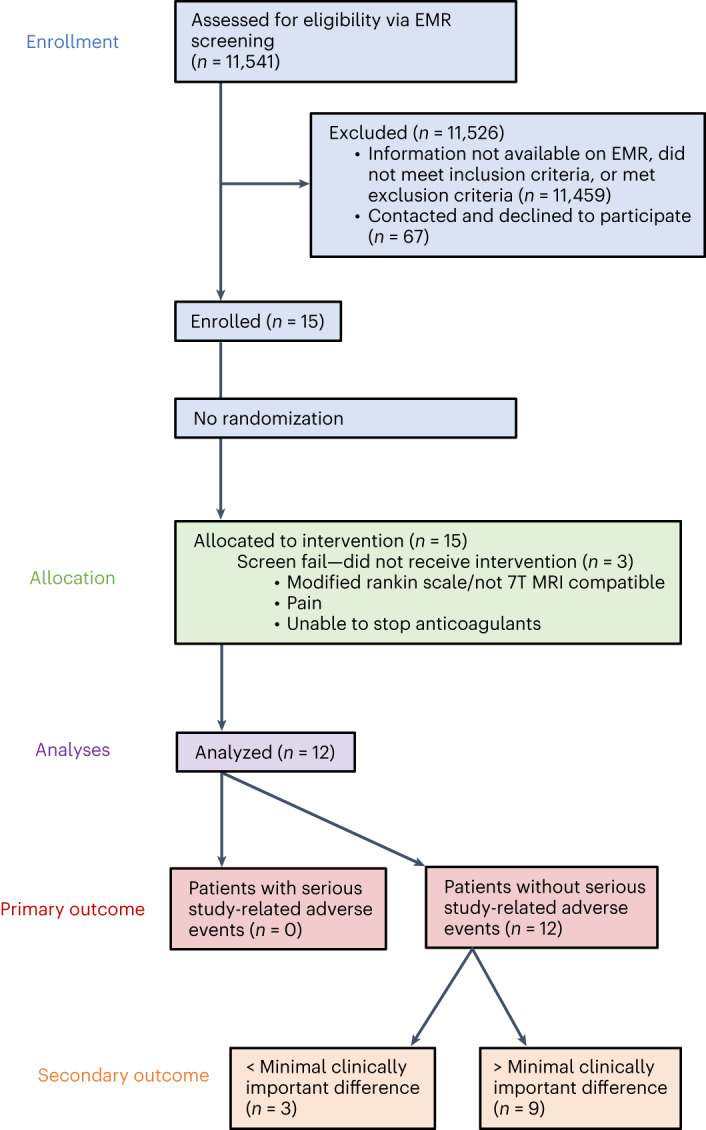
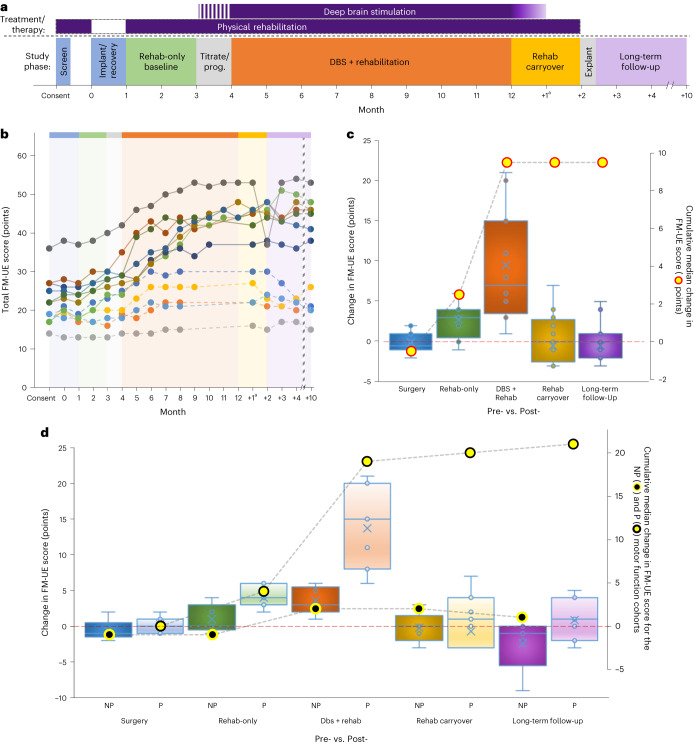
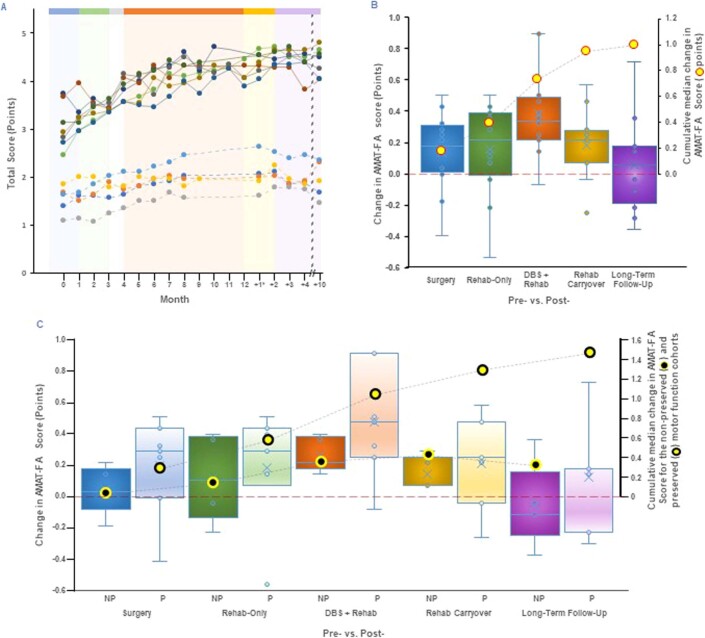
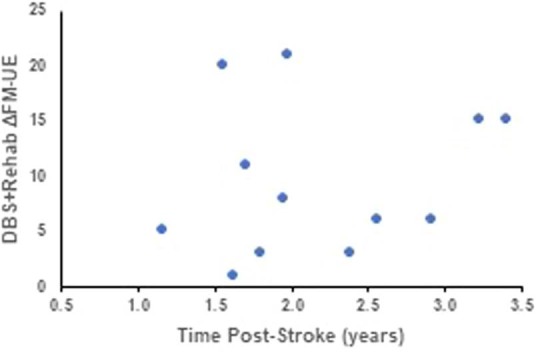
Upper-extremity impairment after stroke remains a major therapeutic challenge and a target of neuromodulation treatment efforts. In this open-label, non-randomized phase I trial, we applied deep brain stimulation to the cerebellar dentate nucleus combined with renewed physical rehabilitation to promote functional reorganization of ipsilesional cortex in 12 individuals with persistent (1-3 years), moderate-to-severe upper-extremity impairment. No serious perioperative or stimulation-related adverse events were encountered, with participants demonstrating a seven-point median improvement on the Upper-Extremity Fugl-Meyer Assessment. All individuals who enrolled with partial preservation of distal motor function exceeded minimal clinically important difference regardless of time since stroke, with a median improvement of 15 Upper-Extremity Fugl-Meyer Assessment points. These robust functional gains were directly correlated with cortical reorganization evidenced by increased ipsilesional metabolism. Our findings support the safety and feasibility of deep brain stimulation to the cerebellar dentate nucleus as a promising tool for modulation of late-stage neuroplasticity for functional recovery and the need for larger clinical trials. ClinicalTrials.gov registration: NCT02835443 .


Conflict of interest statement

A.G.M. serves as Chief Medical Officer and Chair of the Scientific Advisory Board for Enspire DBS Therapy and is paid with stock options. As the inventor, A.G.M. will receive portions of commercialization and/or Cleveland Clinic Foundation stock revenue and payments through Cleveland Clinic Foundation with fees deducted. B.H. serves as a paid member of the DMC for the corresponding phase I/II study (RESTORE). S.L.W. serves as a member of the Scientific Advisory Board and is a paid consultant to Enspire DBS Therapy. J.C. also serves as a paid consultant, but the agreement is with MetroHealth, and J.C. is their designated representative. J.C. is also a member of the Scientific Advisory Board. K.B. serves on the Scientific Advisory Board and is paid with stock options. In addition, A.B.R. is a paid consultant to Enspire DBS Therapy. Enspire DBS Therapy partially sponsored the study and had access to the safety, feasibility and secondary outcome measures. The company had no role in the drafting or editing of this manuscript.

Figures

Fig. 1
Fig. 1. Illustrated overview of dentatothalamocortical pathway depicting a single deep brain stimulation lead implanted in the left dentate nucleus (brown).
The crossed dentatothalamic projections (blue in upper-left illustration) terminate across multiple contralateral thalamic (green) nuclei that, in turn, project (orange), to broad regions of cerebral cortex. The dentatothalamocortical pathway represents the ascending component of a robust, reciprocal loop interconnecting the cerebral cortex with the contralateral cerebellar hemisphere. DN is shown in brown. RN, red nucleus; PN, pontine nuclei.
Fig. 2
Fig. 2
CONSORT diagram and outcomes for an open-label, single-arm phase I study of DBS to enhance post-stroke rehabilitation. EMR, electronic medical record.
Fig. 3
Fig. 3. Trial overview and trial-related data for the FM-UE.
a, Overall design of the phase I trial. Study phase color shading is used here and in Extended Data Fig. 1 and Supplementary Fig. 3. b, Individual FM-UE scores for each participant across the trial. The absence of a marker for a particular month (DBS + rehab phase) signifies that the participant met the criteria for DBS + rehab discontinuation and transitioned to the carryover phase. Dashed lines denote participants classified as non-preserved (NP) distal extremity motor function at enrollment. Note that the interconnecting lines are provided solely as a visual aid. c, Box-and-whisker plots representing the change scores (left y axis) for each of the surgical (month 1 minus 0), rehab-only (month 3 minus 1), DBS + rehab (month 8–12 (maximum achieved) minus 4), rehab carryover (month ‘+2’ minus month 8–12) and long-term follow-up (month ‘+10’ minus 8–12) trial phases. A score of zero signifies no change in impairment for that phase, with higher values reflecting improvement (that is, decreased impairment). The overlaid line plot represents the cumulative median change (right y axis) across the trial (n = 12 independent participants; two-sided Wilcoxon signed-rank test; *P = 0.004; **P < 0.001). d, Box-and-whisker change plots and cumulative line plots as a function of NP versus preserved (P) baseline distal extremity motor function. The overlaid line plots show the cumulative change (right y axis) observed across the trial (NP, black-filled, yellow circle; P: yellow-filled, black circle; n = 12 independent participants). For both c and d, boxes depict the median (horizontal line) within quartiles 1–3 (bounds of box). Whiskers extend to minimum and maximum values. Blue circles represent individual participant data points, while the blue ‘X’ depicts the average. aAs described in the text, the DBS + rehab phase was a minimum of 4 months but extended up to 8 months for participants who showed ongoing improvement. As such, the ‘+1’ time point reflects the measurement taken 1 month after DBS was turned OFF regardless of the DBS + rehab phase duration. The timing of all subsequent follow-up assessments was re-indexed to the final month of DBS + rehab.
Fig. 4
Fig. 4. Change in brain metabolism associated with DN-DBS combined with rehabilitation and relationship to treatment-related changes in arm function.
a, Magnetic resonance imaging (MRI) overlayed by PET from a 58-year-old male participant with a right hemisphere stroke lesion. The ipsilesional motor-associated cortical regions are identified as: primary motor (M1), fuchsia; primary somatosensory (S1), green; pre-supplementary area (pre-SMA), blue; dorsal pre-motor, red; ventral pre-motor, cyan; SMA, yellow. b, In the same participant shown in a, the average ΔSUVR adjusted for uptake time in response to DN-DBS combined with rehabilitation in the ipsilesional motor-associated cortical regions is shown. c, The change in brain metabolism in response to DN-DBS combined with rehabilitation in perilesional and ipsilesional motor-associated cortical regions for all participants. Linear mixed-effects models were used to test for significant change in the mean SUVR between rehab-only and rehab-carryover phases of the trial, with time point and 18F-FDG uptake time (that is, time between 18-FDG injection and start of PET scan) as fixed effects, with participant as the random effect intercept, and applying the default unstructured covariance structure. The box is the median and interquartile range, the whiskers are the maximum and minimum of the average ΔSUVR adjusted for uptake time, n = 11 participants. Two-sided P values with no adjustments for multiple comparison: perilesional P = 0.007, M1 P = 0.007, S1 P = 0.002, pre-SMA P = 0.0002, dorsal pre-motor P = 0.004, ventral pre-motor P = 0.0006, SMA P = 0.08. *P < 0.05, **P < 0.001. d, A significant association was identified between change in brain metabolism and change in arm function (as measured by ΔAMAT) in ipsilesional ventral pre-motor cortex. The line is the linear fit adjusting for uptake time and the error bands are the confidence intervals. F-statistic P = 0.04. Leave-one-out cross-validation: root mean squared error = 0.197; R2 = 0.247; mean absolute error = 0.176.
Extended Data Fig. 1
Extended Data Fig. 1. Changes in Participant AMAT-FA.
a) Monthly AMAT Functional Ability scores depicted as in Fig. 3b. b) Box-and-whisker plots representing the phase-specific change scores for the AMAT Functional Ability subscale as per Fig. 3c. c) Change and cumulative line plots for the AMAT Functional Ability subscale separated by preservation of distal function at baseline as per Fig. 3d. Boxes depict the median (horizontal line) within quartile 1–3 (bounds of box). Whiskers extend to minimum and maximum values. Blue circles within each box-and-whisker plot represent individual participant data points, while the blue ‘x’ shows the average for each condition (n = 12 independent subjects; two-sided Wilcoxon signed rank test; *p = 0.016; **p < 0.001).
Extended Data Fig. 2
Extended Data Fig. 2. Participant Time post-stroke and DBS-related changes in FM-UE.
Relationship between DBS-related change in FM-UE and time post-stroke for all participants. The data do not support an effect of time post-stroke on potential motor benefit.

References

    1. Tsao CW, et al. Heart Disease and Stroke Statistics-2022 update: a report from the American Heart Association. Circulation. 2022;145:e153–e639. doi: 10.1161/CIR.0000000000001052. - DOI - PubMed
    1. Kim, S. Y. & Jones, T. A. Lesion size-dependent synaptic and astrocytic responses in cortex contralateral to infarcts in middle-aged rats. Synapse64, 659–671 (2010). - PMC - PubMed
    1. Biernaskie J, Chernenko G, Corbett D. Efficacy of rehabilitative experience declines with time after focal ischemic brain injury. J. Neurosci. 2004;24:1245–1254. doi: 10.1523/JNEUROSCI.3834-03.2004. - DOI - PMC - PubMed
    1. Dromerick AW, et al. Critical Period After Stroke Study (CPASS): a phase II clinical trial testing an optimal time for motor recovery after stroke in humans. Proc. Natl Acad. Sci. USA. 2021;118:e2026676118. doi: 10.1073/pnas.2026676118. - DOI - PMC - PubMed
    1. Nieto-Sampedro M, Nieto-Diaz M. Neural plasticity: changes with age. J. Neural Transm. 2005;112:3–27. doi: 10.1007/s00702-004-0146-7. - DOI - PubMed

Publication types

Associated data