. 2023 Aug;5(8):1303-1318.
doi: 10.1038/s42255-023-00857-0. Epub 2023 Aug 14.

Metabolic profiling stratifies colorectal cancer and reveals adenosylhomocysteinase as a therapeutic target

Affiliations

Metabolic profiling stratifies colorectal cancer and reveals adenosylhomocysteinase as a therapeutic target

Johan Vande Voorde et al. Nat Metab. 2023 Aug.

Abstract

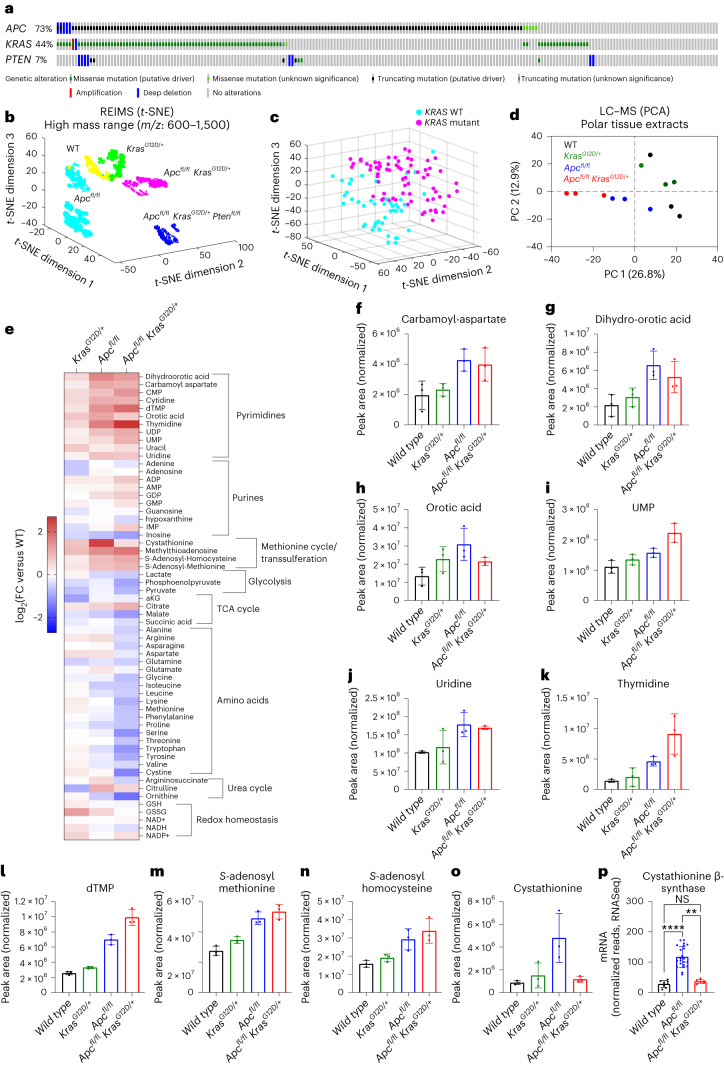
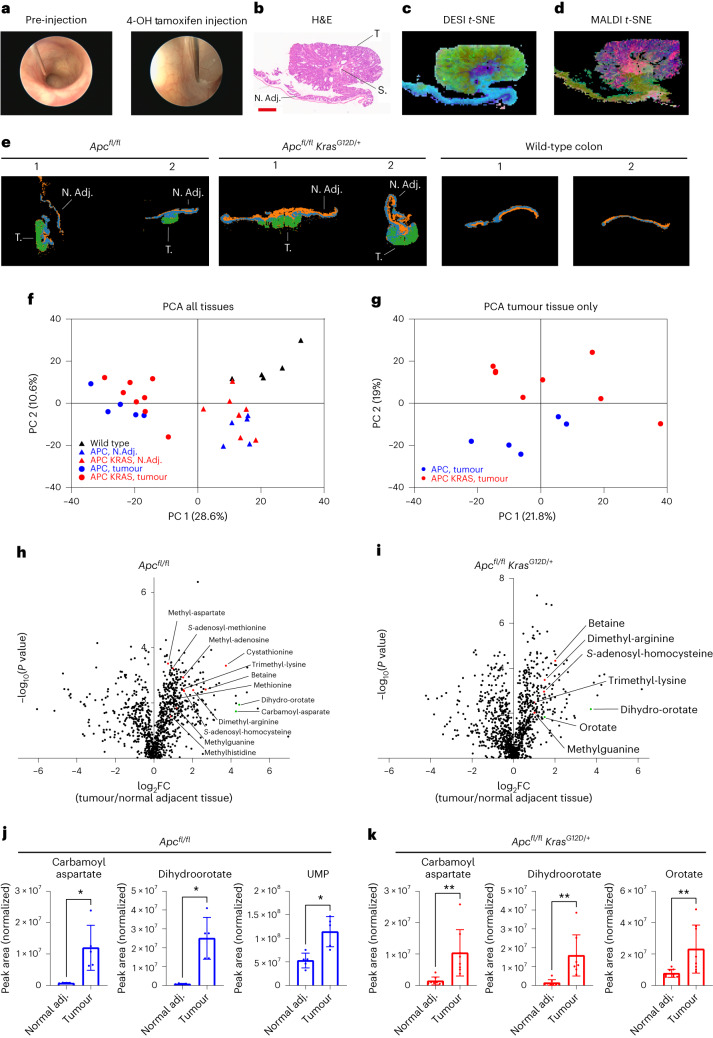
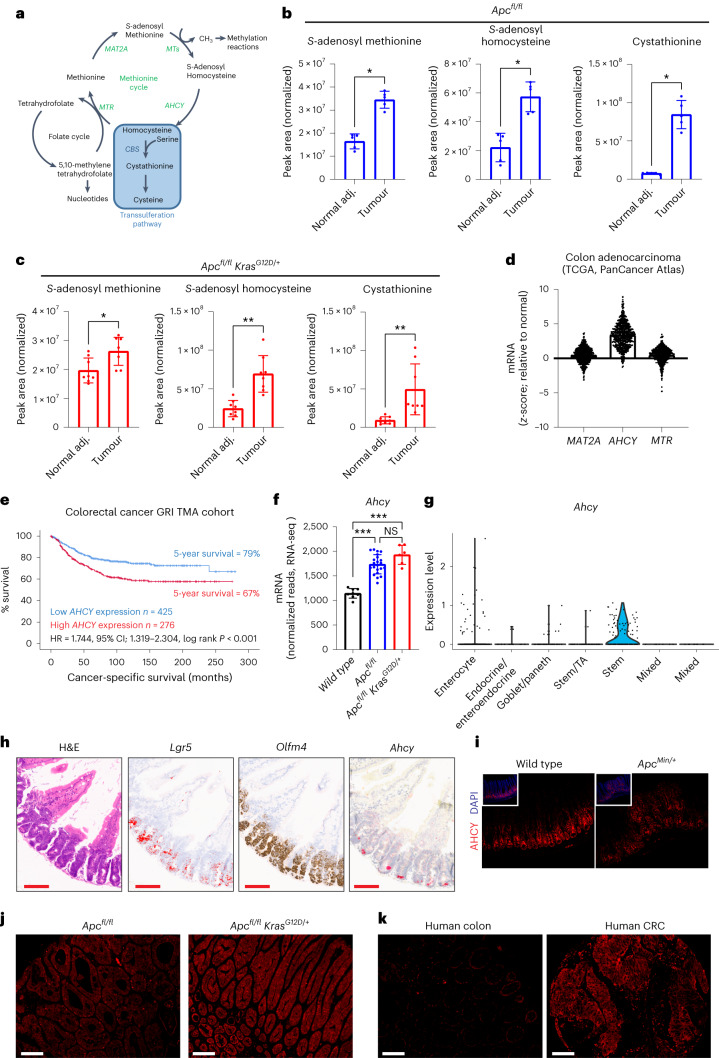
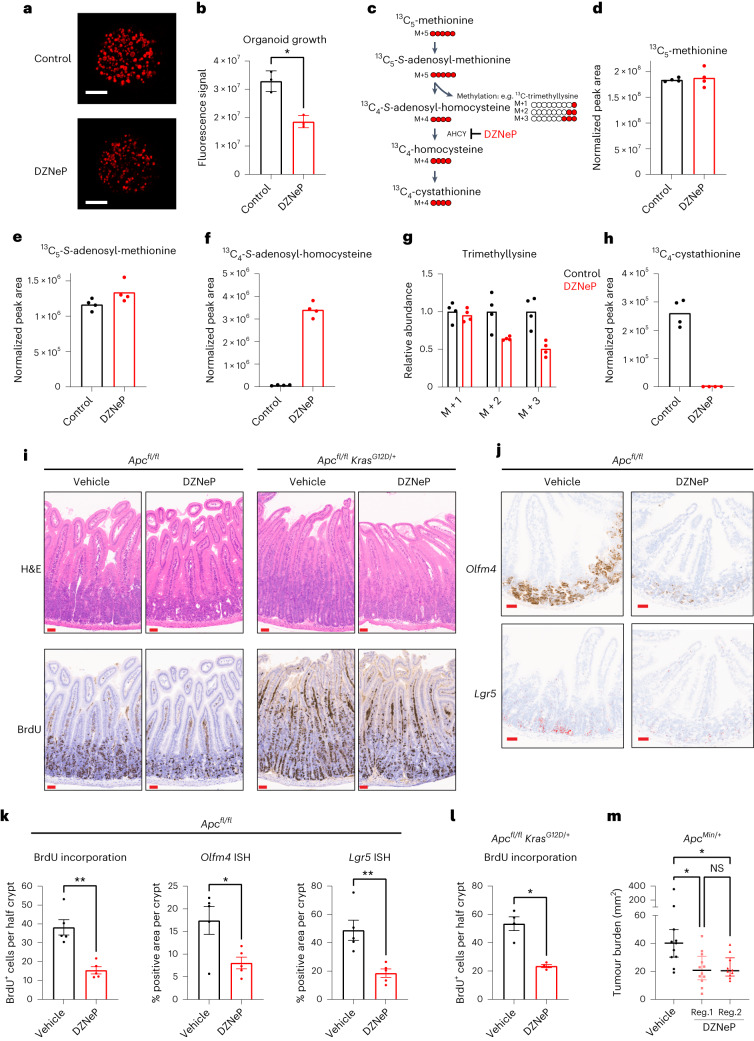
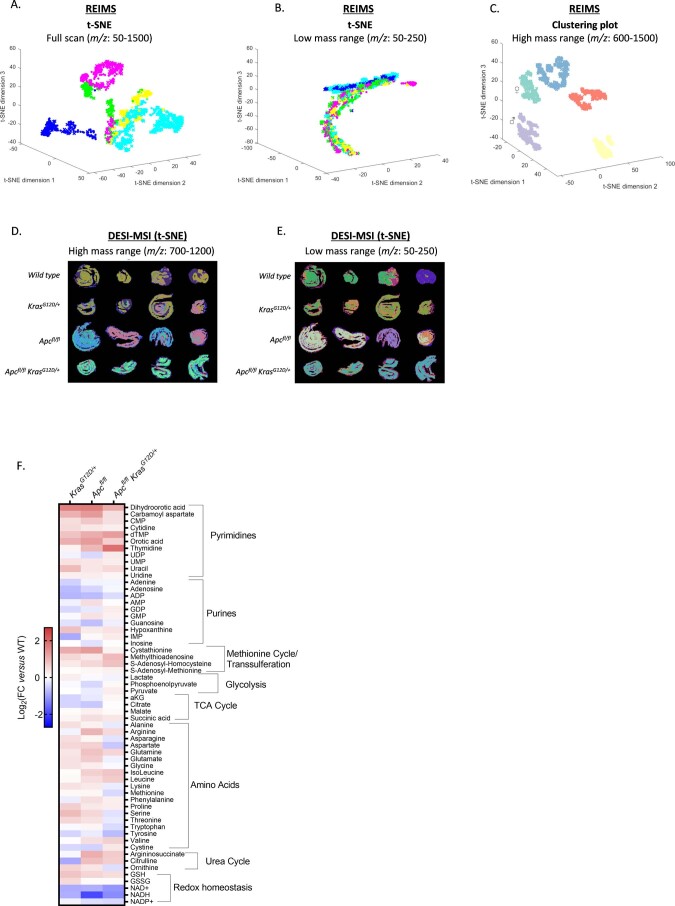
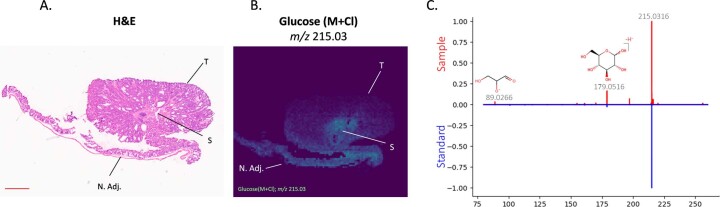
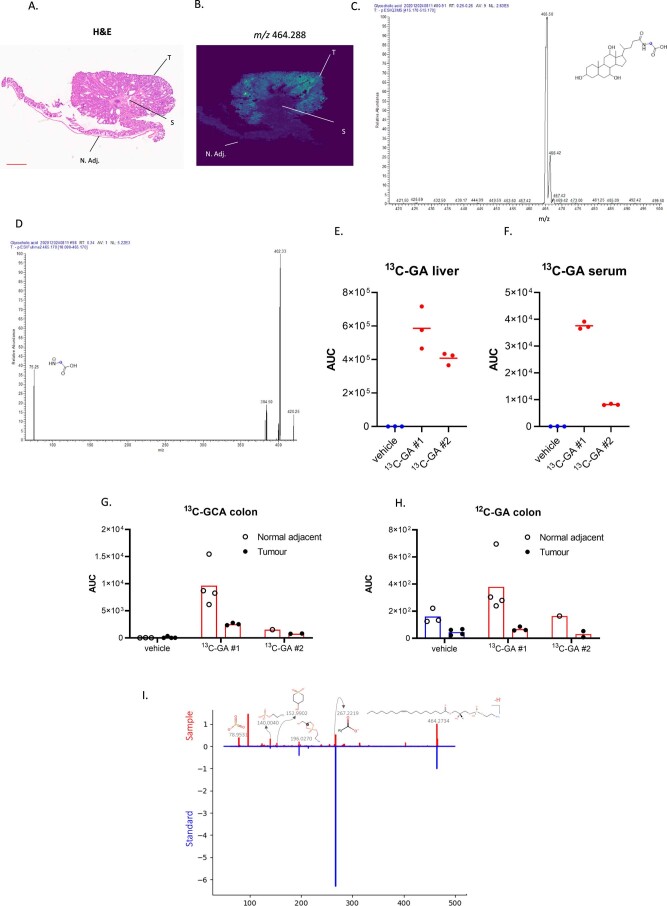
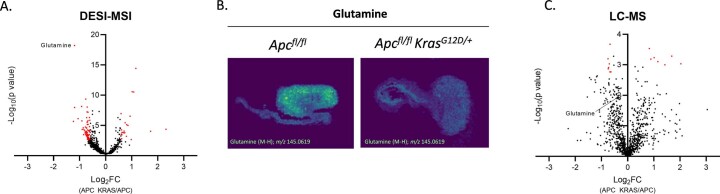
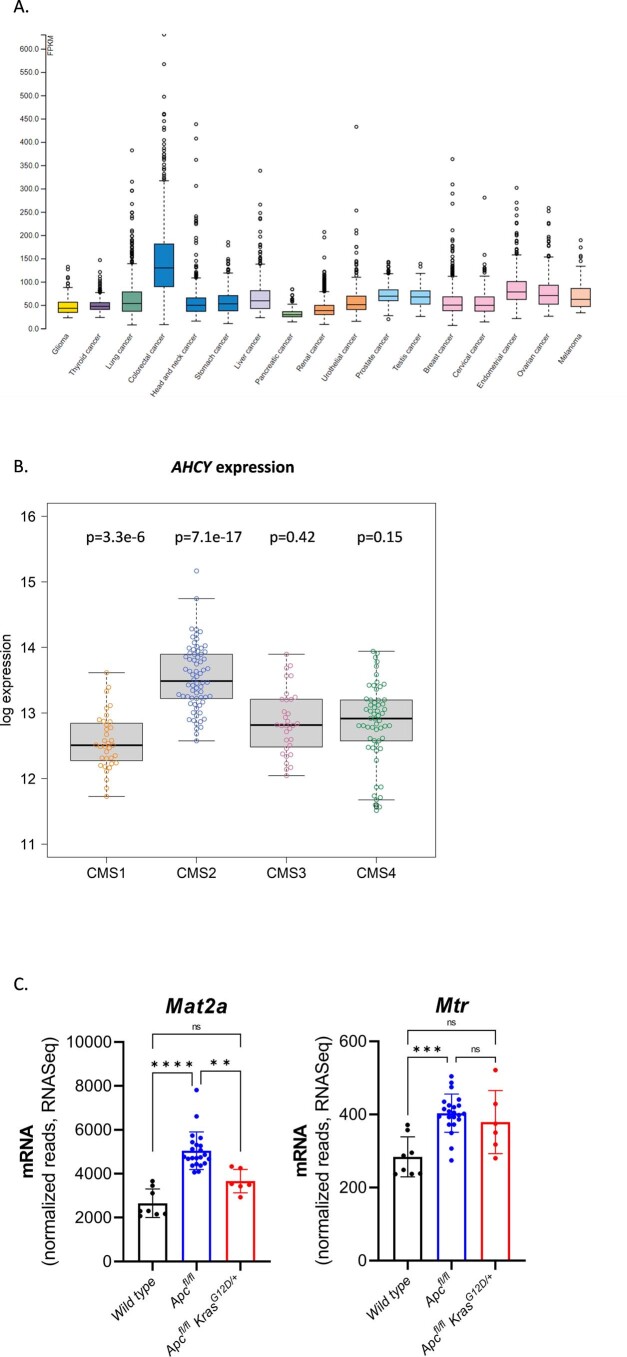
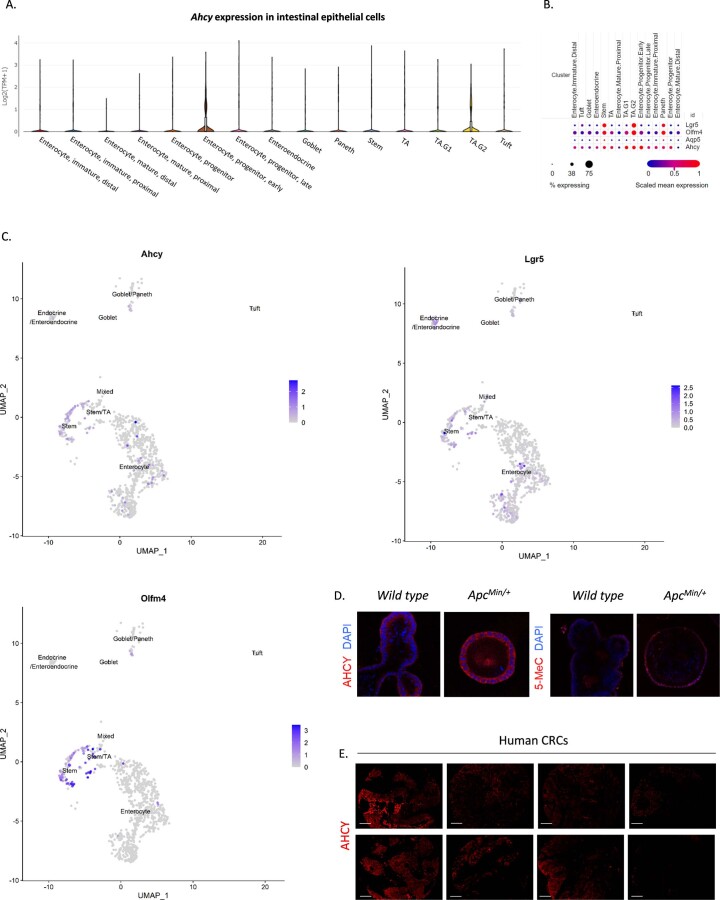
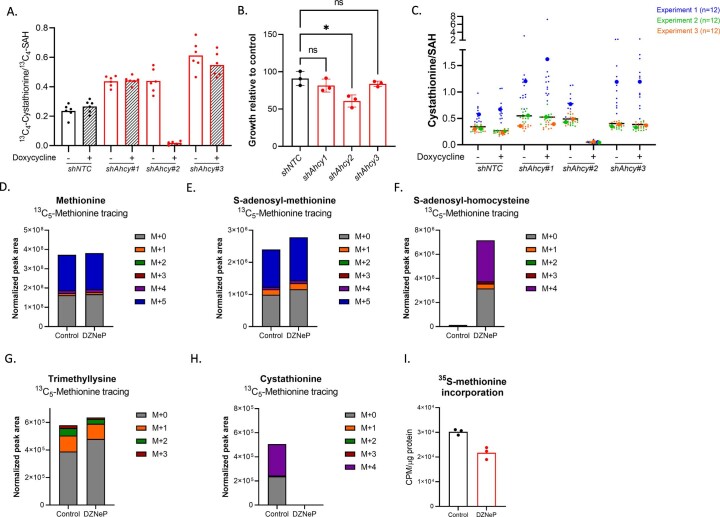
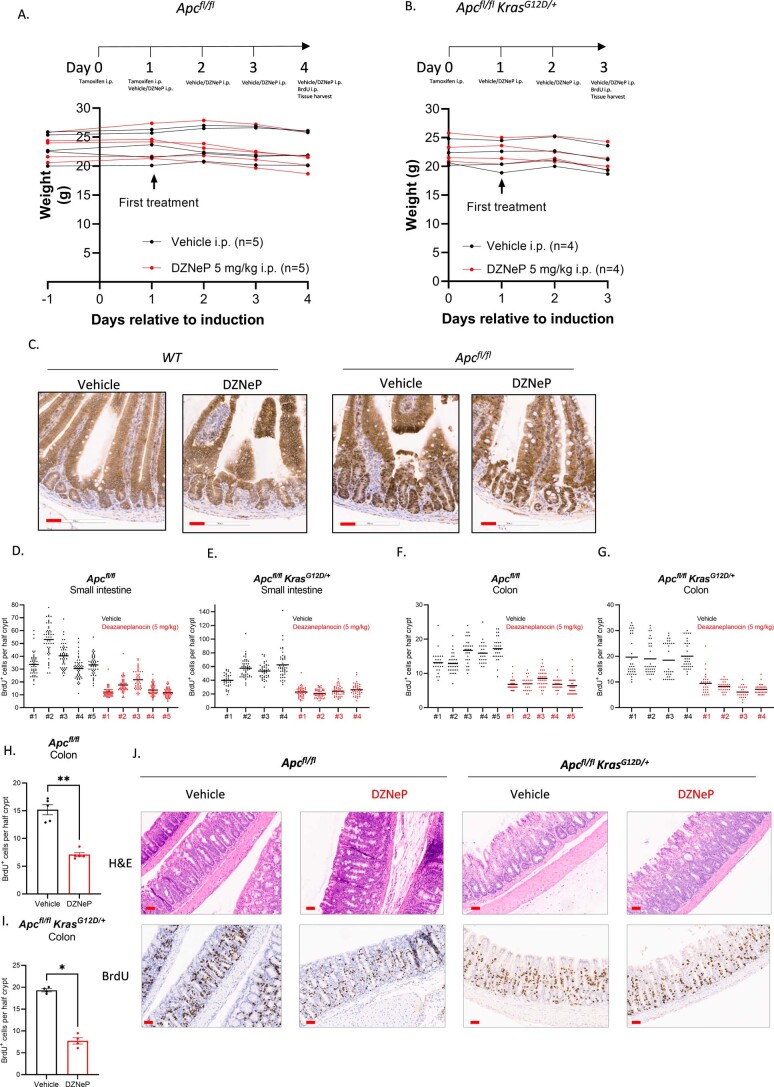
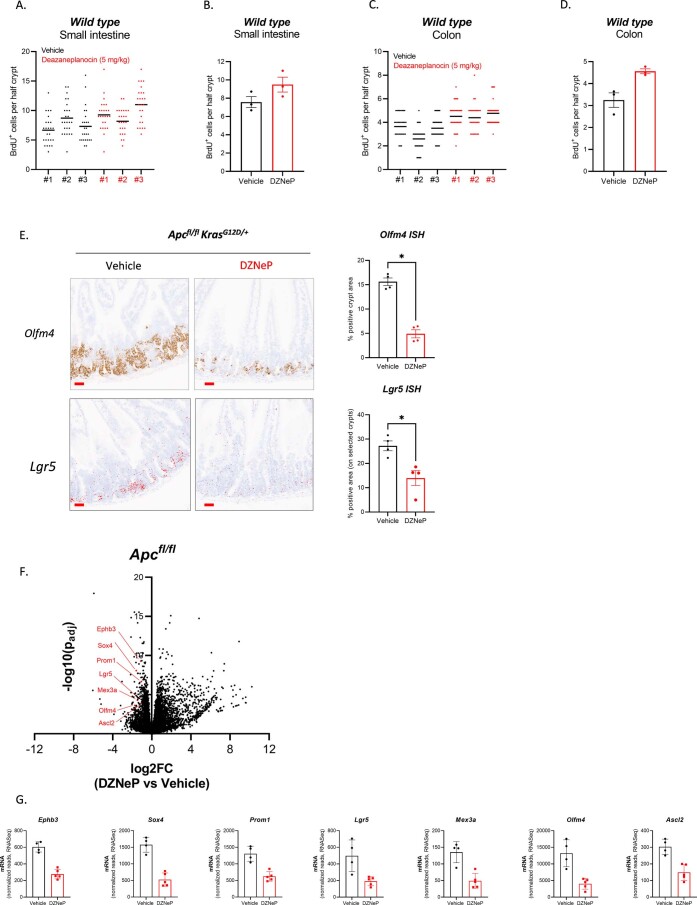
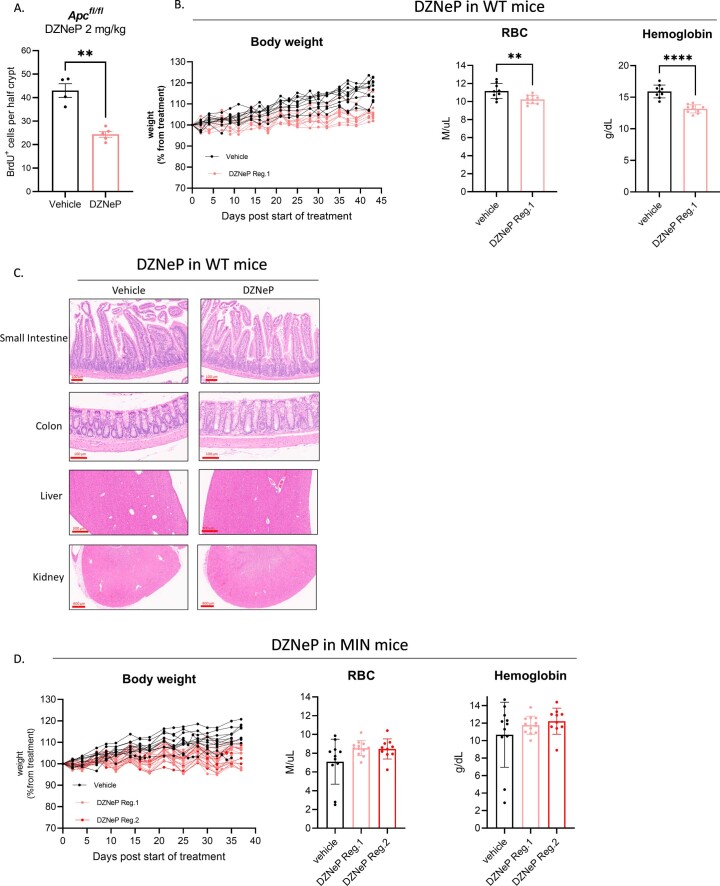
The genomic landscape of colorectal cancer (CRC) is shaped by inactivating mutations in tumour suppressors such as APC, and oncogenic mutations such as mutant KRAS. Here we used genetically engineered mouse models, and multimodal mass spectrometry-based metabolomics to study the impact of common genetic drivers of CRC on the metabolic landscape of the intestine. We show that untargeted metabolic profiling can be applied to stratify intestinal tissues according to underlying genetic alterations, and use mass spectrometry imaging to identify tumour, stromal and normal adjacent tissues. By identifying ions that drive variation between normal and transformed tissues, we found dysregulation of the methionine cycle to be a hallmark of APC-deficient CRC. Loss of Apc in the mouse intestine was found to be sufficient to drive expression of one of its enzymes, adenosylhomocysteinase (AHCY), which was also found to be transcriptionally upregulated in human CRC. Targeting of AHCY function impaired growth of APC-deficient organoids in vitro, and prevented the characteristic hyperproliferative/crypt progenitor phenotype driven by acute deletion of Apc in vivo, even in the context of mutant Kras. Finally, pharmacological inhibition of AHCY reduced intestinal tumour burden in ApcMin/+ mice indicating its potential as a metabolic drug target in CRC.


Conflict of interest statement

O.D.K.M. is a co-founder, shareholder and board member of Faeth Therapeutics. The remaining authors declare no competing interests.

Figures

Fig. 1
Fig. 1. Stratification of genetically engineered mouse models of intestinal hyperproliferation by metabolic profiling.
a, Oncoprint showing genetic alterations of APC, KRAS and PTEN in human colorectal adenocarcinoma (TCGA, Firehose Legacy; https://www.cbioportal.org/). b, t-SNE plot of REIMS data acquired from small intestinal epithelium after specific activation of oncogenic drivers focusing analysis on ions within a mass range of m/z 600–1,500. Each symbol corresponds to a single mass spectrum acquired using the REIMS forceps. Data were acquired from WT (n = 3), KRAS (n = 4), APC (n = 11), APC KRAS (n = 4) and APC KRAS PTEN (n = 5) mice. c, Three-dimensional t-SNE visualization of REIMS data collected from ex vivo clinical samples using only 50 significant classification features within a mass range of m/z 50–1,200. Each dot corresponds to a single mass spectrum described by the 50 features. Multiple spectra were collected from the same patient as technical replicates in the training data. Data were acquired from KRAS-WT (n = 8) and KRAS-mutant (n = 16) samples. d, PCA of untargeted LC–MS data (1,270 features) acquired from polar extracts of small intestinal tissues from WT, KRAS, APC, and APC KRAS mice (n = 3 for each genotype). e, Heat map showing differences in metabolite abundance in small intestinal tissues of KRAS, APC and APC KRAS mice compared with WT mice (targeted analysis of LC–MS data; heat map constructed based on fold change between the averages of each experimental group; n = 3). fo, Plots showing normalized abundances of intermediates of de novo pyrimidine synthesis (fh), pyrimidine nucleo(s)(t)ides (il) and intermediates of the methionine cycle/transsulferation pathway (mo). In fo, data are the mean ± s.d., and each dot represents data from an individual mouse (n = 3 mice for each genotype). p, Cystathionine β-synthase gene expression as analysed by RNA-seq in the small intestine of WT (n = 8), APC (n = 22) and APC KRAS (n = 6) mice. Data are the mean ± s.d., and each dot represents data from an individual mouse. Asterisks refer to P values obtained from Kruskal–Wallis test followed by Dunn’s correction (**P = 0.0026; ****P < 0.0001; not significant (NS), P > 0.9999). TCA, tricarboxylic acid. Source data
Fig. 2
Fig. 2. Metabolic profiling of genetically engineered mouse models of APC-deficient CRC using MSI and LC–MS.
a, Representative images of endoscopy-guided submucosal delivery of 4-OH-tamoxifen in the mouse colon resulting in localized genetic recombination and tumour formation. b, Representative image of H&E-stained distal colon tissue with an Apc-deficient tumour. N. Adj., normal adjacent tissue; S, stroma; T, tumour tissue. Tissues analysed for n = 4 mice; n = 1 shown. Scale bar, 1 mm. c,d, t-SNE plot of data acquired by DESI-MSI (negative polarity) (c) and MALDI-MSI (negative polarity) (d) of distal colon tissue of locally induced APC mice (tissues analysed for n = 4 animals; n = 1 shown). e, k-means plots of data acquired by DESI-MSI (positive polarity) of distal colon tissue of locally induced APC (n = 5) and APC KRAS (n = 7) mice, and normal colon from WT (n = 4) mice (n = 2 mice per group shown). f, PCA of untargeted LC–MS data (1,322 features) acquired on polar extracts of normal adjacent and colon tumour tissues of APC (n = 5) and APC KRAS (n = 8) mice, and control colon of WT (n = 5) mice. g, PCA of untargeted LC–MS data acquired on polar extracts of tumour tissues of APC (n = 5) and APC KRAS (n = 8) mice. h,i, Volcano plots showing metabolic differences between paired normal adjacent and colon tumour tissues of APC (n = 5) or APC KRAS (n = 8) mice as detected by untargeted LC–MS (P values obtained from paired t-tests). All annotated metabolites: fold change ≥ 1.5 and significant after Benjamini–Hochberg false discovery rate (FDR) correction (q = 0.05). Red dots indicate metabolites related to methionine metabolism; green dots indicate intermediates of de novo pyrimidine biosynthesis. j,k, Plots showing normalized abundances (mean ± s.d.) of intermediates of de novo pyrimidine synthesis in tumour and normal adjacent colon tissue of APC (n = 5 mice) and APC KRAS (n = 8 mice) mice (targeted analysis of LC–MS data). Each dot represents an individual mouse. Asterisks refer to P values obtained from one-tailed Wilcoxon matched-pairs signed-rank tests (*P = 0.0313; **P = 0.0039). Source data
Fig. 3
Fig. 3. Methionine cycle activity and AHCY expression in human colorectal cancer and genetically engineered mouse models of colorectal cancer.
a, Schematic representation of the methionine and folate cycle, and transsulferation pathway. b, Plots showing normalized abundances (mean ± s.d.) of SAM, SAH and cystathionine in tumour and normal adjacent colon tissue of APC mice (n = 5) as detected by targeted analysis of LC–MS data. Each dot represents an individual mouse. Asterisks refer to P values obtained from one-tailed Wilcoxon matched-pairs signed-rank tests (*P = 0.0313). c, Plots showing normalized abundances (mean ± s.d.) of SAM, SAH and cystathionine in tumour and normal adjacent colon tissue of APC KRAS (n = 8) mice as detected by targeted analysis of LC–MS data. Each dot represents an individual mouse. Asterisks refer to P values obtained from one-tailed Wilcoxon matched-pairs signed-rank tests (*P = 0.0273; **P = 0.0039). d, Expression of genes encoding enzymes of the methionine cycle in human colorectal adenocarcinoma (n = 592 individuals) compared with normal colon (TCGA, PanCancer Atlas; https://www.cbioportal.org/). Each dot shows the expression level for an individual. e, Cancer-specific survival analysis in the context of tumour epithelial AHCY expression in individuals with CRC (GRI TMA cohort, n = 701). f, Ahcy expression (mean ± s.d.) in the small intestine of WT (n = 8), APC (n = 22) and APC KRAS (n = 6) mice. Each dot represents an individual mouse. Asterisks represent P values obtained from Kruskal–Wallis test followed by Dunn’s correction (***P < 0.001: WT versus APC, P = 0.0004; WT versus APC KRAS, P = 0.0001; APC versus APC KRAS, P = 0.5054). g, Ahcy expression across the different cell populations of the small intestinal epithelium in APC mice (n = 2), as determined by scRNA-seq. h, H&E-stained and representative images of ISH for Olfm4, Lgr5 and Ahcy in the small intestine of APC mice. (Tissues analysed for n = 4; n = 1 shown). Scale bar, 100 µm. Images for Lgr5 were processed using ImageJ to show ISH staining in red. ik, IF showing AHCY protein expression in the small intestine of WT and ApcMin/+ mice (tissue analysed for n = 2 WT and n = 3 ApcMin/+ mice; i), APC and APC KRAS tumours (tissues analysed for n = 3 animals; n = 1 shown; j), and normal human colon and human CRC (image derived from single patient sample, from a set of 49 samples analysed; k). Scale bars, 100 µm. Source data
Fig. 4
Fig. 4. Inhibition of AHCY suppresses proliferation, stem cell expansion and tumorigenesis in APC-driven models of colorectal cancer.
a,b, Representative images (scale bar, 250 µm; a) and quantification (b) of APC organoids (±DZNeP 1 μM) stained with Syto 60 nucleic acid stain (mean ± s.d.; each dot represents the mean of three independent experiments with 4 or 5 technical replicates each). Asterisk refers to P value obtained from one-tailed Mann–Whitney test (*P = 0.05). c, Schematic showing carbon contribution of 13C5-methionine to intermediates of the methionine cycle, cystathionine and trimethyllysine. dh, Abundance of 13C5-methionine (d), 13C5-SAM (e), 13C4-SAH (f), various isotopologues of trimethyllysine (g) and 13C4-cystathionine (h) in APC organoids (±DZNeP 1 μM; bar indicates the mean; data from a representative experiment performed twice, with four technical replicates each; each dot represents a technical replicate). i, Representative images of H&E staining and IHC for BrdU on small intestinal sections of APC (n = 5) and APC KRAS (n = 4) mice treated with vehicle or DZNeP (5 mg per kg body weight). Scale bars, 50 μm; j, Representative images of ISH for Olfm4 and Lgr5 expression in the small intestine of APC mice (n = 5) treated with vehicle or DZNeP (5 mg per kg body weight). Scale bars, 50 μm. Images for Lgr5 were processed using ImageJ to show ISH staining in red. k,l, Quantification of IHC for BrdU in the small intestine of APC and APC KRAS mice treated with vehicle or DZNeP (5 mg per kg body weight). Mean ± s.e.m.; n = 5 (APC) or n = 4 (APC KRAS) mice per experimental arm; each dot represents the average number of BrdU-positive cells per half crypt for each mouse), and ISH for Olfm4 and Lgr5 in APC mice treated with vehicle or DZNeP (5 mg per kg body weight). Mean ± s.e.m., n = 5 APC mice per experimental arm; each dot represents the average percentage of positive area Olfm4 or Lgr5 per crypt for each mouse. Asterisks refer to P values obtained from one-tailed Mann–Whitney tests: k, *P = 0.0476; **P = 0.0040; l, *P = 0.0143. m, Small intestinal macroscopic tumour burden in ApcMin/+ mice treated with vehicle or DZNeP from day 50 until day 85 of age. Vehicle (n = 11): i.p. PBS. Regime 1: DZNeP (2 mg per kg body weight i.p.; n = 12) using weekly cycles of 4 d of daily treatment followed by 3 d of no treatment. Regime 2: DZNeP (5 mg per kg body weight i.p.; n = 10) twice per week. Plot shows the median with interquartile range. Each dot represents an individual mouse. Asterisks represent P values obtained from Kruskal–Wallis test followed by Dunn’s correction (*P < 0.05; vehicle versus reg.1: P = 0.0114; vehicle versus reg.2: P = 0.0243; reg.1 versus reg.2: P > 0.999). Source data
Extended Data Fig. 1
Extended Data Fig. 1. Metabolic profiling of intestinal tissues by REIMS, DESI-MSI and LC-MS.
(A) Multivariate analysis of REIMS data showing segmentation when focusing analysis on the full acquired mass range (m/z = 50-1500), or (B) low mass range (m/z: 50-250). Colour coding: yellow = WT; green = KRAS; cyan = APC; pink = APC KRAS; blue = APC KRAS PTEN. Each dot corresponds to a single mass spectrum acquired using the REIMS forceps. Data acquired from WT (n = 3), KRAS (n = 4) APC (n = 11), APC KRAS (n = 4), and APC KRAS PTEN (n = 5) mice. (C) Clustering plot of REIMS data (m/z: 600-1500) showing genotype-dependent clustering. ♂/♀ indicate male/female dominant APC clusters. (D) t-SNE of DESI-MSI data acquired from longitudinal sections of the rolled up small intestine of WT, KRAS, APC, and APC KRAS mice focusing analysis on ions within high mass range m/z: 700-1200, or (E) low mass range m/z: 50-250 (n = 4 per genotype, each image is a rolled small intestine from one individual mouse). (F) Targeted LC-MS analysis of polar extracts of colonic tissues from KRAS, APC, and APC KRAS mice compared with WT mice. Heatmap constructed based on fold change between the averages of each experimental group (n = 3). Source data
Extended Data Fig. 2
Extended Data Fig. 2. Decreased glucose abundance in tumour epithelium.
(A) H&E of distal colon tissue with an Apc-deficient tumour [same H&E as shown in Fig. 2B and Extended Data Fig. 3A; N. Adj.: normal adjacent tissue; S: stroma; T: tumour tissue]. Tissues analysed for n = 4 animals; n = 1 shown. Scale bar: 1 mm. (B) DESI-MSI showed decreased abundance of an ion with m/z 215.03 in the tumour epithelial compartment of APC tumours. [N. Adj.: normal adjacent tissue; S: stroma; T: tumour tissue]. Database search (https://hmdb.ca) suggested that this could be assigned as glucose [M+Cl]. A standard solution of glucose was mixed with chlorinated dopamine to obtain chlorinated glucose for comparison. (C) DESI tandem mass spectrometry showed that the fragmentation of the ion of interest produced ions matched to the fragmentation pattern of the chlorinated standard, further supporting the ID of this metabolite of interest. All highlighted m/z of fragments and precursor ions on the mass spectra are present in both standard and sample.
Extended Data Fig. 3
Extended Data Fig. 3. Tumour epithelial specific accumulation of Lyso-PE 17:1.
(A) H&E of distal colon tissue with an Apc-deficient tumour [same H&E as shown in Fig. 2B and Extended Data Fig. 2A; N. Adj.: normal adjacent tissue; S: stroma; T: tumour tissue]. Tissues analysed for n = 4 animals; n = 1 shown. Scale bar: 1 mm. (B) specific accumulation of an ion with m/z 464.288 in the tumour epithelial compartment of APC tumours as detected by MALDI-MSI. The two top tentative parent ion identifications (that is glycocholic acid and LysoPE 17:1) obtained from a publicly available database (https://hmdb.ca) were experimentally validated. (C) A 13C-glycocholic acid (13C-GA) standard solution was infused to detect the parent ion (blue dot indicates 13C label) using Triple Quadrupole Mass Spectrometry, and (D) a Multiple Reaction Monitoring (MRM) method was developed to study the abundance of 13C-GA in tissues via its a diagnostic ion of 75 Da (blue dot indicates 13C label). Tumour-bearing APC mice were administered 13C-GA (75 mg/kg p.o.; n = 2) or vehicle (HPMC/Tween:DMSO; v-v 90:10; n = 1). After 8.5 hours, serum, liver and distal colon were harvested and processed for LC-MS. 13C-GA was detected in (E) liver, (F) serum, (G) normal adjacent colonic tissue and tumour tissues. No increased abundance of (G) 13C-GA or (H) 12C-GA was observed in tumour tissues compared with normal adjacent colonic tissue. Panels E-H show the mean of metabolic extractions of the multiple tissue fragments for each mouse, each dot represents data obtained from a single tissue fragment, or serum extract. Liquid extraction surface analysis tandem mass spectrometry was applied to study fragmentation of the m/z 464.288 precursor ion, which showed matched ions to the predicted fragmentation pattern of LysoPE 17:1, as well as to the (I) fragmentation of a commercially available standard further supporting the ID of this metabolite of interest. All highlighted m/z of fragments and precursor ions on the mass spectra are present in both standard and sample. Source data
Extended Data Fig. 4
Extended Data Fig. 4. Comparative untargeted metabolomics of APC and APC KRAS tumours by DESI-MSI and LC-MS.
(A) Volcano plot showing metabolic differences between tumour epithelial regions of APC (n = 2 mice) and APC KRAS (n = 2 mice) colon tumours as analysed by DESI-MSI. Red dots: FC ≥ 1.5 and significant after Benjamini-Hochberg FDR correction (q = 0.1). (B) Representative images of glutamine abundance in APC and APC KRAS colon tumours as analysed by DESI-MSI. Tissues analysed for n = 4 APC mice and n = 3 APC KRAS mice; n = 1 shown. (C) Volcano plot showing metabolic differences between bulk tumour tissue extracts of APC (n = 5 mice) and APC KRAS (n = 8 mice as analysed by untargeted LC-MS. Red dots: FC ≥ 1.5 and significant after Benjamini-Hochberg FDR correction (q = 0.1). If a more stringent FDR was used (for example q = 0.05) no metabolites pass significance for the LC/MS data. Source data
Extended Data Fig. 5
Extended Data Fig. 5. Expression of methionine cycle enzymes in human cancers and CRC GEMMs.
(A) Pan-cancer analysis showing AHCY gene expression in 17 cancers as analysed by RNA-Seq. Data reported as FPKM (number fragments per kilobase of exon per million reads), generated by The Cancer Genome Atlas (TCGA). Image credit: Human Protein Atlas, image available from v22.proteinatlas.org. Sample numbers for each cancer type are available at URL: https://www.proteinatlas.org/ENSG00000101444-AHCY/pathology Box plots show median, and 25th and 75th percentiles. Points are displayed as outliers if they are above or below 1.5 times the interquartile range. Minima, Maxima and n number are shown in ‘Source Data’. (B) Expression of AHCY across the different consensus molecular subtypes of human CRC. Box plots show median, and 25th and 75th percentiles. Whiskers for boxplots are 1.5x the interquartile range. p-values refer to difference between each CMS group relative to all others. Two-sided p-values were calculated by fitting a linear model, computing moderated t-statistics and then correcting for multiple testing using the Benjamini-Hochberg method. Minima, Maxima and n number are shown in ‘Source Data’. (C) Mat2a and Mtr expression (Mean ± SD) in the small intestine of WT (n = 8), APC (n = 22) and APC KRAS (n = 6) mice. Each dot represents an individual mouse, asterisks represent p-values obtained from Kruskal-Wallis test followed by Dunn’s correction [(Mat2a: WT vs APC: p < 0.0001; WT vs APC KRAS: p = 0.9685; APC vs APC KRAS: p = 0.0095), (Mtr: WT vs APC: p = 0.0005; WT vs APC KRAS: p = 0.1048; APC vs APC KRAS: p > 0.9999)]. Source data
Extended Data Fig. 6
Extended Data Fig. 6. Expression of Ahcy and established stem cell markers in the wild type and APC-deficient murine intestine, and AHCY protein expression.
(A) Violin plot showing Ahcy gene expression across the different cell populations of the wild type mouse small intestine (Image available from: https://singlecell.broadinstitute.org/single_cell/study/SCP44/small-intestinal-epithelium?genes=Ahcy&tab=distribution#study-visualize). (B) Dot plot showing Lgr5, Olfm4, Ahcy, and Aqp5 expression across the different cell populations of the wild type mouse small intestine (Image available from: https://singlecell.broadinstitute.org/single_cell/study/SCP44/small-intestinal-epithelium?genes=lgr5%2Colfm4%2Caqp5%2CAhcy&tab=distribution#study-visualize). (C) UMAP plots showing expression of Ahcy, Lgr5, and Olfm4 across the different cell populations of the Apc-deficient mouse small intestine. (data from n = 2 APC mice) (D) IF showing AHCY protein expression and abundance of 5-methylcytosine in organoids derived from the intestine of WT mice, and from adenomas in ApcMin/+ mice. Image from a single experiment with 4 technical replicates. (E) IF showing AHCY expression in human CRC. Scale bars: 100 µm. (Images derived from 8 CRC samples, from a cohort of 49 CRC samples analysed).
Extended Data Fig. 7
Extended Data Fig. 7. Genetic silencing of Ahcy, 13C-methionine tracing and 35S-protein incorporation in APC organoids.
(A) Knockdown validation assay (seeding density 5,000 cells) showing that genetic silencing of Ahcy in APC organoids was efficient for shAhcy#2 as indicated by a reduced ratio of 13C4-Cystathionine/13C4-SAH. Bar indicates Mean. Data from a single experiment. Each dot represents a technical replicate (n = 6 per condition). (B) Quantification of APC organoid growth showing growth inhibition for shAhcy#2 (seeding density 2,000 cells, growth quantified with Syto 60 Nucleic Acid Stain and represented as relative to doxycycline-free culture condition). Mean ± SD; each dot represents the mean of 3 independent experiments with 12 technical replicates per condition; asterisk refers to p-value obtained from Kruskal-Wallis test followed by Dunn’s correction (shNTC vs shAhcy1: p = 0.9245; shNTC vs shAhcy2: p = 0.0276; shNTC vs shAhcy3: p > 0.9999). (C) Metabolomics accompanying growth assays represented in panel B showing efficient Ahcy knockdown for shAhcy#2 as indicated by a reduced ratio of Cystathionine/SAH. Data shown for 3 independent experiments. Small dots represent technical replicates (n = 12 per condition). Large dots represent the averages for each independent experiment. (D-H) Plots accompanying Fig. 4(D-H) showing the abundance of all isotopologues for (D) methionine, (E) SAM, (F) SAH, (G) trimethyllysine, and (H) cystathionine in APC organoids (+/- DZNeP 1 μM) cultured in the presence of 13C5-methionine. Data from a representative experiment performed twice, with 4 technical replicates each. Bars show mean. (I) 35S-methionine protein incorporation assay performed with APC organoids (+/- DZNeP 1 μM). Data from a representative experiment performed twice, with 3 technical replicates each (shown). Bars show mean. Source data
Extended Data Fig. 8
Extended Data Fig. 8. Effects of DZNEP on β-catenin localization and intestinal proliferation in APC and APC KRAS mice.
(A,B) Schematic representation of experiments performed to test the effect of DZNeP in APC and APC KRAS mice, and the effect of daily treatment for 4 days or 3 days for APC and APC KRAS mice, respectively on body weight. (C) Representative images of IHC for β-catenin in the small intestine of WT (n = 3) and APC (n = 5) animals treated with vehicle or DZNeP (5 mg/kg). Scale bars (red): 50 μm. (D-G) Quantification of IHC for BrdU incorporation in the (D,E) small intestine and (F,G) colon of APC and APC KRAS mice treated with vehicle or DZNeP (5 mg/kg). [n = 5 (APC) or n = 4 (APC KRAS) mice per experimental arm]; Individual data shown for each mouse. Line represents mean. Each dot represents the number of BrdU positive cells counted per half crypt. (H,I) Quantification of IHC for BrdU in the colon of APC and APC KRAS mice treated with vehicle or DZNeP (5 mg/kg). [n = 5 (APC) or n = 4 (APC KRAS) mice per experimental arm]; Mean ± SEM. Each dot represents the average number of BrdU positive cells per half crypt for each mouse. Asterisks refer to p-values obtained from 1-tailed unpaired Mann-Whitney tests (*: p = 0.0143; **: p = 0.0040). (J) Representative images of H&E staining and IHC for BrdU on colon sections of APC (n = 5) and APC KRAS (n = 4) mice treated with vehicle or DZNeP (5 mg/kg). Scale bars: 50 μm. Source data
Extended Data Fig. 9
Extended Data Fig. 9. Effect of DZNeP on intestinal proliferation in WT mice and on stem cell markers in APC and APC KRAS mice.
Quantification of IHC for BrdU incorporation in the (A,B) small intestine and (C,D) colon of WT mice treated with vehicle or DZNeP (5 mg/kg). (n = 3 mice per experimental arm; panels A,C: each dot represents the number of BrdU positive cells counted per half crypt. Line represents mean; panels B,D: Mean ± SEM, each dot represents the average number of BrdU positive cells per mouse. (E) Representative images and quantification of ISH for Olfm4 and Lgr5 expression in the small intestine of APC KRAS mice (n = 4) treated with vehicle or DZNeP (5 mg/kg). Scale bars: 50 μm. [Mean ± SEM). Each dot represents the average % positive area per crypt for each mouse. Asterisks refer to p-values obtained from 1-tailed Mann-Whitney tests (*: p = 0.0143). Images for Lgr5 were processed using imageJ to show ISH staining in red. (F) Volcano plot showing transcriptomic changes in small intestinal tissues of APC mice treated with vehicle (n = 4) or DZNeP (5 mg/kg; n = 5) for 4 days. (G) Plots showing changes in expression of stem cell markers in small intestinal tissues of APC mice treated with vehicle (n = 4) or DZNeP (5 mg/kg; n = 5) for 4 days. (Mean ± SD). Each dot represents values obtained for an individual mouse. Source data
Extended Data Fig. 10
Extended Data Fig. 10. Evaluation of long-term DZNeP treatment in WT and MIN mice.
(A) Quantification of IHC for BrdU in the small intestine of APC mice treated with vehicle (n = 4) or DZNeP (2 mg/kg; n = 5) for 4 days (Mean ± SEM). Each dot represents the average number of BrdU positive cells per half crypt for each mouse. Asterisk refers to p-value obtained from 1-tailed Mann-Whitney test (**: p = 0.0079). (B-C) Body weight trajectories, blood analysis (Mean ± SD) and representative images of organs from WT mice treated with vehicle or DZNeP from day 50 until day 93 of age. Data show that body weights of DZNeP-treated mice were stable, although lower than vehicle-treated animals at the end of the experiment. Blood profiling showed a decrease in red blood cells and haemoglobin in DZNeP-treated mice, but no intestinal bleeding or clinical signs of anaemia were observed. Histological analysis of small intestine, colon, liver and kidneys did not reveal any abnormalities associated with DZNeP treatment. Vehicle (n = 10 for body weight; n = 9 for blood analysis): i.p. PBS. DZNeP Regime 1 (n = 10): 2 mg/kg i.p. using weekly cycles of 4 days of daily treatment followed by 3 days of no treatment. Each dot represents an individual mouse, asterisks represent p-values obtained from 1-tailed Mann-Whitney test (**: p = 0.0076; ****: p < 0.0001). (D) Body weight trajectories and blood analysis (Mean ± SD) from ApcMin/+ mice treated with vehicle or DZNeP from day 50 until day 85 of age. Body weights remained stable during treatment, and DZNeP did not result in more severe disease-related anaemia. Vehicle (n = 11): i.p. PBS. Regime 1: DZNeP (2 mg/kg i.p.; n = 12) using weekly cycles of 4 days of daily treatment followed by 3 days of no treatment. Regime 2: DZNeP (5 mg/kg i.p.; n = 10) twice per week. Each dot represents an individual mouse. Source data

References

    1. Sung, H. et al. Global Cancer Statistics 2020: GLOBOCAN estimates of incidence and mortality worldwide for 36 cancers in 185 countries. CA Cancer J. Clin.71, 209–249 (2021). - PubMed
    1. Cancer Genome Atlas, N. Comprehensive molecular characterization of human colon and rectal cancer. Nature487, 330–337 (2012). - PMC - PubMed
    1. Satoh, K. et al. Global metabolic reprogramming of colorectal cancer occurs at adenoma stage and is induced by MYC. Proc. Natl Acad. Sci. USA114, E7697–E7706 (2017). - PMC - PubMed
    1. Jackstadt, R. & Sansom, O. J. Mouse models of intestinal cancer. J. Pathol.238, 141–151 (2016). - PMC - PubMed
    1. Balog, J. et al. Intraoperative tissue identification using rapid evaporative ionization mass spectrometry. Sci. Transl. Med.5, 194ra193 (2013). - PubMed

Publication types