. 2023 Sep;24(9):1473-1486.
doi: 10.1038/s41590-023-01587-x. Epub 2023 Aug 14.

Short-term dietary changes can result in mucosal and systemic immune depression

Affiliations

Short-term dietary changes can result in mucosal and systemic immune depression

Francesco Siracusa et al. Nat Immunol. 2023 Sep.

Abstract

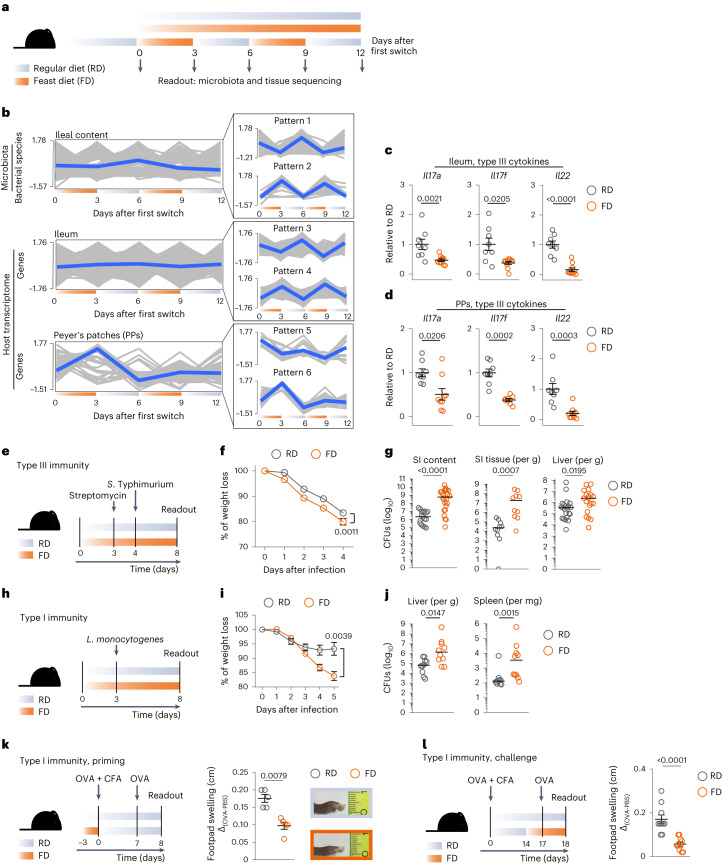
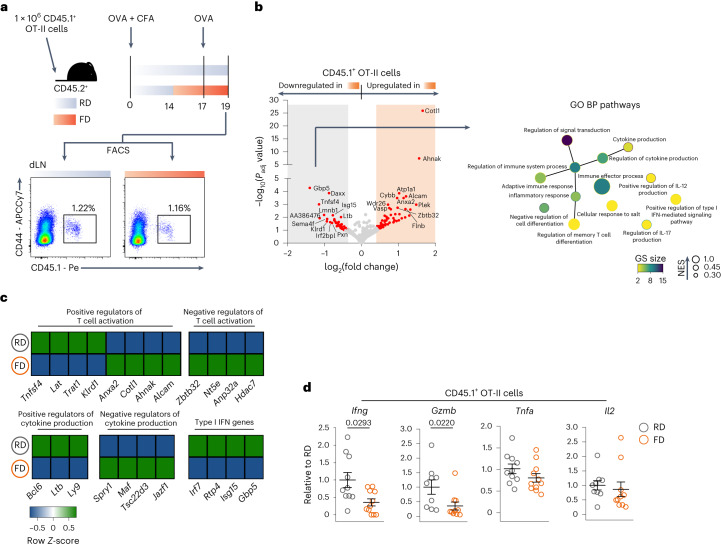
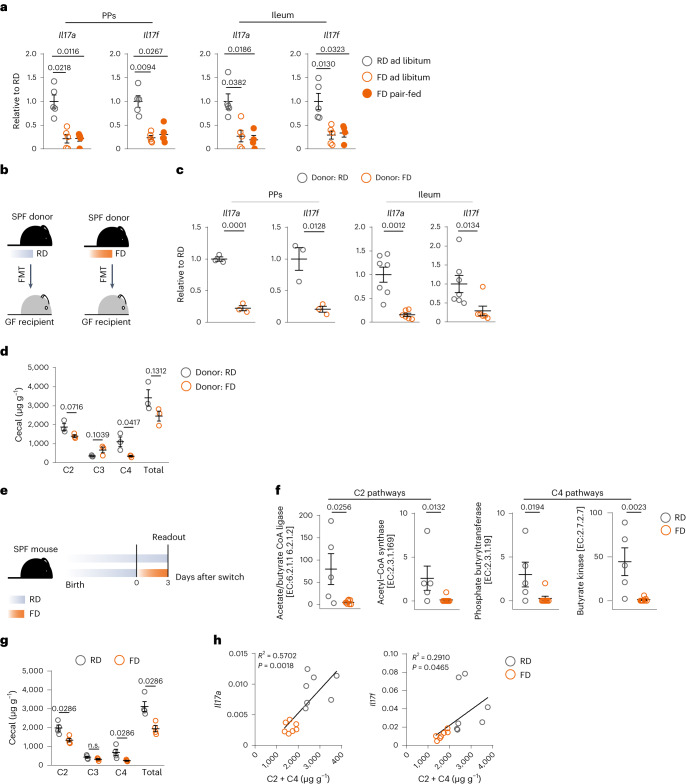
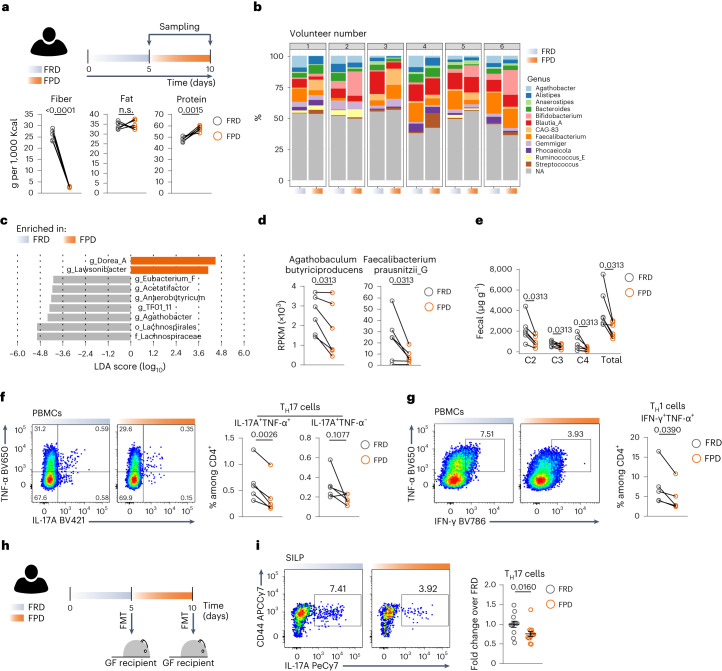
Omnivorous animals, including mice and humans, tend to prefer energy-dense nutrients rich in fat over plant-based diets, especially for short periods of time, but the health consequences of this short-term consumption of energy-dense nutrients are unclear. Here, we show that short-term reiterative switching to 'feast diets', mimicking our social eating behavior, breaches the potential buffering effect of the intestinal microbiota and reorganizes the immunological architecture of mucosa-associated lymphoid tissues. The first dietary switch was sufficient to induce transient mucosal immune depression and suppress systemic immunity, leading to higher susceptibility to Salmonella enterica serovar Typhimurium and Listeria monocytogenes infections. The ability to respond to antigenic challenges with a model antigen was also impaired. These observations could be explained by a reduction of CD4+ T cell metabolic fitness and cytokine production due to impaired mTOR activity in response to reduced microbial provision of fiber metabolites. Reintroducing dietary fiber rewired T cell metabolism and restored mucosal and systemic CD4+ T cell functions and immunity. Finally, dietary intervention with human volunteers confirmed the effect of short-term dietary switches on human CD4+ T cell functionality. Therefore, short-term nutritional changes cause a transient depression of mucosal and systemic immunity, creating a window of opportunity for pathogenic infection.


Conflict of interest statement

N.G. declares financial support from F. Hoffmann-La Roche. This is outside the submitted work. The remaining authors declare no competing interests.

Figures

Fig. 1
Fig. 1. Short-term consumption of FD impairs mucosal and systemic immunity.
a, Dietary intervention schematic. b, Bacterial species (ileal content, top) and genes (ileum and PPs, middle and bottom) significantly changing (Padj ≤ 0.05) in at least one time point during dietary intervention. Blue lines represent the average pattern of changes. c,d, Expression levels of Il17a, Il17f and Il22 normalized to Tbp and shown as relative to RD, on total ileum (c) and PP (d) cells. e, Salmonella Typhimurium infection model. f,g, Body weight loss (f) and CFUs of S. Typhimurium in SI luminal content, SI tissue and liver (g). h, Listeria monocytogenes infection model. i,j, Body weight loss (i) and CFUs of Listeria monocytogenes in liver and spleen (j). k,l, Left, immunization strategy. Right, swelling of footpad of RD-fed and FD-fed mice during priming (k) or challenge (l) and representative pictures of swelled-footpads. Data in b, top, are one experiment with three to ten mice per group. Data in b, middle and bottom, are one experiment with three mice per group. Data in c and d are a pool of two experiments (ileum, n = 8 or 10; PPs, n = 8 or 9). Data in f are from one experiment (n = 12 each), representative of six experiments. Data in g are a pool of two experiments (SI content, n = 17 or 24, representative of six experiments; SI tissue, n = 10 each, representative of four experiments; liver, n = 22 or 19, representative of six experiments). Data in i and j are a pool of two experiments (n = 10 each). Data in k are from one experiment (n = 5 each), representative of three experiments. Data in l are a pool of two experiments (n = 10 each). Data are shown as mean ± s.e.m. or median (g,j). P values have been determined by two-tailed Wald test (b) or two-tailed nonparametric Mann–Whitney U-test (c,d,f,g,il). Source data
Fig. 2
Fig. 2. Short-term consumption of FD affects the intestinal CD4+ T cell compartment.
a, Dietary intervention schematic. b, Volcano plot showing DEGs (Padj ≤ 0.10, |fold change| ≥ 1.3) in FACS-sorted CD4+Foxp3 T cells isolated from PPs of RD-fed and FD-fed mice. Two to three biological replicates per group were sequenced. c, Left, representative dot plots of exTH17 (YFP+Katushka) and TH17 (YFP+Katushka+) cells gated on CD3+CD4+Foxp3 viable conventional T (Tconv) cells in PPs of RD-fed and FD-fed mice. Right, frequencies of exTH17, TH17 and IL-10-secreting TH17 cells among CD3+CD4+Foxp3 Tconv cells in PPs of RD-fed and FD-fed mice. d, Heatmap showing expression level of Reg3b, Reg3g, Muc1 and Muc2 normalized on Tbp and shown as relative to RD. e, Dietary intervention and S. Typhimurium infection model. f, CFUs of S. Typhimurium in SI luminal content, SI tissue and liver in IL-17A/IL-17F double-knockout and littermate control mice upon switch to FD. Data in c are a pool of two experiments (exTH17 and TH17, n = 9 or 7; IL-10+ TH17, n = 8 or 5, representative of four experiments). Data in d are a pool of two experiments (n = 10 or 9). Data in f are a pool of five experiments (SI content, n = 23, 16, 18 or 19; SI tissue, n = 16, 19, 25 or 19; liver, n = 21, 12, 27 or 12). Data are shown as mean ± s.e.m. or median (f). P values were determined using two-tailed Wald test (b), two-tailed nonparametric Mann–Whitney U-test (c,d) or Kruskal–Wallis test with Dunn’s multiple comparison test (f). P values in d: a, 0.0115; b, 0.0005; c, <0.0001; d, 0.0185. Source data
Fig. 3
Fig. 3. Short-term consumption of FD impairs antigen-specific CD4+ T cells.
a, Top, dietary intervention and immunization strategy. Bottom, representative dot plots of CD45.1+ OT-II cells gated on CD3+CD4+ viable T cells in the draining lymph node (dLN) of RD-fed and FD-fed mice. b, Left, volcano plot showing DEGs (Padj ≤ 0.10, |fold change| ≥ 1.3) in FACS-sorted CD45.1+ OT-II cells isolated from draining lymph nodes of mice kept on RD or switched to FD during systemic OVA challenge. Two samples per group were sequenced, and each sample consisted of a pool of three individual mice from three experiments. Right, enrichment map showing Gene Ontology Biological Process (GO BP) pathways enriched in RD, as determined by functional enrichment analysis on downregulated genes of CD45.1+ OT-II cells upon switch to FD (false discovery rate (FDR) ≤ 0.05 and Edge Cutoff < 0.4). GS, gene set. c, Heatmap showing expression levels of DEGs selected for having a known function in T cell activation, cytokine production and type I IFN responses in CD45.1+ OT-II cells isolated from draining lymph nodes of RD-fed and FD-fed mice during systemic OVA challenge. d, Expression levels of Ifng, Gzmb, Tnfa and Il2 normalized on Hprt and shown as relative to RD on FACS-sorted CD45.1+ OT-II cells. Data in d are a pool of three experiments (Ifng and Tnfa, n = 10 or 11; Gzmb and Il2, n = 9 or 10). Data are shown as mean ± s.e.m. P values have been determined by two-tailed Wald test (b) or two-tailed nonparametric Mann–Whitney U-test (d). Source data
Fig. 4
Fig. 4. Effects of short-term consumption of FD are mediated by microbial metabolites.
a, Expression levels of Il17a and Il17f normalized to Tbp and shown as relative to RD, as measured by real-time PCR on total PP (left) and ileum (right) cells isolated from mice kept on RD or switched to FD ad libitum or pair-fed. b, Schematic of FMT. SPF, specific-pathogen-free; GF, germ-free. c, Expression levels of Il17a and Il17f normalized to Tbp and shown as relative to RD on total PP (left) and ileum (right) cells isolated from germ-free mice that received RD or FD FMT. d, Concentration of SCFAs in cecal content of germ-free mice that received RD or FD FMT. e, Dietary intervention schematic. f, Normalized counts of microbial genes encoding for enzymes involved in C2 and C4 metabolism in ileal contents of RD-fed and FD-fed specific-pathogen-free mice. g, Concentration of SCFAs in cecal content of RD-fed and FD-fed specific-pathogen-free mice. h, Pearson correlation (two-tailed) of Il17a and Il17f with C2 and C4 concentrations. Data in a are from one experiment (ileum, n = 5 or 4; PPs, n = 5 each). Data in c, left, are from one experiment (n = 3 each), representative of two experiments; data in c, right, are a pool of two experiments (n = 7 or 6). Data in d are from one experiment (n = 3 each). Data in f are from one experiment (n = 5 or 8). Data in g are from one experiment (n = 4 each). Data in h are from the same experiments as d and g (n = 7 each). Data are shown as mean ± s.e.m. P values have been determined by two-tailed unpaired t-test (c, left, and d), two-tailed t-test (h), two-tailed nonparametric Mann–Whitney U-test (c, right, f and g) or Kruskal–Wallis test with Dunn’s multiple comparison test (a). Source data
Fig. 5
Fig. 5. Short-term consumption of FD impairs metabolic fitness of CD4+ T cells.
a, Schematic of T cell metabolism. b, Dietary intervention. c,d, Top ten hallmark pathways (c) and OXPHOS (d) in PP CD4+Foxp3 Tconv cells, determined by GSEA (FDR ≤ 0.25). e–h, Representative histogram (left) and expression level (right) of MitoSpy Orange CMTMRos (e,h) or p-rS6 protein (f,g) in CD4+ viable T cells after stimulation of PP cells in the presence or absence of the indicated compounds (g,h). PP cells in g and h were isolated from FD-fed mice. GMFI, geometric mean fluorescence intensity; rel., relative. i, IL-17A, IL-17F and TNF-α in supernatants of stimulated PP cells with or without the indicated compounds isolated from FD-fed mice. j,k, Oxygen consumption rate (OCR) (j) or basal, maximal respiration and spare respiratory capacity (SRC) (k) of splenic CD3+CD4+ T cells. l,m, Left, representative TEM images (l) or 3D tomography (m) of mitochondria from FACS-sorted splenic antigen (Ag)-experienced CD4+ T cells. Right, quantification of cristae width (l, n = 19 or 28; Fiji/ImageJ; scale bar, 500 nm) or volume occupied by cristae within 300 nm of reconstructed mitochondrion (m, n = 7 each; Etomo; scale bar, 70 nm). n, Experimental setup. o, Quantification of footpad swelling (left) and representative pictures of swollen footpads (right). p, Experimental setup. q, Quantification of footpad swelling. Data in e are a pool of four experiments (n = 10 or 8). Data in f are a pool of two experiments (n = 5 or 6). Data in g are a pool of three (rapamycin groups) or five experiments (n = 15 or 9). Data in h are a pool of two (rapamycin groups) or five experiments (n = 9, 5 or 3). Data in l are a pool of four (TNF-α) or five (IL-17A and IL-17F) experiments (n = 12, 3, 10 or 4). Data in j are from one experiment, representative of two (n = 2). Data in k are a pool of two experiments (n = 4). Data in o are a pool of two experiments (n = 10 or 8). Data in q are from one experiment, representative of two (n = 3 or 4). Data are shown as mean ± s.e.m. P values have been determined by two-tailed nonparametric Mann–Whitney U-test (e,f,km), one-tailed mixed-effect analysis with Greenhouse–Geisser correction and Sidak’s multiple comparison test (gi), Brown–Forsythe and Welch’s analysis of variance (ANOVA) test (o) or Kruskal–Wallis test with Dunn’s multiple comparison test (q). Source data
Fig. 6
Fig. 6. Reintroducing RD restores mucosal and systemic immunity.
a, Dietary intervention and immunization strategy. b, Quantification of footpad swelling of RD-fed and FD-fed mice during priming, 8 or 22 days after priming. c, Dietary intervention and immunization strategy. d, Quantification of footpad swelling of RD-fed and FD-fed mice (with or without C2 + C4 supplementation) during priming. e, Dietary intervention schematic. f, Frequencies of TH17 cells among CD3+CD4+ Tconv cells in PPs of RD-fed and FD-fed mice (with or without C2 + C4 supplementation). g, Dietary intervention and S. Typhimurium infection model. h, CFUs of S. Typhimurium in SI luminal content and liver in RD-fed and FD-fed mice (with or without C2 + C4 supplementation). i, Dietary intervention and S. Typhimurium infection model. j, CFUs of S. Typhimurium in SI luminal content and liver in RD-fed mice and mice switched to FD at different time points. Data in b are a pool of three experiments (n = 13 or 14). Data in d are a pool of three experiments (n = 13 or 16). Data in f are a pool of two experiments (n = 10 or 12). Data in h are a pool of four experiments (n = 13, 15 or 16). Data in j are a pool of two experiments (n = 7, 8 or 10). Data are shown as mean ± s.e.m. (bf) or median (hj). P values have been determined by two-tailed nonparametric Mann–Whitney U-test (b) or Kruskal–Wallis test with Dunn’s multiple comparison test (d,f,h,j). Source data
Fig. 7
Fig. 7. Short-term consumption of low-fiber diet in humans.
a, Top, human dietary intervention study. Bottom, quantification of fiber, fat and protein intake per volunteer at the two dietary switches. b, Microbial composition within each volunteer at the end of each dietary intervention. c, Linear discriminant analysis (LDA) score showing differentially abundant bacteria in FRD versus FPD. d, Fiber-fermenting, C4-secreting bacterial species shown as reads per kilobase per million mapped reads (RPKM). e, Concentration of SCFAs in stools of volunteers before and after each dietary intervention. f,g, Representative dot plots of human PBMCs gated on viable CD3+CD4+ cells showing TNF-α versus IL-17A (f, left) and TNF-α versus IFN-γ (g, left) and frequencies of systemic TH17 (f, right) and TH1 cells (g, right) upon switch to FPD. h, Schematic showing FMT of FRD-conditioned or FPD-conditioned human stools into germ-free mice. i, Representative dot plots of intestinal cells gated on viable TCRβ+CD4+ cells showing CD44 versus IL-17A (left) and frequencies of intestinal SILP TH17 cells upon switch to FPD (right). Data in ae are from six different volunteers, and each dot represents one volunteer (n = 6). Data in f and g are from five different volunteers, and each dot represents one volunteer (n = 5). Data in i are a pool of five experiments (n = 12 or 13); each dot represents one germ-free mouse; one to three germ-free mice per donor and per time point were used; a total of four different donors were used. Data are shown as mean ± s.e.m. P values were determined using two-tailed paired t-tests (a,dg) or two-tailed nonparametric Mann–Whitney U-test (i). Source data
Extended Data Fig. 1
Extended Data Fig. 1. Effects of reiterated short-term dietary changes.
(a) Body weight gain over dietary intervention. (b–d) Energy expenditure (kcal/hour, B), mean of energy expenditure per each dietary switch during light cycle (C) or core temperature (D) measured during indirect calorimetric experiment. White bars represent light cycle, grey bars represent dark cycle; blue lines represent the mean of energy expenditure at each cycle. (e) Serum levels of cholesterol (mg/dll) over dietary intervention. (f) Shannon’s diversity of ileal content over dietary intervention. (g, h) Abundance of bacterial species of ileal content over dietary intervention with (G) and without (H) Lactococcus lactis; top 12 species with highest counts are shown. (i) Enrichment map showing KEGG pathways following the depicted patterns over dietary intervention, as determined by GSEA on whole transcriptome of ileum (left) and PPs (right) (FDR ≤ 0.25). Each node is a pathway and the line connects pathways that have genes in common. The thickness of the line corresponds to the number of shared genes. (j) Volcano plot showing DEGs (p.adj≤0.05 and |log2FC|≥1) in total PP cells isolated from S. Typhimurium-infected mice kept on RD or switched to FD, as determined by RNA-sequencing. Three biological replicates per group were sequenced. Enrichment maps showing GO Biological Process pathways enriched in RD or FD, as determined by functional enrichment analysis on down-regulated (left) or up-regulated (right) genes of total PP cells upon switch to FD and infection with S. Typhimurium (FDR ≤ 0.05 and Edge Cutoff<0.4). Data in (A) are a pool of 3 experiments (n = 8 or 10; plotted is mean + SEM per group). Data in (B-D) are one experiment (n = 5). Data in (E) are a pool of 2 experiments (n = 9, 7 or 5). Data in (F-H) are from one experiment (n = 11, 8, 3, 4 or 5). Data in (I-J) are from one experiment (n = 3). Data are shown as mean ± SEM. P-values were determined using a RM one-way ANOVA test with Bonferroni’s comparisons test (C), one-way ANOVA test with Holm-Sidak’s comparisons test (F) or two-tailed Wald-test (J). Source data
Extended Data Fig. 2
Extended Data Fig. 2. Changes in PPs induced by one 3-day switch to FD.
(a–d) UMAP (A) and related clusters (B) and parameters (C) calculated on PP CD3+CD4+ viable T cells isolated from RD- and FD-fed mice. (d) Frequencies (left) and numbers (right) of PD1+CXCR5+GL7+ and PD1+CXCR5+GL7 TFH cells among CD3+CD4+ T cells in PPs. (e) Frequencies (left) and numbers (right) of IgA+GL7 (nonGC) and IgA+GL7+ (GC) cells among B220+ B cells in PPs. (f) Genetic setup of IL-17A fate-mapping reporter mouse. (g) Cell numbers per PP of exTH17, TH17 and IL-10-secreting TH17 cells. (h) Dietary intervention schematic. (i–j) Frequencies (I) and numbers (J) of SILP exTH17 and TH17 cells among CD3+CD4+ T cells, after fasting and mucus wash. (k) Pie charts depicting frequencies of IL-17A-producer cells in PPs. (l) Representative dot plots of ROR-γt versus IL-22 gated on SILP Lin-CD45+CD127+ viable cells. (m) Frequencies (left) and numbers (right) of SILP ILC3s and IL-22-secreing ILC3s. (n) Normalized counts of fut2 gene in ileum cells, as measured by RNA bulk-seq. (o) Dietary interventions and S. Typhimurium infection model. (p, q) Body weight loss and CFUs of S. Typhimurium in SI luminal content and liver. (r) Graph summarizing CFUs in SI luminal content, Shannon’s diversity and il17a/f levels in ileum and PPs as per experimental plan in (O). Data in (A-C) are from one experiment representative of 2 (n = 5 each). Data in (D-E) are a pool of 2 experiments (n = 9 or 10 each). Data in (G) are a pool of 2 experiments, representative of 4 (n = 9, 7, 8 or 5). Data in (I-J) are from 2 experiments (n = 7 or 6). Data in (M) are a pool of 2 experiments (n = 7 each). Data in (N) are from one experiment (n = 3 each). Data in (P) are from one experiment (n = 5 each), representative of 2. Data in (Q) are a pool of 2 experiments (n = 11, 10 or 12). Data are shown as mean ± SEM or median (Q). P.values have been determined by two-tailed non-parametric Mann-Whitney test (B, D-E, G, I-J, M), Brown-Forsythe and Welch ANOVA test (P) or Kruskal-Wallis test with Dunn’s multiple comparisons test (Q). Source data
Extended Data Fig. 3
Extended Data Fig. 3. Systemic effects of FD consumption are not mediated by APCs.
(a) Dietary intervention and immunization strategy. (b) Representative histograms (left) and expression level (right) of MHC class II gated on CD19+ B, CD11c+ pDCs, CD11c+CD11b cDC1 and CD11c+CD11b+ cDC2 cells isolated from draining LNs of RD- and FD-fed mice. (c) Representative histograms (left) and expression level (right) of CD80, CD86 and CD40 gated on CD11c+CD11b cDC1 cells isolated from draining LNs of RD- and FD-fed mice. (d) Representative histograms (left) and expression level (right) of CD80, CD86 and CD40 gated on CD11c+CD11b+ cDC2 cells isolated from draining LNs RD- and FD-fed mice. (e) Dietary intervention and immunization strategy. (f) (Left) Quantification of footpad swelling of recipient mice that had received 1 × 10⁶ OT-II cells and had been fed RD or FD starting from the day of the adoptive transfer. A group of recipient mice received PBS alone as control. (Right) Representative pictures of swollen footpads of recipient mice. Data in (B-D) are a pool of 2 experiments (n = 7 each). Data in (F) are a pool of 2 experiments (n = 10, 9 or 8). Data are shown as mean ± SEM. P-values were determined using a Brown-Forsythe and Welch ANOVA test with Holm-Sidak’s multiple comparisons test. Source data
Extended Data Fig. 4
Extended Data Fig. 4. Effects of FD are not dependent on fat and calorie-intake.
(a) Body weight normalized on day 0 of mice fed RD and FD ad libitum or pair-fed. (b) Serum levels of cholesterol (mg/dll) of mice kept on RD or switched to FD ad libitum or pair-fed. (c) Expression levels of Il17a and Il17f normalized to Tbp and shown as relative to RD, as measured by RT-PCR on total PP (left) and ileum (right) cells isolated from RD-, FD- and FD2-fed mice. (d) Representative dot plots (left) and frequencies (right) of PP TH17 cells among Tconv cells isolated from mice fed a low-fat, fiber-deprived diet (FPD) or low-fat, 30% inulin-added high-fiber diet (FRD). Data in (A-B) are from one experiment (n = 5 each).Data in (C) are a pool of 2 experiments (PPs, n = 8 or 9) and from one experiment, representative of two (ileum, n = 5 each). Data in (D) are a pool of 2 experiments (n = 8 each). Data are shown as mean ± SEM. P.values have been determined by Kruskal-Wallis test with Dunn’s multiple comparisons test (B-C) or two-tailed non-parametric Mann-Whitney test (D). Source data
Extended Data Fig. 5
Extended Data Fig. 5. Effects of short-term consumption of FD on CD4+ T cell metabolism.
(a) Viability of PP cells isolated from FD-fed mice after 72 hours of stimulation in the presence or absence of C2/C4 or TSA. (b, c) Representative histograms (left) and expression level (right) of p-rS6 protein (B) or Mytospy Orange (CMTMRos) (C) gated on TCRVβ+CD4+ viable T cells after 72 hours of stimulation of PP cells isolated from FD-fed mice in the presence or absence of the indicated compounds. (d) Dietary intervention schematic. (e, f) ECAR (E) or glycolysis and glycolytic capacity and reserve (% over baseline, F) measured in CD3+CD4+ T cells isolated from spleens of RD- and FD-fed mice. (g) Representative histogram (left) and expression level (right) of p-rS6 protein gated on TCRVβ+CD4+ viable T cells after 16 hours of stimulation of total splenocytes. (h) Number of mitochondria per cell of FACS-sorted ag-experienced CD4+ T cells (n = 22 or 24). Each dot represents the number of mitochondria per cell. (i) Representative pictures and quantification of Ca2+ microdomains in ag-experienced CD4+ T cells from RD- and FD-fed mice after stimulation with beads (‘B’) coated with anti-CD3 and anti-CD28 antibodies. Data in (A) are a pool of 3 experiments (n = 7 each). Data in (B) are a pool of 3 experiments (n = 8 or 7). Data in (C) are a pool of 4 experiments (n = 10 or 9). Data in (E) are from one experiment representative of 2 (n = 2 each). Data in (F) are a pool of 2 experiments (n = 4 each). Data in (G) are a pool of 5 experiments (n = 13 or 15). Data in (I) are a pool of 7 experiments (n = 7 each; RD n = 30 cells and FD n = 22 cells). Data are shown as mean ± SEM. P.values have been determined by two-tailed non-parametric Mann-Whitney (G, I) or one-tailed mixed-effect analysis with Geisser-Greenhouse correction and Dunnett’s multiple comparisons test (B-C). Source data
Extended Data Fig. 6
Extended Data Fig. 6. Effects of in vivo C2 and C4 supplementation.
(a, b) Representative dot plots (left) and frequencies (right) of IFN-γ-secreting CD4+CD44hi memory T after in vitro PMA/Ionomycin re-stimulation isolated from spleens of mice switched to FD or kept on RD, day 8 (A) or 22 (B) after priming. (c) Body weight normalized to day 0 of RD- and FD-fed mice (+/− C2/C4 supplementation). (d) Food intake (kcal/day) of RD- and FD-fed mice (+/− C2/C4 supplementation). (e) Water intake (mL/day) of RD- and FD-fed mice (+/− C2/C4 supplementation). (f) PCA of stools isolated from RD- and FD-fed mice (+/− C2/C4 supplementation). (g) Relative abundance of bacterial species in stools isolated from RD- and FD-fed mice (+/− C2/C4 supplementation). (h) LDA score showing differentially abundant bacteria in FD vs FD + C2/C4 supplementation. (i) Frequencies of PP TH17 cells among Tconv cells isolated from mice fed RD or switched to FD for 3 days with or without C2/C4 supplementation in their drinking water (FD + C2/C4). Data in (A-B) are a pool of 2 experiments (n = 9 or 8). Data in (C-E) are from a pool of 2 experiments (weight gain, n = 9 or 10; food and water, n = 4 or 5, measured per cage). Data in (F-H) are from one experiment (n = 5 or 6). Data in (I) are a pool of 2 experiments (n = 6, 5 or 8). Data are shown as mean ± SEM. P.values have been determined by two-tailed non-parametric Mann-Whitney (A-B) or Kruskal-Wallis test with Dunn’s multiple comparisons test (I). Source data
Extended Data Fig. 7
Extended Data Fig. 7. Human dietary intervention study.
(a) Schematic showing the human dietary intervention study. (b) PCA of stools isolated from each volunteer at the end of each dietary interventions. (c) Representative dot plots of human PBMCs gated on viable CD3 cells showing specificity of IFN-γ and IL-17A staining. (d) Representative dot plots of unstimulated and stimulated (with and without FMOs for anti-IFN-γ-BV786 and anti-IL17A-BV421) human PBMCs gated on viable CD3+CD4+ cells. (e) PCA of stools isolated from GF mice after being colonized with FRD or FPD-human stools. Three volunteers used are shown. Each dot represents one GF mouse; 3 GF mice per volunteer per time-point were used.

Comment in

References

    1. Hoch T, Pischetsrieder M, Hess A. Snack food intake in ad libitum fed rats is triggered by the combination of fat and carbohydrates. Front. Psychol. 2014;5:250. doi: 10.3389/fpsyg.2014.00250. - DOI - PMC - PubMed
    1. Drewnowski A. Taste preferences and food intake. Annu. Rev. Nutr. 1997;17:237–253. doi: 10.1146/annurev.nutr.17.1.237. - DOI - PubMed
    1. Imaizumi M, Sawano S, Takeda M, Fushiki T. Grooming behavior in mice induced by stimuli of corn oil in oral cavity. Physiol. Behav. 2000;71:409–414. doi: 10.1016/S0031-9384(00)00346-2. - DOI - PubMed
    1. Manabe, Y., Matsumura, S. & Fushiki, T. in Fat Detection: Taste, Texture, and Post Ingestive Effects (eds Montmayeur, J.-P. & le Coutre, J.) Ch. 10 (CRC Press/Taylor & Francis, 2010). - PubMed
    1. Drewnowski, A. & Almiron-Roig, E. in Fat Detection: Taste, Texture, and Post Ingestive Effects (eds Montmayeur, J.-P. & le Coutre, J.) Ch. 11 (CRC Press/Taylor & Francis, 2010). - PubMed

Publication types