. 2023 Sep;24(9):1579-1590.
doi: 10.1038/s41590-023-01584-0. Epub 2023 Aug 14.

Single-cell multiomic analysis of thymocyte development reveals drivers of CD4+ T cell and CD8+ T cell lineage commitment

Affiliations

Single-cell multiomic analysis of thymocyte development reveals drivers of CD4+ T cell and CD8+ T cell lineage commitment

Zoë Steier et al. Nat Immunol. 2023 Sep.

Abstract

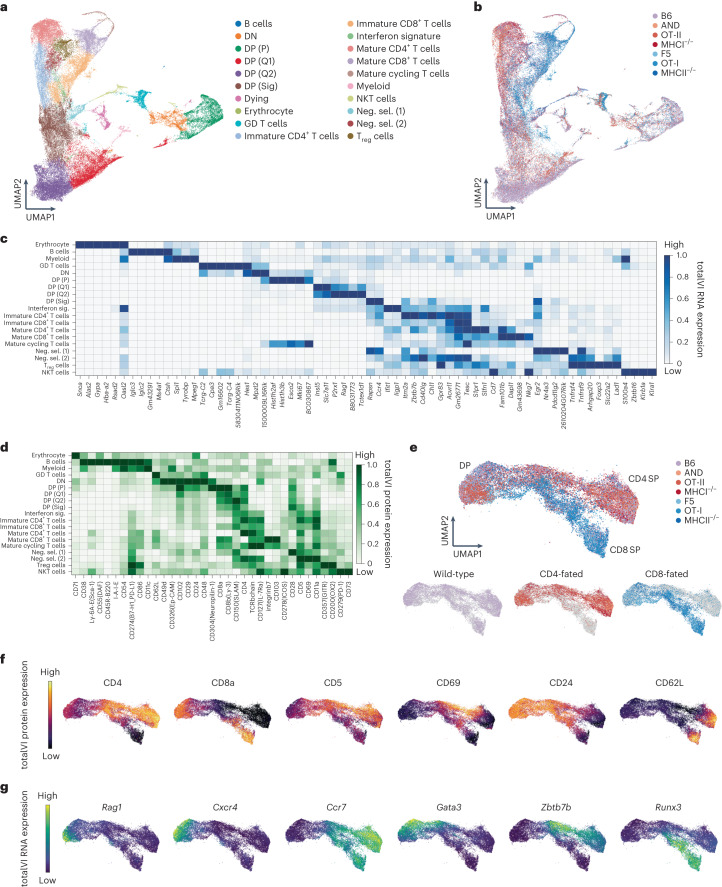
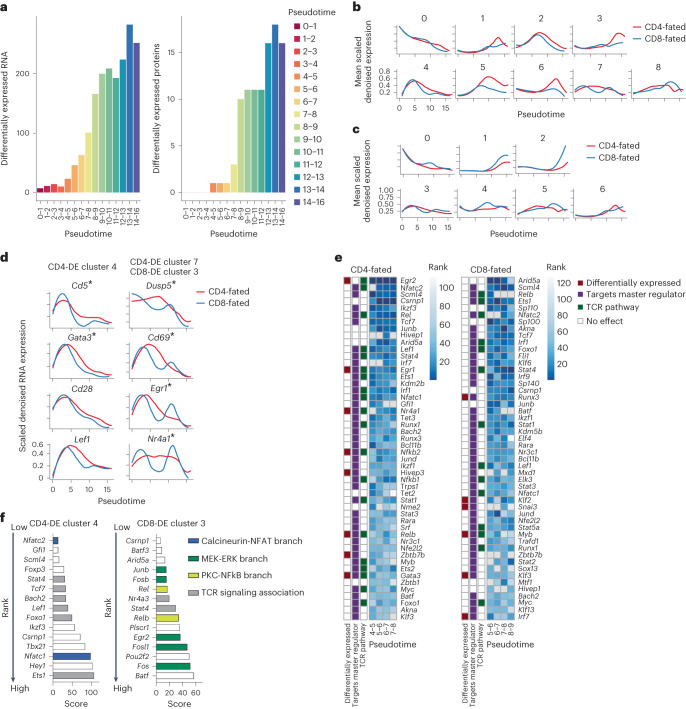
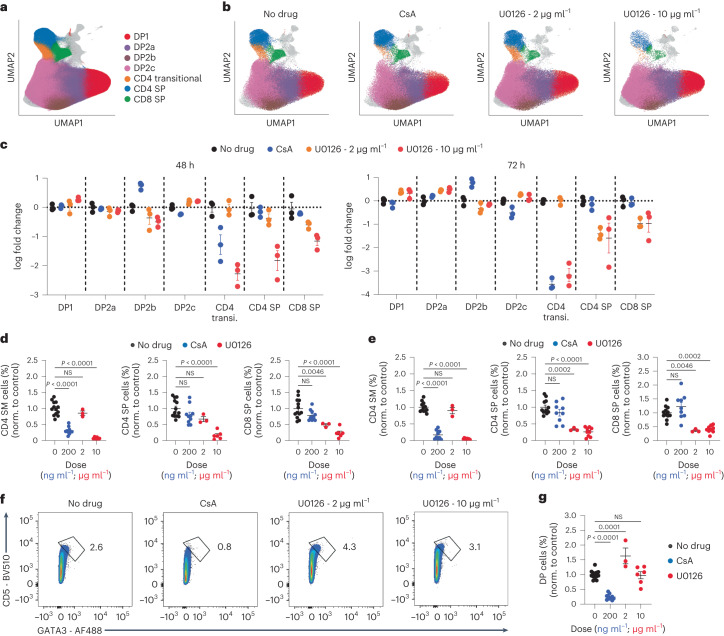
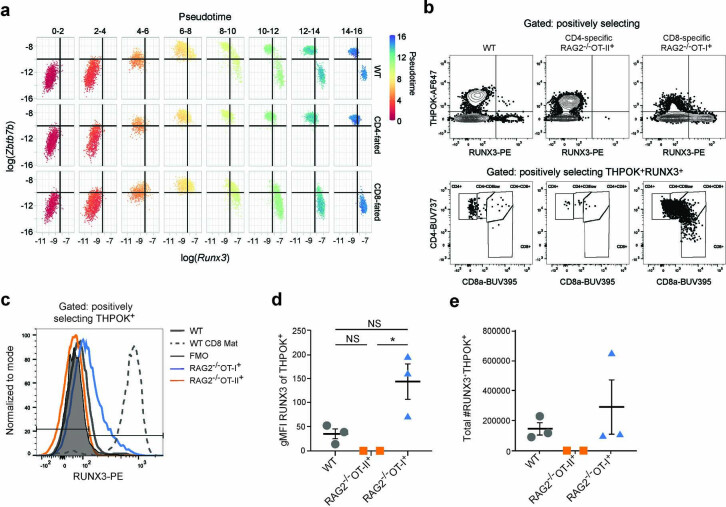
The development of CD4+ T cells and CD8+ T cells in the thymus is critical to adaptive immunity and is widely studied as a model of lineage commitment. Recognition of self-peptide major histocompatibility complex (MHC) class I or II by the T cell antigen receptor (TCR) determines the CD8+ or CD4+ T cell lineage choice, respectively, but how distinct TCR signals drive transcriptional programs of lineage commitment remains largely unknown. Here we applied CITE-seq to measure RNA and surface proteins in thymocytes from wild-type and T cell lineage-restricted mice to generate a comprehensive timeline of cell states for each T cell lineage. These analyses identified a sequential process whereby all thymocytes initiate CD4+ T cell lineage differentiation during a first wave of TCR signaling, followed by a second TCR signaling wave that coincides with CD8+ T cell lineage specification. CITE-seq and pharmaceutical inhibition experiments implicated a TCR-calcineurin-NFAT-GATA3 axis in driving the CD4+ T cell fate. Our data provide a resource for understanding cell fate decisions and implicate a sequential selection process in guiding lineage choice.


Conflict of interest statement

T.H. was employed by BioLegend, Inc. while engaged in this research project. The other authors declare no competing interests.

Figures

Fig. 1
Fig. 1. A joint transcriptomic and surface protein atlas of thymocyte development in wild-type and lineage-restricted mice.
a,b, UMAP plots of the totalVI latent space from CITE-seq on total thymocytes from wild-type (WT), CD4-fated (MHCI−/−, OT-II and AND) and CD8-fated (MHCII−/−, OT-I and F5) mice, labeled by cell-type annotation (a) and mouse genotype (b). c,d, Heatmaps of markers derived from totalVI one-vs-all differential expression test between cell types for RNA (c) and proteins (d) in thymocytes from mice as in a. Values are totalVI denoised expression. e, UMAP plots of the totalVI latent space from positively selected thymocytes with cells labeled by mouse genotype. f, UMAP plots of the totalVI latent space from positively selected thymocytes. Cells colored by totalVI denoised expression of protein markers of lineage (CD4, CD8a), TCR signaling (CD5, CD69) and maturation (CD24, CD62L). g, Cells colored by totalVI denoised expression of RNA markers of TCR recombination (Rag1), thymic location (Cxcr4, Ccr7), and lineage regulation (Gata3, Zbtb7b, Runx3) as in f. GD T cells, gamma-delta T cells; DN, double negative; DP (P), double positive proliferating; DP (Q1), DP quiescent 1; DP (Q2), DP quiescent 2; DP (Sig.), DP signaled; Neg. sel. (1), negative selection 1; Neg. sel. (2), negative selection 2; Treg cell, regulatory CD4+ T cell; NKT cell, natural killer T cell.
Fig. 2
Fig. 2. Pseudotime inference captures continuous maturation trajectory and clarifies intermediate thymocyte stages.
a, UMAP plot of the totalVI latent space from positively selected thymocytes with cells colored by Slingshot pseudotime and smoothed curves representing the CD4+ and CD8+ T cell lineages. b, Heatmap of RNA (top) and protein (bottom) markers of thymocyte development over pseudotime in the CD4+ and CD8+ T cell lineages. Features are colored by totalVI denoised expression, scaled per row, and sorted by peak expression in the CD4+ T cell lineage. Pseudotime axis is the same as in a. c, Expression of features in the CD4+ and CD8+ T cell lineages that vary over pseudotime. Features are totalVI denoised expression values scaled per feature and smoothed by loess curves. d, Heatmap of all RNA differentially expressed over pseudotime in any lineage. Features are scaled and ordered as in b. Labeled genes are highly differentially expressed over time (Methods). e, In silico flow cytometry plots of log(totalVI denoised expression) of CD8a and CD4 from positively selected thymocytes (left) and the same cells separated by lineage (right). Cells are colored by pseudotime. Gates were determined based on contours of cell density. WT, wild-type. f, In silico flow cytometry plot of data as in e separated by lineage and pseudotime. g, UMAP plot of the totalVI latent space from positively selected thymocytes with cells colored by gate. Cells were computationally grouped into eight gates using CD4, CD8a, CD69, CD127(IL-7Ra), and TCRβ. h, Histograms of cells separated by lineage and gate with cells colored by gate as in g. i, Stacked histograms of gated populations in CD4-fated (top) and CD8-fated (bottom) thymocytes, with thresholds classifying gated populations over pseudotime (Methods). j, Schematic timeline aligns pseudotime with gated populations, with population timing determined as in i.
Fig. 3
Fig. 3. Paired measurements of RNA and protein reveal the timing of major events in CD4-CD8 lineage commitment.
a, Expression over pseudotime of TCR signaling response molecules. Features are totalVI denoised expression values scaled per feature and smoothed by loess curves. Schematic timeline below the plot aligns pseudotime with gated populations (see Fig. 2j). b, Differential expression over pseudotime between CD4-fated and CD8-fated thymocytes for RNA of TCR signaling response molecules. Non-significant (NS) differences are gray, significant differences are filled circles. Size of the circle indicates log(Bayes factor). Data are median log fold change ± totalVI-computed s. d. c, Expression over pseudotime as in a for RNA of key transcription factors. d, Differential expression over pseudotime as in b for RNA of key transcription factors. e, In silico flow cytometry plots of log(totalVI denoised expression) of Runx3 and Zbtb7b from positively selected thymocytes separated by lineage and colored by pseudotime. f, Expression over pseudotime as in a for coreceptor RNA and protein. g, Differential expression over pseudotime as in b for RNA of coreceptors. Significant RNA results are filled circles and significant protein results are open circles. b,d,g, n = 9,545 CD4-fated cells (MHCI−/−, OT-II and AND mice) and 9,126 CD8-fated cells (MHCII−/−, OT-I and F5 mice).
Fig. 4
Fig. 4. Gene expression differences between CD4-fated and CD8-fated cells implicate putative drivers of lineage commitment.
a, Number of differentially expressed features between CD4-fated (MHCI−/−, OT-II and AND) and CD8-fated (MHCII−/−, OT-I and F5) cells across pseudotime. b, Genes (RNA) upregulated in CD4-fated versus CD8-fated cells scaled per gene and clustered by the Leiden algorithm according to expression in CD4-fated cells. Expression over pseudotime per cluster is displayed as the mean of scaled totalVI denoised expression per gene for genes in a cluster, smoothed by loess curves. c, As in b, but for genes upregulated in CD8-fated cells, clustered according to expression in CD8-fated cells. d, Expression over pseudotime of selected TCR target genes that are differentially expressed between the two lineages and putative targets of Nfatc2, according to ChEA3. Asterisk indicates genes differentially expressed during the time windows used for ranking in e. totalVI denoised expression values are scaled per gene and smoothed by loess curves. e, Transcription factor enrichment analysis by ChEA3 for CD4-lineage-specific differentially expressed genes (left). Transcription factors are ranked by mean enrichment in the three pseudotime bins before Zbtb7b differential expression (pseudotime 4–7; pseudotime 7–8 is for visualization only). Gray indicates genes detected in less than 5% of cells in the relevant population. ‘Differentially expressed’ indicates significant upregulation in at least one of the relevant time bins. ‘Targets master regulator’ indicates a transcription factor that targets either Gata3, Runx3, or Zbtb7b in ChEA3 databases. ‘TCR pathway’ indicates membership in NetPath TCR Signaling Pathway, genes transcriptionally upregulated by TCR signaling, or genes with literature support for TCR pathway membership. Right column is the same as the left but for CD8 lineage-specific differentially expressed genes, with ranking by mean enrichment in the three pseudotime bins before Runx3 differential expression (pseudotime 5–8; pseudotime 8–9 is for visualization only). f, Transcription factor enrichment analysis for TCR target-enriched gene clusters. The top 15 transcription factors enriched in the gene sets are shown. Colors represent transcription factors activated by the respective branch of TCR signaling. Gray indicates additional transcription factors associated with TCR signaling based on Netpath. In e and f, lower ranks and lower scores are better (meaning more enrichment).
Fig. 5
Fig. 5. Calcineurin blockade impairs new CD4 SP development and GATA3 induction.
a, Frequency (% of live cells) of CD4+CD8lo, CD4 SM, CD4 SP or CD8 SP in thymic slices from postnatal (day 1) wild-type mice cultured with in 50, 100 or 200 ng ml−1 cyclosporin A (CsA) for 96 h. Data were compiled from three independent experiments and analyzed using an ordinary one-way ANOVA. No CsA, n = 10; 50 ng ml−1, 100 ng ml−1 and 200 ng ml−1, n = 7 each. Gating strategy, Extended Data Fig. 7a. b, Frequency (% of live cells) of CD4+CD8lo and CD4 SM cells after 0, 24, 48, 72 and 96 h culture in medium alone or with 200 ng ml−1 CsA as in a. Data were compiled from nine independent experiments. No CsA: 0 h, n = 6; 24 h, n = 9; 48 h, n = 10; 72 h, n = 22; 96 h, n = 10. 200 ng ml−1 CsA: 24 h, n = 6; 48 h, n = 7; 72 h, n = 14; 96 h, n = 7. Data were analyzed using an ordinary two-way ANOVA with multiple comparisons. c, Frequency (% of live cells) of EdU+ DP, EdU+ CD4+CD8lo, and EdU+ CD4 SP thymocyte populations from AND mice (i.p.) injected with EdU, rested for 16 h, and then treated with 1 (24 h) or 2 (48 h) 5 μg doses of FK506 (i.p.) every 24 h. Each dot represents one mouse. Data were pooled from three independent experiments. FK506 mice, n = 5; control, n = 4. d,e, Geometric mean fluorescent intensity (gMFI) of GATA3 detected by intracellular flow cytometry staining in CD69+ DP thymocytes from wild-type neonatal thymic slice cultures after 48-h treatment with 200 ng ml−1 CsA (d) or 72-h treatment with 6.3 ng ml−1 FK506 (e). Data were compiled from three (d) or two (e) independent experiments. For d, no CsA, n =  10 ; 200 ng ml−1CsA, n = 10. Fore, no FK506, n = 6; 6.3 ng ml−1 FK506, n = 6. Each symbol represents a thymic slice. Data were analyzed using an unpaired, two-sided t-test. norm., normalized; NS, not significant. Error bars indicate mean ± s.e.m.
Fig. 6
Fig. 6. Calcineurin inhibition selectively impacts the CD4 audition.
a, UMAP plots of individual thymocytes from thymic slices of postnatal (day 1) wild-type mice cultured with no drug or CsA (200 ng ml−1) or U0126 (2 μg ml−1 or 10 μg ml−1) for 48 or 72 h. DP and SP populations are highlighted. b, UMAP plots for the 48-h time point separated into no drug, 200 ng ml−1 CsA, 2 μg ml−1 or 10 μg ml−1 U0126 conditions as in a. c, Scatter plots showing the log fold change in cell-type proportions relative to no-drug control for DP1, DP2a, DP2b, DP2c, CD4 transitional, CD4 SP and CD8 SP cell clusters for no drug, 200 ng ml−1 CsA, 2 μg ml−1 or 10 μg ml−1 U0126 conditions. Each dot is a separate thymic slice, and data are normalized to the mean of the no-drug condition. Error bars indicate mean ± s.e.m. d,e, Frequency (% of live cells) in CD4 SM, CD4 SP and CD8 SP populations normalized to untreated control at 48 h (d) or 72 h (e) of culture as in a, assessed by manual gating (Extended Data Fig. 7a). Error bars indicate mean ± standard error of the mean. f,g, Representative flow cytometry plots (f) and compiled data (g) showing the expression of CD5 and GATA3 in gated DP thymocytes from thymic slices cultured for 48 h with no drug, 200 ng ml−1 CsA, 2 μg ml−1 or 10 μg ml−1 U0126 as in a. ac, Data are from one representative experiment out of two. d,e,g, Each dot represents a thymic slice; data are compiled from three independent experiments for CsA (200 ng ml−1), n = 10; one experiment for U0126 low (2 μg ml−1), n = 3; two independent experiments for U0126 high (10 μg ml−1), n = 6; and four independent experiments for no drug, n = 13.
Extended Data Fig. 1
Extended Data Fig. 1. Sorting and characterization of positively selecting thymocytes.
a, Representative FACS plots displaying gating strategy to sort thymocytes for CITE-seq. Cell populations were gated and sorted to include lymphocytes, exclude forward scatter doublets, include Ghost Dye Violet 510 Live/Dead stain negative (live cells), then on TCRβ+CD5+ to enrich for cells that were positively selecting. b-c, Heatmaps of manually selected cell-type markers for RNA (b) and proteins (c). Values are totalVI denoised expression. d, UMAP plot of totalVI latent space from positively selected thymocytes before filtering indicating annotated populations that were retained (positively selecting thymocytes) or removed (all other populations) from downstream analysis.
Extended Data Fig. 2
Extended Data Fig. 2. Pseudotime inference identifies intermediate thymocyte stages that can be identified by flow cytometry.
a, Correlation between Slingshot pseudotime inferred from the full 20-dimensional totalVI latent space and a 2-dimensional UMAP projection of the 20-dimensional latent space. b, UMAP plot of the totalVI latent space from positively selected thymocytes. Cells are colored according to placement in eight bins uniformly spaced over 2D pseudotime for visualization. c, In silico flow cytometry plots of log(totalVI denoised expression) of CD127(IL-7Ra) and CD69 from positively selected thymocytes (left) and the same cells separated by lineage (right). Cells are colored by pseudotime. d, Data as in c separated by lineage and pseudotime. e, In silico flow cytometry plots of log(totalVI denoised expression) of TCRβ and CD5 from DP thymocytes (left) and the same cells separated by lineage (right). Cells are colored by pseudotime. Among DP thymocytes, the DP3 population is TCRβhi, CD127+ and CD69+. f, Schematic of CD4 versus CD8 biaxial plot to identify eight gated populations in adult thymocytes: DP1, DP2, CD4+CD8lo, semimature CD4 (CD4 SM), mature CD4 (CD4 Mat), DP3, semimature CD8 (CD8 SM), and mature CD8 (CD8 Mat). Circles represent lineage uncommitted cells, squares represent CD4+ T lineage cells, and triangles represent CD8+ T lineage cells. g, Representative flow cytometry gating strategy for thymocyte populations in adult mice. Thymocytes were harvested from 6-8-week-old wild-type, MHCI-/- or MHCII-/- mice. Cell populations were gated to include lymphocytes, exclude forward scatter and side scatter doublets, include live cells, include TCRβ+CD5int/hi, then on CD4 versus CD8. Cell populations were gated into the following subsets based upon cell surface marker expression: DP1 (CD4+CD8+CD127CD69), DP2 (CD4+CD8+CD127CD69+), CD4+CD8lo (CD4+CD8lo; CD4+CD8loCD69+), DP3 (CD4+CD8+TCRβhiCD5+CD127+CD69+), semimature CD4 (CD4 SM; CD4+CD8CD69+), mature CD4 (CD4 Mat; CD4+CD8CD69), semimature CD8 (CD8 SM; CD8+CD69+), and mature CD8 (CD8 Mat; CD8+CD69). h, Cell-type frequencies for the eight gated populations defined by CITE-seq as in Fig. 2g, h and by flow cytometry as in f-g. Frequencies were derived from the five wild-type mice in the CITE-seq data set and seven wild-type mice for flow cytometry. Error bars denote mean ± standard deviation.
Extended Data Fig. 3
Extended Data Fig. 3. CITE-seq and fluorescence-based flow cytometry reveal the timing of expression for transcription factors and other features of CD4-CD8 T cell development.
a, Expression over pseudotime of Cd69 (dashed) and CD69 (solid). Features are totalVI denoised expression values scaled per feature and smoothed by loess curves. b, Expression of RNA and protein features over pseudotime by genotype. Features are totalVI denoised expression values scaled per feature and smoothed by loess curves. A resource of protein and RNA expression over pseudotime for all differentially expressed features is in Supplementary Information. c, Transcription factor protein expression in adult thymocyte populations. Representative histograms displaying GATA3, THPOK, and RUNX3 transcription factor expression detected by intracellular flow cytometry staining in CD4-fated (MHCI-/-) and CD8-fated (MHCII-/-) thymocyte populations. Thymocyte populations were gated on lymphocytes, excluding forward scatter and side scatter doublets, live cells, TCRβ+CD5int/hi then on CD4 versus CD8. Cell populations were gated into the following subsets based upon cell surface marker expression: DP1 (CD4+CD8+CD127CD69), DP2 (CD4+CD8+CD127CD69+), DP3 (CD4+CD8+TCRβhiCD5+CD127+CD69+), CD4+CD8lo (CD4+CD8loCD69+), semimature CD4 (CD4 SM, CD4+CD8CD69+), mature CD4 (CD4 Mat, CD4+CD8CD69), semimature CD8 (CD8 SM, CD8+CD69+), and mature CD8 (CD8 Mat, CD8+CD69). Data is concatenated from n = 4 mice per genotype. Positive staining was determined using a fluorescence minus one control. d, Expression over pseudotime of the Hallmark Il2-Stat5 Signaling signature displayed as the mean of scaled totalVI denoised expression per gene, smoothed by loess curves.
Extended Data Fig. 4
Extended Data Fig. 4. CITE-seq and fluorescence-based flow cytometry of key transcription factors.
a, In silico flow cytometry plots of log(totalVI denoised expression) of Runx3 and Zbtb7b from positively selected thymocytes separated by pseudotime. b, Dual expression of THPOK and RUNX3 in positively selecting CD8-fated thymocytes. Top row shows representative flow cytometry contour plots of gated positively selecting thymocytes (CD5+, CD4+ or CD8+, CD24lo/int) displaying RUNX3 vs THPOK protein expression from 6-8-week-old, adult wild-type, CD4-fated (Rag2-/-/OT-II+) and CD8-fated (Rag2-/-/OT-I+) mice. Positive staining and gates were determined using fluorescence minus one (FMO) controls. Bottom row shows representative FACS dot plots displaying CD8a vs CD4 expression in positively selecting RUNX3+THPOK+ thymocytes. c, Representative histogram overlays displaying RUNX3 expression in THPOK+ positively selecting thymocytes from Rag2-/-/OT-II+ (orange), Rag2-/-/OT-I+ (blue) and wild-type (WT, gray) mice. RUNX3 expression in CD8 Mat cells (CD8+CD4TCR+) from WT mice (gray, dashed line) is included for comparison. FMO is displayed as thin line, filled histogram (black). d, Compiled data showing geometric mean fluorescent (gMFI) intensity of RUNX3 on THPOK+ positively selecting thymocytes. gMFI for each sample was calculated by subtracting the gMFI of the FMO. e, Total number of positively selecting RUNX3+THPOK+ thymocytes in each mouse. Data is compiled from two independent experiments. Error bars indicate mean ± SEM. In d-e, each symbol represents 1 mouse. For WT mice (n = 3), Rag2-/-/OT-II+ (n = 2), and Rag2-/-/OT-I+ (n = 3). NS, not significant.
Extended Data Fig. 5
Extended Data Fig. 5. Sequential selection model of thymocyte development.
A sequential selection model for CD4+ versus CD8+ T cell lineage commitment. Key events during positive selection inferred from CITE-seq data are displayed from left to right in their order of occurrence based on pseudotime. CD4-fated and CD8-fated indicate MHCII- and MHCI-specific thymocytes, respectively. Colored circles indicate the order of appearance of key thymocyte stages as defined by cell surface markers. Shaded red area indicates the time window during which both CD4- and CD8-fated thymocytes audition for the CD4+ T cell fate, corresponding to upregulation of GATA3 followed by THPOK. Shaded blue area indicates the later time window during which those thymocytes that failed the CD4 audition (mostly CD8-fated) receive CD8+ T cell lineage reinforcement and survival signals. Green horizontal bars indicate two distinct temporal waves of TCR signaling: a first wave that is stronger and more sustained in CD4- compared to CD8-fated thymocytes, and a second later wave that occurs only in CD8-fated thymocytes during the CD8+ T cell lineage specification phase. Stars indicate the key time points of lineage divergence, including the earliest detection of greater TCR signals and GATA3 upregulation in CD4-fated thymocytes (purple star), followed by preferential THPOK induction and CD8 repression in CD4-fated thymocytes (pink star), and finally preferential RUNX3 induction and CD4 repression in CD8-fated thymocytes (blue star). Red bracket indicates the time window during which MHCII-specific thymocytes commit to the CD4+ T cell lineage by fully upregulating THPOK, leading to activation of a THPOK autoregulation loop and full repression of CD8. Blue bracket indicates the time window during which CD8-fated thymocytes turn on RUNX3, leading to repression of THPOK and CD4.
Extended Data Fig. 6
Extended Data Fig. 6. Differential expression and transcription factor enrichment distinguish CD4+ and CD8+ T cell lineages.
a, totalVI median log fold change over pseudotime of genes upregulated in CD4-fated cells relative to CD8-fated cells. Genes are grouped by clusters shown in Fig. 4b. Clusters are ordered by their average highest magnitude fold change. b, totalVI median log fold change over pseudotime of genes downregulated in CD4-fated cells relative to CD8-fated cells (that is, upregulated in CD8-fated cells). Genes are grouped by clusters shown in Fig. 4c. Clusters are ordered by their average highest magnitude fold change. c, Transcription factor (TF) enrichment analysis for TCR target-enriched gene cluster CD4-DE cluster 7. The top 30 TFs enriched in the gene set are shown. The full ChEA3 enrichment analysis is in Supplementary Data 11-12. Colors indicate TFs activated by the respective branch of TCR signaling. Gray indicates additional TFs associated with TCR signaling based on Netpath. Lower ranks and lower scores are better (meaning more enrichment).
Extended Data Fig. 7
Extended Data Fig. 7. Inhibition of calcineurin blocks new CD4 SP development and GATA3 induction.
a, Flow cytometry gating strategy for neonatal thymic slice samples. b, Time course of thymocyte development in neonatal slice cultures. Frequency (% of live cells) of the indicated populations after 0 (n = 6), 24 (n = 9), 48 (n = 10), 72 (n = 22) and 96 (n = 10) hours of culture. Error bars indicate mean ± SEM. Data were compiled from 9 independent experiments with wild-type (WT) slices. c, Frequency (% of live cells) of CD4+CD8lo cells in slices from MHCI-/- (squares) or MHCII-/- (triangles) mice following culture in medium alone (No CsA) or with 200 ng ml-1 CsA for 96 hours. Error bars indicate mean ± SEM. Data were compiled from 2 independent experiments with MHCI-/- thymic slices: no CsA (n = 9), 200 ng ml-1 CsA (n = 9), and 5 independent experiments with MHCII-/- slices: no CsA (n = 13), 200 ng ml-1 CsA (n = 11). d, Schematic of in vivo EdU labeling and calcineurin blockade. AND mice were injected with EdU to label proliferating thymocytes undergoing TCRβ selection. Starting at 16 hours mice were treated with the calcineurin inhibitor FK506 daily for 24 or 48 hours. Thymocytes were analyzed by flow cytometry. e, Gating strategy for in vivo EdU-FK506 experiment. f, Frequency (% of live cells) of the indicated thymocyte populations with and without FK506. Each dot represents an individual mouse (n = 5 for FK506-treated, n = 4 for non-treated), and data are pooled from 3 independent experiments. Error bars indicate mean ± SEM. g, Thymocytes from FK506-treated or control AND mice were stimulated via TCR crosslinking and analyzed by intracellular pERK staining and flow cytometry. Left panel shows a representative histogram of pERK induction in gated CD4+CD8+ thymocytes upon TCR crosslinking. Unstimulated samples (no crosslinking) are shown in gray. Right panel shows quantification of pERK induction (% of DP) with and without FK506 treatment. Data are compiled from 2 independent experiments, and each dot corresponds to a sample (+ FK506 n = 3, control n = 2). h, Frequency of the indicated populations after culture in the presence of the indicated concentration of FK506 for 72 hours. Data is from one experiment (n = 3), representative of 2 independent experiments. Each dot represents a thymic slice. Error bars indicate mean ± SEM. Data was analyzed using an ordinary one-way ANOVA. NS indicates not significant.
Extended Data Fig. 8
Extended Data Fig. 8. Multidimensional computation gating of neonatal slice cultures with calcineurin or MEK blockade.
Thymic tissue slices were prepared from postnatal (day 1) mice and cultured with either calcineurin inhibitor CsA or MEK inhibitor U0126. a, U0126-treated thymic slices were incubated in concentrations ranging from 10 μg ml-1 to 0.63 μg ml-1. Plots show frequency (%) out of live cells. Each dot represents a thymic slice (n = 3). Plots are representative of 3 independent experiments. b, UMAP plots of multidimensional flow cytometry data colored by scaled expression of each flow cytometry marker. Data are pooled samples from the representative experiment shown in Fig. 6a–c and Extended Data Fig. 9. c, Heatmap of relative protein expression of markers in each subset shown in Fig. 6a–c and Extended Data Fig. 9.
Extended Data Fig. 9
Extended Data Fig. 9. Calcineurin inhibition selectively impacts the CD4 audition.
Thymic tissue slices were prepared from postnatal (day 1) mice and cultured with either calcineurin inhibitor CsA (200 ng ml-1) or MEK inhibitor U0126 (2 μg ml-1 or 10 μg ml-1). Thymic slices were collected at 48 or 72 hours, stained with fluorescent antibodies and analyzed by either manual or computational, multidimensional gating. a, UMAP based on multidimensional flow cytometry data from all samples. b, Cells from the CD4 transitional cluster defined by computational gating (blue) are superimposed on live gated cells (red, left panel) or CD4+CD8- gated cells (red, right panel) for comparison with manual gating strategy. A 48-hour, no drug control sample is shown. c, UMAP plot by the indicated experimental condition. d, Scatter plots showing the log fold change in cell type proportion relative to no drug control for indicated cell clusters for each condition, separated by time (left panel is 48 hours; right panel is 72 hours). Error bars indicate mean ± SEM. Data is from one representative experiment out of two.

References

    1. Germain RN. T-cell development and the CD4–CD8 lineage decision. Nat. Rev. Immunol. 2002;2:309–322. doi: 10.1038/nri798. - DOI - PubMed
    1. Xiong Y, Bosselut R. CD4–CD8 differentiation in the thymus: connecting circuits and building memories. Curr. Opin. Immunol. 2012;24:139–145. doi: 10.1016/j.coi.2012.02.002. - DOI - PMC - PubMed
    1. Singer A, et al. Lineage fate and intense debate: Myths, models and mechanisms of CD4- versus CD8-lineage choice. Nat. Rev. Immunol. 2008;8:788–801. doi: 10.1038/nri2416. - DOI - PMC - PubMed
    1. Shinzawa M, et al. Reversal of the T cell immune system reveals the molecular basis for T cell lineage fate determination in the thymus. Nat. Immunol. 2022;23:731–742. doi: 10.1038/s41590-022-01187-1. - DOI - PMC - PubMed
    1. Kisielow P, Miazek A. Positive selection of T cells: rescue from programmed cell death and differentiation require continual engagement of the T cell receptor. J. Exp. Med. 1995;181:1975–1984. doi: 10.1084/jem.181.6.1975. - DOI - PMC - PubMed

Publication types

Substances