. 2023 Sep;24(9):1565-1578.
doi: 10.1038/s41590-023-01575-1. Epub 2023 Aug 14.

Single-cell analysis of human MAIT cell transcriptional, functional and clonal diversity

Affiliations

Single-cell analysis of human MAIT cell transcriptional, functional and clonal diversity

Lucy C Garner et al. Nat Immunol. 2023 Sep.

Abstract

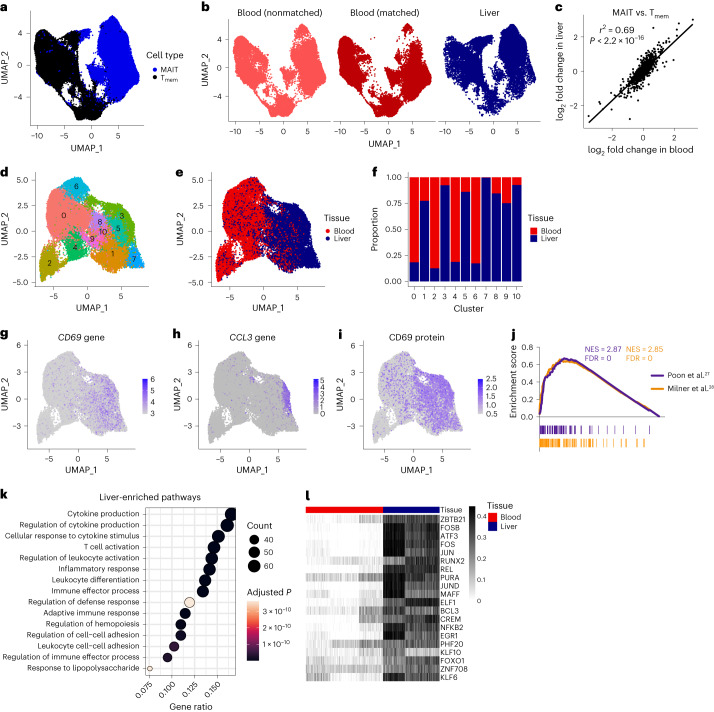
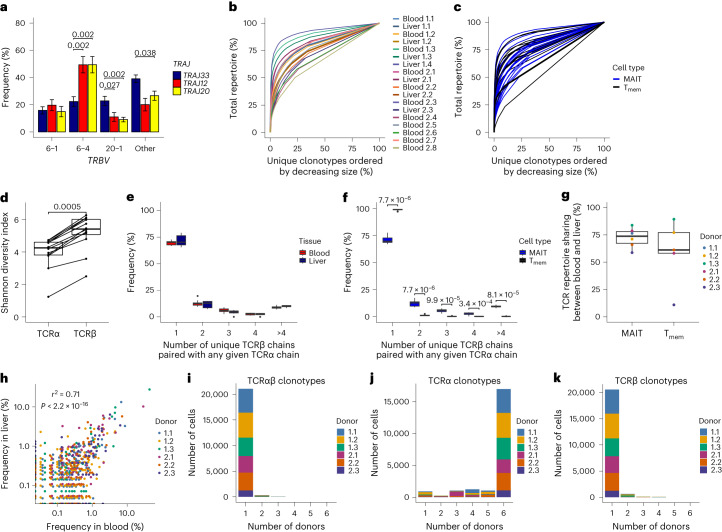
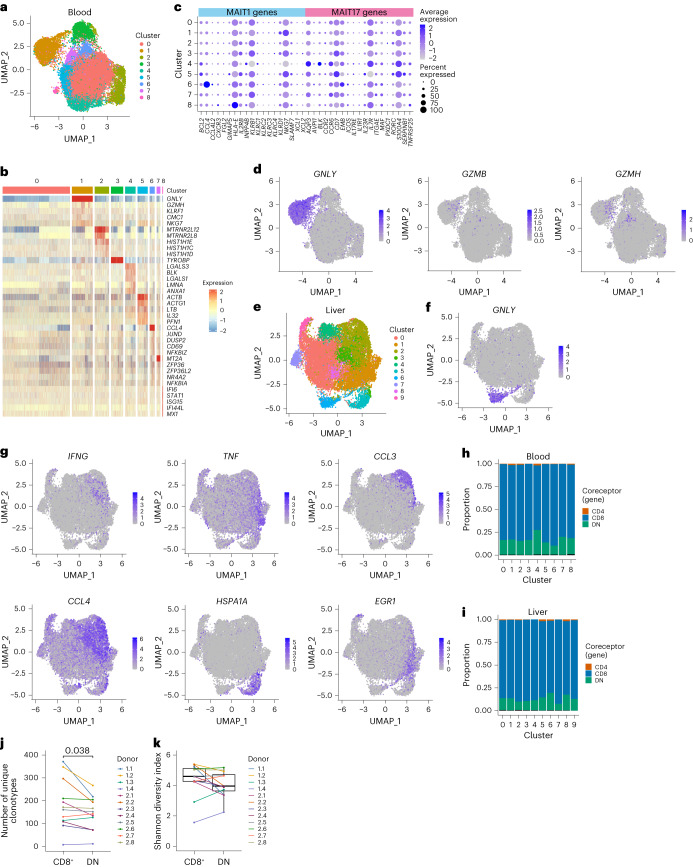
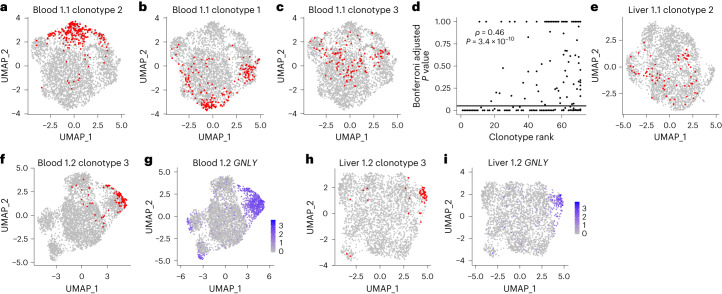
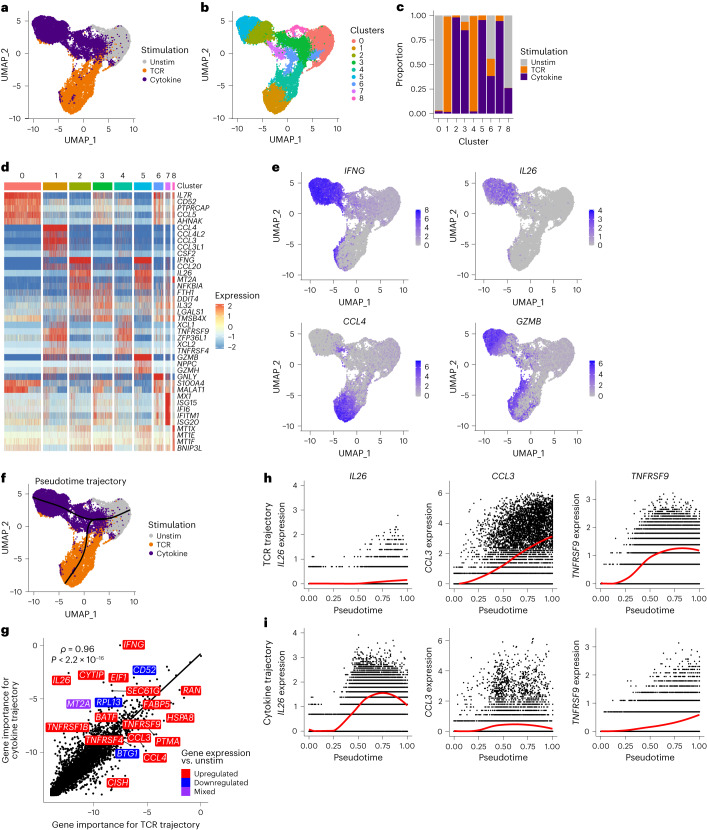
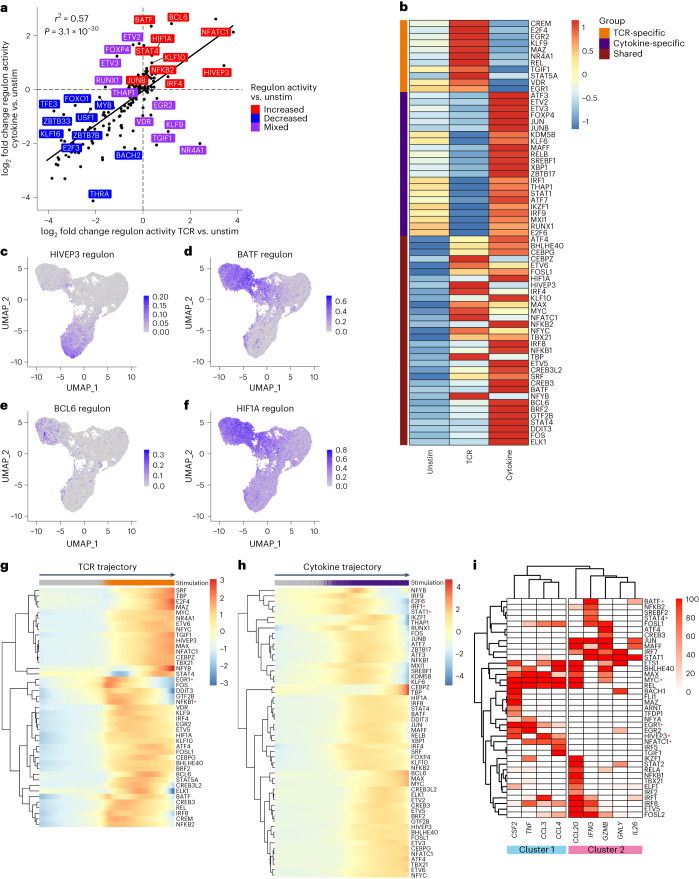
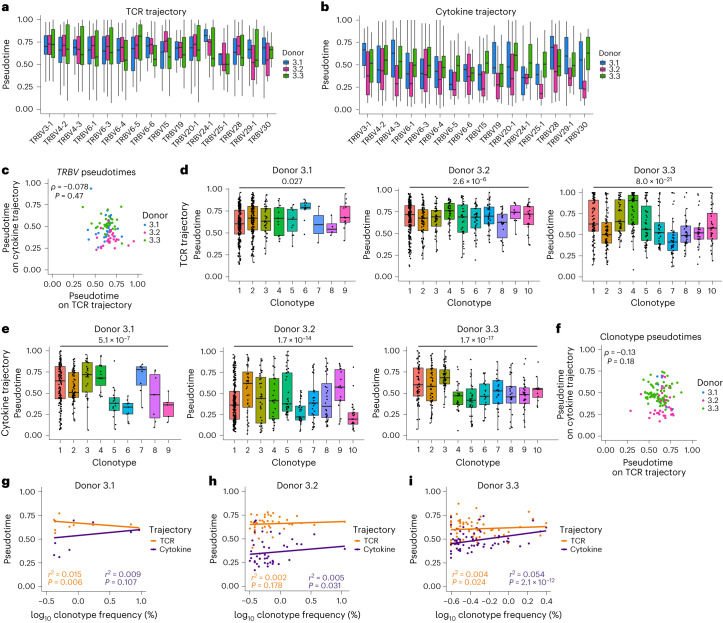
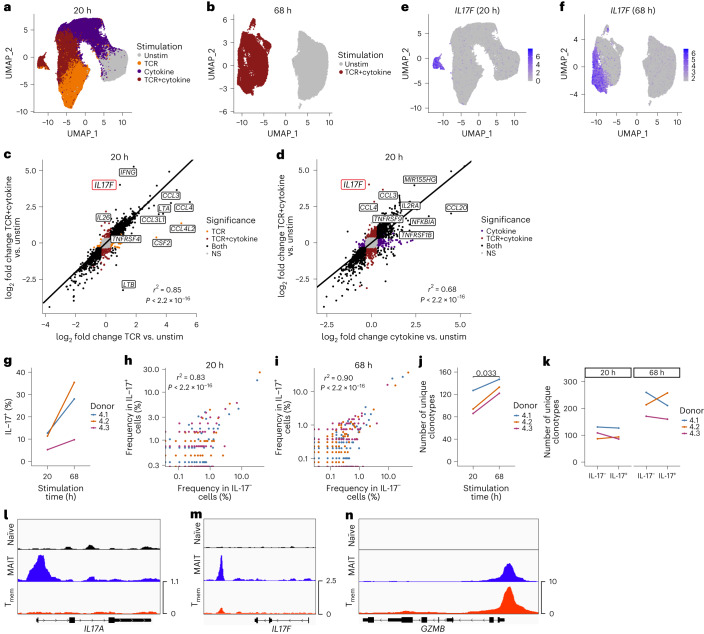
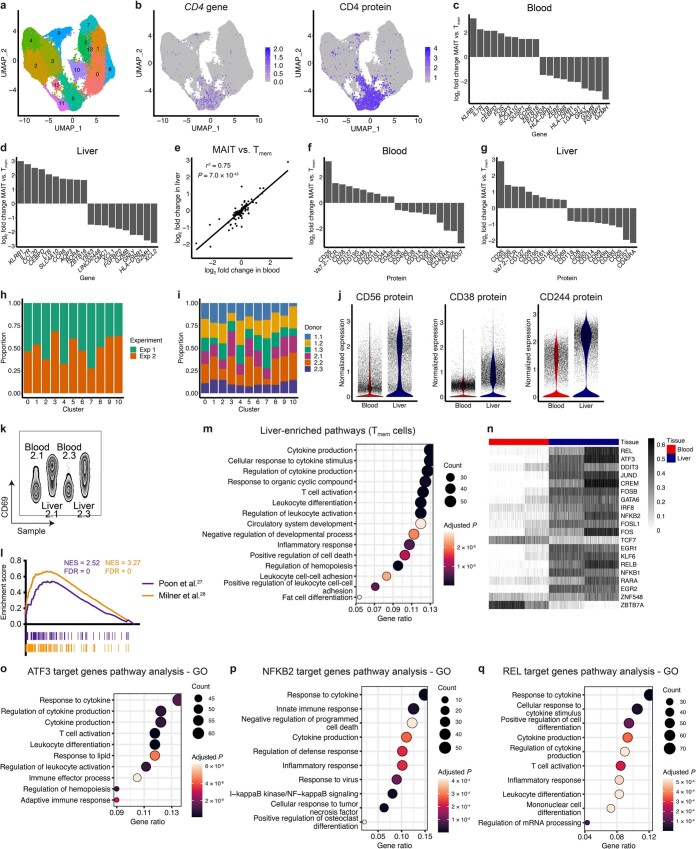
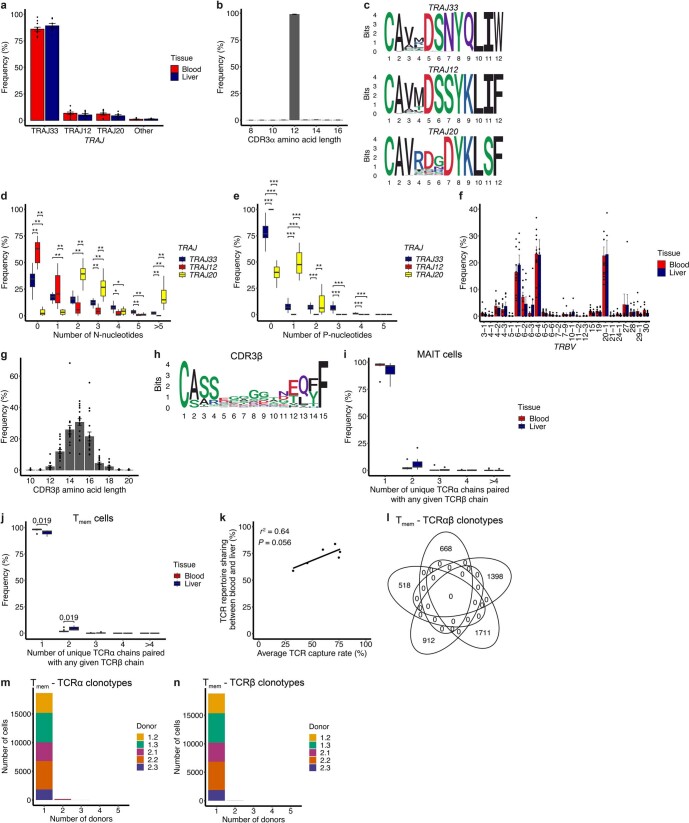
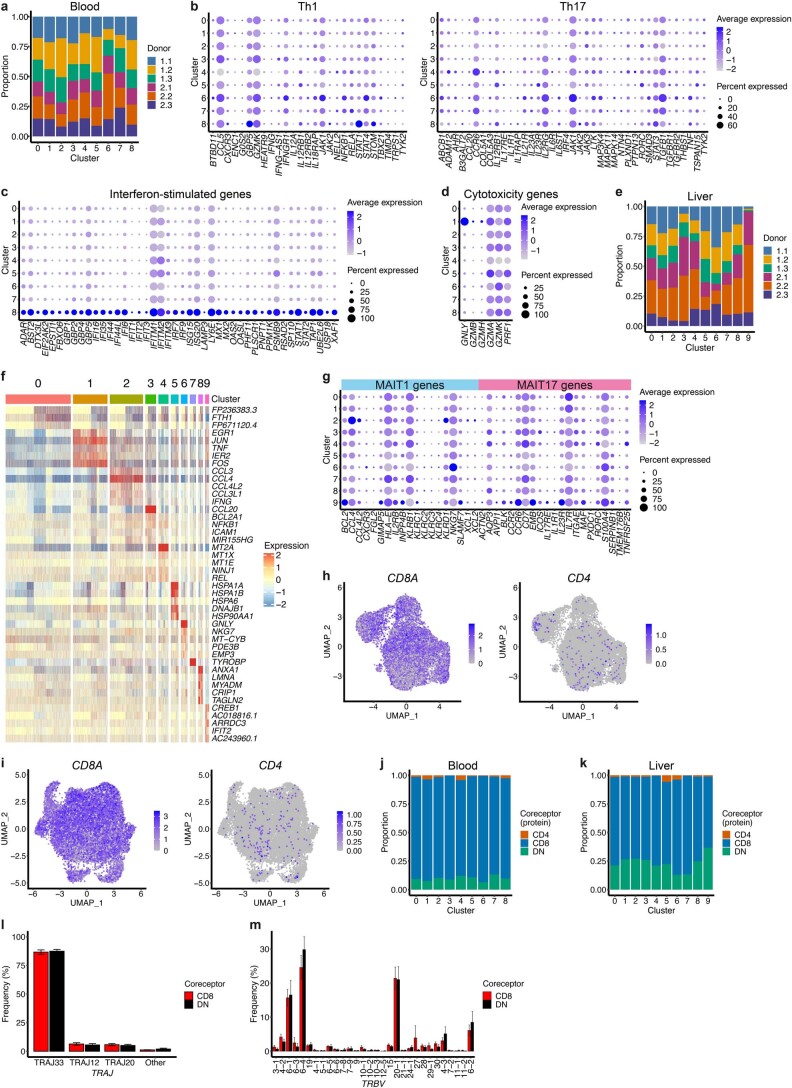
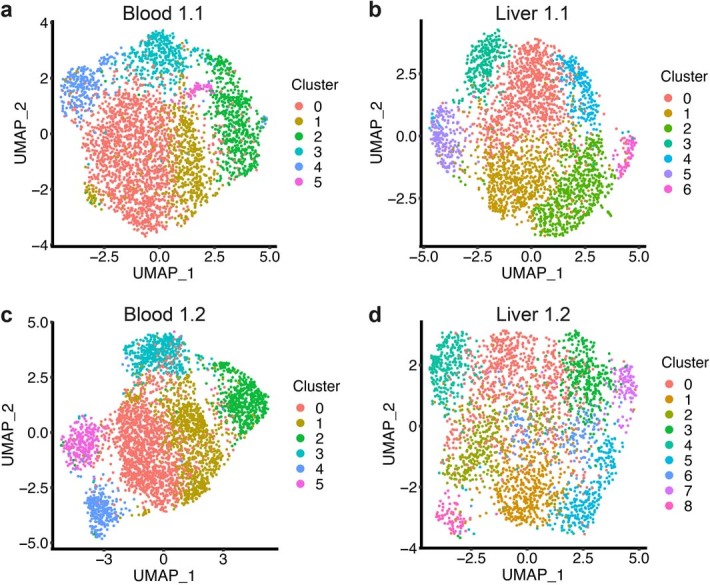
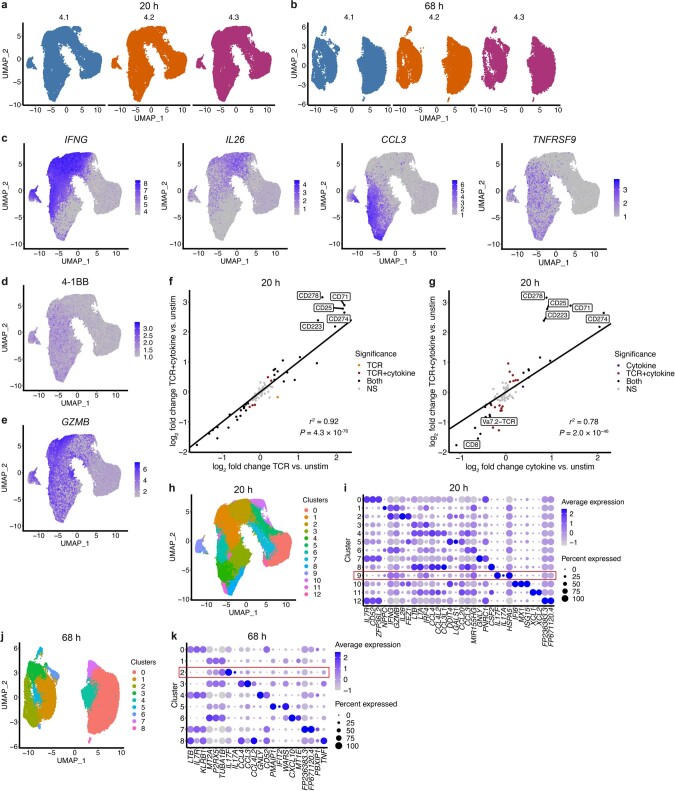
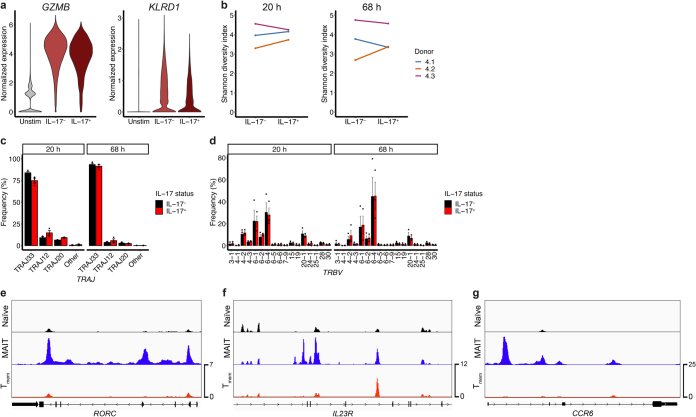
Mucosal-associated invariant T (MAIT) cells are innate-like T cells that recognize microbial metabolites through a semi-invariant T cell receptor (TCR). Major questions remain regarding the extent of human MAIT cell functional and clonal diversity. To address these, we analyzed the single-cell transcriptome and TCR repertoire of blood and liver MAIT cells and developed functional RNA-sequencing, a method to integrate function and TCR clonotype at single-cell resolution. MAIT cell clonal diversity was comparable to conventional memory T cells, with private TCR repertoires shared across matched tissues. Baseline functional diversity was low and largely related to tissue site. MAIT cells showed stimulus-specific transcriptional responses in vitro, with cells positioned along gradients of activation. Clonal identity influenced resting and activated transcriptional profiles but intriguingly was not associated with the capacity to produce IL-17. Overall, MAIT cells show phenotypic and functional diversity according to tissue localization, stimulation environment and clonotype.


Conflict of interest statement

P.K. has acted as a consultant to UCB, Biomunex, AstraZeneca and Infinitopes. N.M.P. has acted as a consultant to Infinitopes. The other authors declare no competing interests.

Figures

Fig. 1
Fig. 1. Liver MAIT cells exhibit an activated, tissue-resident transcriptional and regulatory profile.
a, UMAP of blood and liver MAIT cells and conventional memory T (Tmem) cells colored by cell type. n = 89,456 cells from 12 donors. b, UMAP split by sample type, namely blood from healthy donors (nonmatched), blood from liver donors (matched) and liver. c, Pearson’s correlation between the log2 fold change in gene expression between MAIT and Tmem cells in the blood, and MAIT and Tmem cells in the liver. d,e, UMAP of matched blood and liver MAIT cells (n = 35,407 cells from six donors) colored by the 11 identified clusters (d) or by tissue (e). f, Proportion of cells in each cluster from the blood and liver. gi, UMAPs colored by expression of CD69 (g) and CCL3 (h) genes or CD69 protein (i). j, Gene set enrichment analysis of liver compared with blood MAIT cells using published human and mouse tissue-resident memory T cell gene signatures. NES, normalized enrichment score. k, Over-representation analysis on the genes significantly upregulated in liver MAIT cells compared with blood MAIT cells. Top 15 gene ontology terms and associated Benjamini–Hochberg adjusted P values are shown. l, Heatmap showing activity (row-scaled AUCell scores) of the 20 most differentially active regulons (largest difference in average AUCell score) between matched blood and liver MAIT cells in Exp 1. n = 3 donors.
Fig. 2
Fig. 2. MAIT cells have a restricted TCRα but diverse TCRβ chain, resulting in private TCRαβ repertoires.
a, Percentage of TRAJ33, TRAJ12 and TRAJ20 TCRα chains paired with TRBV6-1, TRBV6-4, TRBV20-1 or other TCRβ chains. Mean ± s.e.m. is shown. b, Line plot colored by sample demonstrating the clonality of the TCRαβ repertoire. c, Line plot comparing MAIT (blue) and Tmem (black) cell TCRαβ clonality. d, Shannon diversity index for TCRα clonotypes and TCRβ clonotypes for each donor. e,f, TCR chain pairing at the population level. Number of unique TCRβ chains paired with any given TCRα chain in blood and liver MAIT cells (e) or MAIT and Tmem cells (f; blood and liver cells combined). g, Percentage of MAIT and Tmem cells belonging to a TCRαβ clonotype shared between matched blood and liver. h, Pearson’s correlation between clonotype frequency in matched blood and liver. ik, Number of cells from each donor belonging to TCRαβ (i), TCRα (j) or TCRβ (k) functional clonotypes found in 1, 2, 3, 4, 5 or 6 (all) donors. Plots show TCR data for MAIT cells (or MAIT and Tmem cells in c, f and g) from all donors (af; n = 12) or matched blood-liver donors (gk; n = 6). In dg, boxes span the 25th–75th percentiles, the midline denotes the median and whiskers extend to ±1.5 × IQR. Points in e and f indicate outliers. Two-sided Wilcoxon signed-rank test (a and d) and two-sided Wilcoxon rank-sum test (eg) for all pairwise comparisons. Benjamini–Hochberg adjusted P values are shown (nonsignificant results omitted). Source data
Fig. 3
Fig. 3. MAIT cells within the blood and liver show minimal transcriptional heterogeneity.
a, UMAP of blood MAIT cells from matched blood-liver donors (n = 6) colored by the nine identified clusters. b, Heatmap showing row-scaled log-transformed normalized expression of the top five or all (if <5) marker genes for each blood MAIT cell cluster. c, Expression of MAIT1 and MAIT17 genes in blood MAIT cell clusters. Dot color indicates the level of gene expression and dot size indicates the percentage of cells expressing the gene. d, UMAPs of blood MAIT cells colored by expression of GNLY, GZMB and GZMH. e, UMAP of liver MAIT cells from matched blood-liver donors (n = 6) colored by the ten identified clusters. f, UMAP of liver MAIT cells colored by expression of GNLY. g, UMAPs of liver MAIT cells colored by expression of IFNG, TNF, CCL3, CCL4, HSPA1A and EGR1. h,i, Proportion of CD4+, CD8+ and DN cells in each blood (h) and liver (i) cluster. Coreceptor identity defined by the expression of CD4, CD8A and CD8B genes (Methods). j, Number of unique clonotypes in CD8+ and DN MAIT cells from each donor (n = 12; CD8+ cell number within each donor downsampled to match the number of DN cells). k, Shannon diversity index for TCRαβ clonotypes in CD8+ and DN MAIT cells from each donor (n = 12). Boxes span the 25th–75th percentiles, the midline denotes the median and whiskers extend to ±1.5 × IQR. Two-sided Wilcoxon signed-rank test in j and k (nonsignificant results omitted). Source data
Fig. 4
Fig. 4. TCRαβ clonotypes are variably associated with transcriptional clusters.
ac, UMAPs of blood MAIT cells from donor 1.1 showing in red cells from a single TCRαβ clonotype. Plots show clonotype 2 (a), clonotype 1 (b) and clonotype 3 (c). Clonotype 1 is the largest clonotype from a donor, clonotype 2 is the second largest and so on. d, Spearman’s rank correlation between clonotype size (rank) and the Bonferroni adjusted P value for association between clonotype and cluster (exact multinomial test, performed for clonotypes from all donors (n = 12) with ≥20 cells). e, UMAP of liver MAIT cells from donor 1.1 with cells from clonotype 2 indicated in red (the same clonotype as in a). f,g, UMAPs of blood MAIT cells from donor 1.2 with cells from clonotype 3 indicated in red (f) or expression of GNLY shown in blue (g). h,i, UMAPs of liver MAIT cells from donor 1.2 with cells from clonotype 3 indicated in red (h) or expression of GNLY shown in blue (i).
Fig. 5
Fig. 5. TCR- and cytokine-activated MAIT cells follow distinct linear trajectories.
a,b, UMAPs of MAIT cells from all donors colored by stimulation condition (a) or the nine identified clusters (b). n = 27,305 cells from three donors. c, Proportion of cells in each cluster from the three stimulation conditions. d, Heatmap showing row-scaled log-transformed normalized expression of the top five marker genes for each cluster. e, UMAPs colored by expression of IFNG, IL26, CCL4 and GZMB. f, UMAP of MAIT cells from all donors with the branching pseudotime trajectory identified using Slingshot shown in black. g, Spearman’s rank correlation between gene importance (log2 1/gene importance rank) on SCORPIUS TCR and cytokine trajectories. Labels indicate the most differentially important genes, ten with higher importance on the TCR trajectory and ten with higher importance on the cytokine trajectory. Colors indicate whether gene expression was upregulated (red), downregulated (blue) or mixed (purple; upregulated in TCR and downregulated in cytokine or vice versa) relative to unstimulated cells. h,i, Expression of IL26, CCL3 and TNFRSF9 along SCORPIUS TCR (h) and cytokine (i) trajectories.
Fig. 6
Fig. 6. Transcriptional regulation of TCR- and cytokine-stimulated MAIT cells exhibits shared and distinct properties.
a, Pearson’s correlation between the log2 fold change in regulon activity (AUCell scores) between TCR-stimulated and unstimulated MAIT cells, and cytokine-stimulated and unstimulated MAIT cells. Labels show the regulons with the largest difference in log2 fold change relative to unstimulated cells between the TCR and cytokine trajectory, ten with increased (red), ten with decreased (blue) and ten with mixed (purple; increased in TCR and decreased in cytokine or vice versa) activity following stimulation. b, Heatmap showing the activity (row-scaled average AUCell scores) of TCR-specific (orange), cytokine-specific (purple) and shared (maroon) upregulated regulons in each stimulation condition. cf, UMAPs colored by the activity of HIVEP3 (c), BATF (d), BCL6 (e) and HIF1A (f) regulons. g, Heatmap showing regulon activity (smoothed AUCell scores) over pseudotime on the SCORPIUS TCR trajectory for regulons upregulated upon TCR stimulation. Gray, unstimulated cells; orange, TCR-stimulated cells. h, Heatmap showing regulon activity (smoothed AUCell scores) over pseudotime on the SCORPIUS cytokine trajectory for regulons upregulated upon cytokine stimulation. Gray, unstimulated cells; purple, cytokine-stimulated cells. i, Regulation of select MAIT cell effector genes. Heatmap is colored by the percent occurrence of each gene within each transcription factor regulon. High-confidence regulons predicted to regulate at least one of the genes in >50% of pySCENIC runs are included. Red asterisks in gi indicate regulons mentioned in the text.
Fig. 7
Fig. 7. Clonal identity influences MAIT cell activation potential.
a,b, Box plots split by donor (n = 3) showing pseudotime values on SCORPIUS TCR (a) and cytokine (b) trajectories for MAIT cells expressing different TRBV gene segments. Kruskal–Wallis test P values for a are 8.5 × 10−21, 2.2 × 10−9 and 1.3 × 10−15, and for b are 0.045, 0.045 and 2.2 × 10−20 for donors 3.1, 3.2 and 3.3, respectively. c, Spearman’s rank correlation between average TRBV pseudotimes on SCORPIUS TCR and cytokine trajectories. d,e, Pseudotime values for cells from the largest ten clonotypes in each donor or all clonotypes containing ≥20 cells (n = 9, 10 and 10 clonotypes for donors 3.1, 3.2 and 3.3, respectively) on SCORPIUS TCR (d) and cytokine (e) trajectories. Kruskal–Wallis test was performed for all clonotypes containing ≥20 cells. f, Spearman’s rank correlation between average clonotype pseudotimes on SCORPIUS TCR and cytokine trajectories. gi, Pearson’s correlation between log10 clonotype frequency and pseudotime on SCORPIUS TCR and cytokine trajectories for donors 3.1 (g), 3.2 (h) and 3.3 (i). Plots show stimulated cells only (ai), TRBV gene segments with a frequency of >1% in any donor (ac) and clonotypes containing ≥20 cells (di). In a, b, d and e, boxes span the 25th–75th percentiles, the midline denotes the median and whiskers extend to ±1.5 × IQR. Source data
Fig. 8
Fig. 8. IL-17 and IL-17+ MAIT cells are functionally and clonally related.
a, UMAP of 20 h-stimulated MAIT cells colored by stimulation condition. n = 96,867 cells from three donors. b, UMAP of 68 h-stimulated MAIT cells colored by stimulation condition. n = 42,765 cells from three donors. c, Pearson’s correlation between the log2 fold change in gene expression between TCR-stimulated and unstimulated MAIT cells, and TCR+cytokine-stimulated and unstimulated MAIT cells (20 h stimulation). Labels highlight selected genes that were differentially regulated by the two stimuli. Point colors indicate whether the gene was significantly differentially expressed in response to TCR stimulation only (orange), TCR+cytokine stimulation only (maroon), both (black) or neither (NS; gray). d, Pearson’s correlation between the log2 fold change in gene expression between cytokine-stimulated and unstimulated MAIT cells, and TCR+cytokine-stimulated and unstimulated MAIT cells (20 h stimulation). Labels highlight selected genes that were differentially regulated by the two stimuli. Point colors indicate whether the gene was significantly differentially expressed in response to cytokine stimulation only (purple), TCR+cytokine stimulation only (maroon), both (black) or neither (NS; gray). e,f, UMAPs of 20 h-stimulated (e) and 68 h-stimulated (f) MAIT cells colored by expression of IL17F. g, Percentage of cells within the IL-17-expressing cluster following 20 h or 68 h stimulation. h,i, Pearson’s correlation between clonotype frequency in IL-17 (cells within all other clusters) and IL-17+ (cells within the IL-17+ cluster) TCR+cytokine-stimulated MAIT cells at 20 h (h) and 68 h (i). j, Number of unique clonotypes detected within the IL-17+ cluster following 20 h or 68 h stimulation. Cell numbers for each donor were downsampled to ensure equal numbers of TCR+cytokine-stimulated cells at the two timepoints. k, Number of unique clonotypes within IL-17 (cells within all other clusters) and IL-17+ (cells within the IL-17+ cluster) TCR+cytokine-stimulated MAIT cells following 20 h or 68 h stimulation. Cell numbers for each donor were downsampled to ensure equal numbers of IL-17 and IL-17+ cells at a given timepoint. ln, Representative ATAC-seq tracks showing IL17A (l), IL17F (m) and GZMB (n) gene loci in naïve T (black), MAIT (blue) and Tmem (red) cells. n = 3 donors in ak. Two-sided paired t-test was performed in g, j and k (nonsignificant results omitted). Source data
Extended Data Fig. 1
Extended Data Fig. 1. MAIT and Tmem cells, and blood and liver MAIT cells, exhibit distinct phenotypes and transcriptomes.
a, UMAP of blood and liver MAIT cells and conventional memory T (Tmem) cells colored by the 14 identified clusters. n = 89,456 cells from 12 donors (11 blood, 7 liver). b, UMAPs of blood and liver MAIT and Tmem cells colored by CD4 gene (left) and protein (right) expression. c,d, Bar plots showing the log2 fold change in expression of the top ten genes upregulated in MAIT cells compared with Tmem cells, and vice versa, in the blood (c) and liver (d). e, Pearson’s correlation between the log2 fold change in protein expression between MAIT and Tmem cells in the blood, and MAIT and Tmem cells in the liver. f,g, Bar plots showing the log2 fold change in expression of the top ten proteins upregulated in MAIT cells compared with Tmem cells, and vice versa, in the blood (f) and liver (g). h,i, Proportion of cells in each cluster (analysis of MAIT cells from six matched blood-liver donors) from Exp 1 and Exp 2 (h) and from each donor (i). j, Expression of CD56, CD38 and CD244 (2B4) proteins in blood and liver MAIT cells. k, Flow cytometry plot showing CD69 expression on blood and liver MAIT cells from two representative donors. l, Gene set enrichment analysis of liver compared with blood Tmem cells using published human and mouse tissue-resident memory T cell gene signatures. NES, normalized enrichment score. m, Over-representation analysis on the genes significantly upregulated in liver Tmem cells compared with blood Tmem cells. Top 15 gene ontology (GO) terms and associated Benjamini–Hochberg adjusted P values are shown. n, Heatmap showing activity (row-scaled AUCell scores) of the 20 most differentially active regulons (largest difference in average AUCell score) between matched blood and liver MAIT cells in Exp 2. n = 3 donors. o-q, Over-representation analysis on predicted ATF3 (o), NFKB2 (p) and REL (q) target genes. Top ten GO terms and associated Benjamini–Hochberg adjusted P values are shown.
Extended Data Fig. 2
Extended Data Fig. 2. MAIT cells have a restricted TCRα but diverse TCRβ chain, resulting in private TCRαβ repertoires.
a, Proportion of blood and liver cells expressing TRAJ33, TRAJ12, TRAJ20 and other TRAJ gene segments. b, Distribution of CDR3α amino acid lengths. c, Sequence logos generated from all TRAJ33, TRAJ12 or TRAJ20 CDR3α amino acid sequences of length 12 (n = 26,529, 1,852 and 1,451 sequences, respectively). d,e, Frequency of N-nucleotides (d) and P-nucleotides (e) in TRAJ33, TRAJ12 and TRAJ20 TCRs from 12 donors. f, Proportion of blood and liver MAIT cells expressing different TRBV gene segments. Plot includes TRBV gene segments with a frequency >1% in at least one sample. g, Distribution of CDR3β amino acid lengths. h, Sequence logo generated from all MAIT cell CDR3β amino acid sequences of length 15 (n = 9,300 sequences). i,j, TCR chain pairing at the population level. Number of unique TCRα chains paired with any given TCRβ chain in blood and liver MAIT (i; n = 11 blood, 7 liver samples) or Tmem (j; n = 10 blood, 5 liver samples) cells. k, Pearson’s correlation between the average TCR capture rate (percentage of cells with a paired TRAV1-2 TCR) for a donor (n = 6) and percentage MAIT cell TCR repertoire sharing between matched blood and liver. l, Venn diagram showing the number of TCRαβ clonotypes shared between the five Tmem cell donors. m,n, Number of Tmem cells from each donor belonging to TCRα clonotypes (m) or TCRβ clonotypes (n) found in 1, 2, 3, 4, or 5 (all) donors. a-c and f-i show data from n = 18 samples (11 blood, 7 liver), 12 donors. Data in a, b, f, g are presented as mean ± s.e.m. In d, e, i, j, boxes span the 25th–75th percentiles, the midline denotes the median and whiskers extend to ± 1.5 × IQR. Points in i and j indicate outliers. Two-sided Wilcoxon rank-sum test (a, f, i, j) and two-sided Wilcoxon signed-rank test (d, e) for all pairwise comparisons. Benjamini-Hochberg adjusted P values are shown (nonsignificant results omitted). *P < 0.05, **P < 0.01, ***P < 0.001. Source data
Extended Data Fig. 3
Extended Data Fig. 3. MAIT cells within the blood and liver show minimal transcriptional heterogeneity.
a, Proportion of cells in each blood MAIT cell cluster from each donor (n = 6). b-d, Expression of Th1 and Th17 (b), interferon-stimulated (c) and cytotoxicity (d) genes in blood MAIT cell clusters. Dot color indicates the level of gene expression and dot size indicates the percentage of cells expressing the gene. e, Proportion of cells in each liver MAIT cell cluster from each donor (n = 6). f, Heatmap showing row-scaled log-transformed normalized expression of the top five or all (if <5) marker genes for each liver MAIT cell cluster. g, Expression of MAIT1 and MAIT17 genes in liver MAIT cell clusters. Dot color indicates the level of gene expression and dot size indicates the percentage of cells expressing the gene. h,i, UMAPs of blood (h) and liver (i) MAIT cells colored by expression of CD8A (left) and CD4 (right). CD4+ cells positioned in front of CD4 cells to allow better visibility. j,k, Proportion of CD4+, CD8+ and DN cells in each blood (j) and liver (k) cluster. Coreceptor identity defined based on the expression of CD4 and CD8 proteins (Methods). l,m, Frequency of CD8+ and DN MAIT cells expressing the indicated TRAJ (l) and TRBV (m) genes. n = 12 donors. TRBV genes expressed in >1% of CD8+ or DN cells from any donor are included. Mean ± s.e.m. is shown. Two-sample Wilcoxon signed-rank test for all pairwise comparisons (nonsignificant results omitted). Source data
Extended Data Fig. 4
Extended Data Fig. 4. Clusters identified in individual blood or liver samples.
a-d, Individual sample UMAPs colored by the identified clusters—blood 1.1 (a), liver 1.1 (b), blood 1.2 (c), liver 1.2 (d).
Extended Data Fig. 5
Extended Data Fig. 5. Gene and protein expression by TCR- and cytokine-stimulated MAIT cells.
a, Proportion of cells from each donor (n = 3) in each cluster (unstimulated, TCR-stimulated and cytokine-stimulated MAIT cells combined). b, Expression of the top three marker genes per cluster. Dot color indicates the level of gene expression and dot size indicates the percentage of cells expressing the gene. c-f, UMAPs colored by expression of TNF (c), CSF2 (d), IL2RA (e) and GNLY (f). g, Expression of IFNG in cytokine-stimulated MAIT cells negative (n = 11,122 cells) and positive (n = 387 cells; log-transformed normalized expression >0) for the expression of NCAM1 (CD56). Boxes span the 25th–75th percentiles, the midline denotes the median and whiskers extend to ±1.5 × IQR. Points indicate outliers. Two-sample Wilcoxon rank-sum test. h, UMAP colored by expression of NCAM1 (CD56). i-l, Percentage of sorted CD56 and CD56+ MAIT cells expressing IFNγ (i), granzyme B (j), perforin (k) and CD94 (l) when left unstimulated or stimulated with IL-12 + IL-18 for 20 h (as measured by flow cytometry). n = 3 donors. Two-sided paired t-test between CD56- and CD56+ cells in both conditions (nonsignificant results omitted). m,n, CD56 gene (left) and protein (right) expression in blood (m) and liver (n) MAIT cells. Protein expression measured in Exp 2 only. Source data
Extended Data Fig. 6
Extended Data Fig. 6. MAIT cell activation trajectories and validation of stimulus-specific and shared activation markers and cytokines.
a,b, Multidimensional scaling plots of unstimulated and TCR-stimulated MAIT cells (a), or unstimulated and cytokine-stimulated MAIT cells (b). SCORPIUS TCR (a) and cytokine (b) trajectories are shown in black. n = 3 donors. c,e-h,j,k, Percentage of MAIT cells expressing IFNγ (c), CD40L (e), CCL4 (f), TNF (g), 4-1BB (h), CD25 (j) and granzyme B (k) when left unstimulated or stimulated with plate-bound MR1/5-OP-RU (TCR), IL-12 + IL-18 (cytokine) or both (TCR+cytokine) for 20 h. Protein expression was measured by flow cytometry on all MAIT cells from 11 donors in two independent experiments (c, f, g, k) or CD4 MAIT cells from 14 donors in three independent experiments (e, h, j). Boxes span the 25th–75th percentiles, the midline denotes the median and whiskers extend to ±1.5 × IQR. Two-sample Wilcoxon signed-rank test. Benjamini-Hochberg adjusted P values are shown (nonsignificant results omitted). **P < 0.01, ***P < 0.001. d, UMAP of unstimulated, TCR-stimulated and cytokine-stimulated MAIT cells colored by expression of CD40LG. i, Violin plot showing expression of IL2RA by unstimulated, TCR-stimulated and cytokine-stimulated MAIT cells. Source data
Extended Data Fig. 7
Extended Data Fig. 7. Transcriptional regulation of TCR- and cytokine-stimulated MAIT cells exhibits shared and distinct properties.
a,b, Violin plots showing the activity (AUCell scores) of selected TCR-specific (a) and cytokine-specific (b) transcription factor regulons in unstimulated, TCR-stimulated and cytokine-stimulated MAIT cells. n = 3 donors. Differential activity analysis was performed for all pairwise comparisons using MAST. Bonferroni adjusted P values are shown (nonsignificant results omitted). ****P < 0.0001. c, Over-representation analysis on predicted T-bet (TBX21) target genes. Significant Reactome pathways and associated Benjamini-Hochberg adjusted P values are shown.
Extended Data Fig. 8
Extended Data Fig. 8. Influence of TCR usage on MAIT cell activation potential.
a,b, Spearman’s rank correlation between average TRBV pseudotimes on SCORPIUS and Slingshot (two trajectory analysis methods) TCR (a) and cytokine (b) trajectories. Pseudotime values scaled between 0 and 100. c,d, Spearman’s rank correlation between average TRBV pseudotimes for pairs of donors on SCORPIUS TCR (c) and cytokine (d) trajectories. e,f, Spearman’s rank correlation between average clonotype pseudotimes on SCORPIUS and Slingshot TCR (e) and cytokine (f) trajectories. Pseudotime values scaled between 0 and 100. Plots show stimulated cells only, TRBV gene segments with a frequency >1% in any donor (a-d) and clonotypes containing ≥20 cells (e, f).
Extended Data Fig. 9
Extended Data Fig. 9. TCR-, cytokine- and TCR+cytokine-stimulated MAIT cells.
a,b, UMAPs of 20 h- (a) and 68 h- (b) stimulated MAIT cells split and colored by donor. c, UMAPs of 20 h-stimulated MAIT cells colored by expression of IFNG, IL26, CCL3 and TNFRSF9. d, UMAP of 20 h-stimulated MAIT cells colored by expression of 4-1BB protein. e, UMAP of 20 h-stimulated MAIT cells colored by expression of GZMB. f, Pearson’s correlation between the log2 fold change in protein expression between TCR-stimulated and unstimulated MAIT cells, and TCR+cytokine-stimulated and unstimulated MAIT cells. Labels highlight selected genes that were differentially regulated by the two stimuli. Point colors indicate whether the protein was significantly differentially expressed in response to TCR stimulation only (orange), TCR+cytokine stimulation only (maroon), both (black) or neither (NS; gray). g, Pearson’s correlation between the log2 fold change in protein expression between cytokine-stimulated and unstimulated MAIT cells, and TCR+cytokine-stimulated and unstimulated MAIT cells. Labels highlight selected genes that were differentially regulated by the two stimuli. Point colors indicate whether the protein was significantly differentially expressed in response to cytokine stimulation only (purple), TCR+cytokine stimulation only (maroon), both (black) or neither (NS; gray). h, UMAP of 20 h-stimulated MAIT cells colored by the 13 identified clusters. i, Dot plot showing the top three marker genes per cluster in h. Red box indicates the IL-17-expressing cluster. Dot color indicates the level of gene expression and dot size indicates the percentage of cells expressing the gene. j, UMAP of 68 h-stimulated MAIT cells colored by the nine identified clusters. k, Dot plot showing the top three marker genes per cluster in j. Red box indicates the IL-17-expressing cluster. Dot color indicates the level of gene expression and dot size indicates the percentage of cells expressing the gene.
Extended Data Fig. 10
Extended Data Fig. 10. IL-17-expressing MAIT cells and type 17 gene loci.
a, Violin plots showing GZMB (left) and KLRD1 (CD94; right) expression by unstimulated MAIT cells, and IL-17 and IL-17+ TCR+cytokine-stimulated MAIT cells at 20 h. b, Shannon diversity index for TCRαβ clonotypes in IL-17 and IL-17+ MAIT cells from the TCR+cytokine stimulation condition at 20 h (left) and 68 h (right). Cell numbers for each donor were downsampled to ensure equal numbers of IL-17 and IL-17+ cells at a given timepoint. c,d, Percentage of IL-17 and IL-17+ TCR+cytokine-stimulated MAIT cells expressing different TRAJ (c) and TRBV (d) gene segments. n = 3 donors. TRBV genes expressed in >1% of IL-17 or IL-17+ cells from any donor are included. Mean ± s.e.m. is shown. Two-sample Wilcoxon signed-rank test for all pairwise comparisons (nonsignificant results omitted). e-g, Representative ATAC-seq tracks showing RORC (e), IL23R (f) and CCR6 (g) gene loci in naïve T (black), MAIT (blue) and Tmem (red) cells. Source data

References

    1. Garner LC, Klenerman P, Provine NM. Insights into mucosal-associated invariant T cell biology from studies of invariant natural killer T cells. Front. Immunol. 2018;9:1478. doi: 10.3389/fimmu.2018.01478. - DOI - PMC - PubMed
    1. Ussher JE, et al. CD161++CD8+ T cells, including the MAIT cell subset, are specifically activated by IL-12+IL-18 in a TCR-independent manner. Eur. J. Immunol. 2014;44:195–203. doi: 10.1002/eji.201343509. - DOI - PMC - PubMed
    1. Godfrey DI, Koay HF, McCluskey J, Gherardin NA. The biology and functional importance of MAIT cells. Nat. Immunol. 2019;20:1110–1128. doi: 10.1038/s41590-019-0444-8. - DOI - PubMed
    1. Kurioka A, et al. Shared and distinct phenotypes and functions of human CD161++ Vα7.2+ T cell subsets. Front. Immunol. 2017;8:1031. doi: 10.3389/fimmu.2017.01031. - DOI - PMC - PubMed
    1. Dias J, et al. The CD4−CD8− MAIT cell subpopulation is a functionally distinct subset developmentally related to the main CD8+ MAIT cell pool. Proc. Natl Acad. Sci. USA. 2018;115:E11513–E11522. doi: 10.1073/pnas.1812273115. - DOI - PMC - PubMed

Publication types

MeSH terms

Substances