. 2023 Sep;26(9):1613-1629.
doi: 10.1038/s41593-023-01404-6. Epub 2023 Aug 14.

Regional, circuit and network heterogeneity of brain abnormalities in psychiatric disorders

Affiliations

Regional, circuit and network heterogeneity of brain abnormalities in psychiatric disorders

Ashlea Segal et al. Nat Neurosci. 2023 Sep.

Abstract

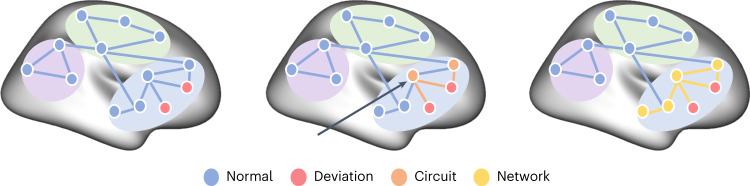
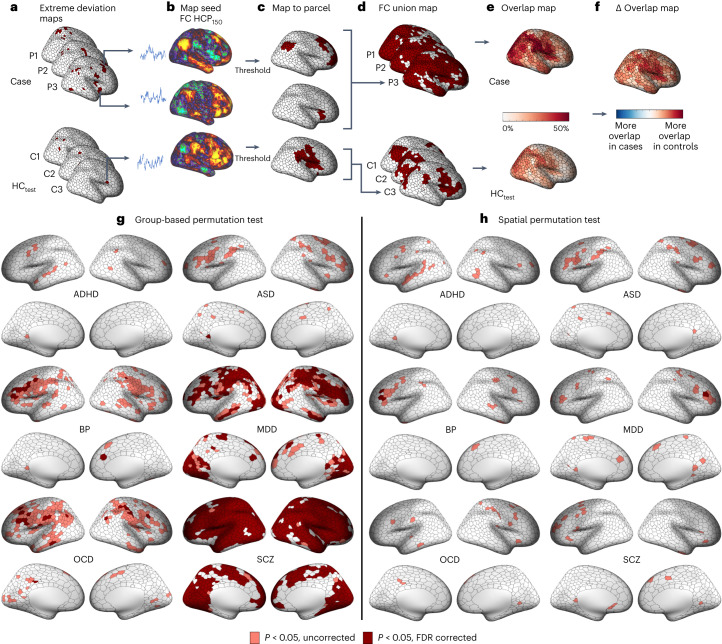
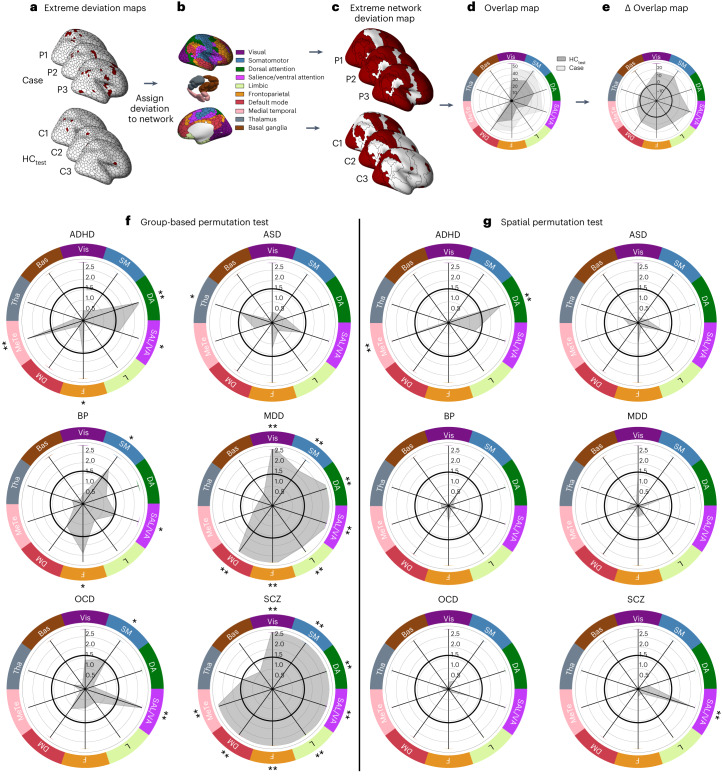
The substantial individual heterogeneity that characterizes people with mental illness is often ignored by classical case-control research, which relies on group mean comparisons. Here we present a comprehensive, multiscale characterization of the heterogeneity of gray matter volume (GMV) differences in 1,294 cases diagnosed with one of six conditions (attention-deficit/hyperactivity disorder, autism spectrum disorder, bipolar disorder, depression, obsessive-compulsive disorder and schizophrenia) and 1,465 matched controls. Normative models indicated that person-specific deviations from population expectations for regional GMV were highly heterogeneous, affecting the same area in <7% of people with the same diagnosis. However, these deviations were embedded within common functional circuits and networks in up to 56% of cases. The salience-ventral attention system was implicated transdiagnostically, with other systems selectively involved in depression, bipolar disorder, schizophrenia and attention-deficit/hyperactivity disorder. Phenotypic differences between cases assigned the same diagnosis may thus arise from the heterogeneous localization of specific regional deviations, whereas phenotypic similarities may be attributable to the dysfunction of common functional circuits and networks.


Conflict of interest statement

K.A. is a scientific advisor to and shareholder in BrainKey Inc., a medical image analysis software company. B.F. has received educational speaking fees from Medice GmbH. C.F.B. is director and shareholder of SBGNeuro Ltd. O.A.A. is a consultant to HealthLytix and received speaker’s honorarium from Lundbeck and Sunovion. N.C. participed in advisory boards and received speaker’s honoraria from Angelini, Esteve, Janssen, Lundbeck, Novartis, Pfizer and Viatris. Furthermore, they have been awarded research grants from the Ministry of Health, Ministry of Science and Innovation (CIBERSAM), and the Strategic Plan for Research and Innovation in Health (PERIS) for the period 2016–2020, as well as from Recercaixa and Marato TV3. M.Y. has received philanthropic donations from the David Winston Turner Endowment Fund, Wilson Foundation, as well as payments in relation to court, expert witness and/or expert review reports. Finally, he has received funding to conduct sponsored Investigator-Initiated trials (including Incannex Healthcare Ltd). These funding sources had no role in the design, management, data analysis, presentation or interpretation and write-up of the data. M.Y. also sits on the Advisory Boards of Centre of The Urban Mental Health, University of Amsterdam; Enosis Therapeutics; and Monash Biomedical Imaging Centre. M.B. has received grant/research support from the NIH, Cooperative Research Centre, Simons Autism Foundation, Cancer Council of Victoria, Stanley Medical Research Foundation, Medical Benefits Fund, National Health and Medical Research Council, Medical Research Futures Fund, Beyond Blue, Rotary Health, A2 milk company, Meat and Livestock Board, Woolworths, Avant and the Harry Windsor Foundation; has been a speaker for Abbot, AstraZeneca, Janssen and Janssen, Lundbeck and Merck; and served as a consultant to Allergan, AstraZeneca, Bioadvantex, Bionomics, Collaborative Medicinal Development, Eisai, Janssen and Janssen, Lundbeck Merck, Pfizer and Servier—all unrelated to this work. M.B. has received grant/research support from National Health and Medical Research Council, Wellcome Trust, Medical Research Future Fund, Victorian Medical Research Acceleration Fund, Centre for Research Excellence CRE, Victorian Government Department of Jobs, Precincts and Regions and Victorian COVID-19 Research Fund. He received honoraria from Springer, Oxford University Press, Cambridge University Press, Allen and Unwin, Lundbeck, Controversias Barcelona, Servier, Medisquire, HealthEd, ANZJP, EPA, Janssen, Medplan, Milken Institute, RANZCP, Abbott India, ASCP, Headspace and Sandoz. The other authors report no conflicts of interest.

Figures

Fig. 1
Fig. 1. Characterizing neural heterogeneity at the level of brain regions, functional circuits and extended networks.
A schematic showing how neural heterogeneity can be characterized at different scales. Nodes represent different brain regions, edges represent functional coupling (FC) between nodes and colored areas correspond to different functional networks of the brain. At the regional level (left), deviations from normative model predictions are localized to specific brain regions in each individual. Red nodes show the locations of such deviations mapped in two different people. A circuit-level analysis (middle) reveals areas that are functionally coupled to the deviant loci. In this work, we define a functional circuit as the set of regions that show significant FC with a specific deviant region (orange). In this example, the two deviant areas are coupled to a common region (black arrow) despite being located in different areas themselves. These circuits can be embedded within extended networks (right) that include regions that may not be directly coupled to the deviant regions, but which nonetheless participate within the same functional system (yellow).
Fig. 2
Fig. 2. Regional heterogeneity of extreme negative GMV deviations in each disorder.
af, Workflow for characterizing regional-level heterogeneity. GMV maps for each individual were parcellated into 1,000 cortical and 32 subcortical regions (a). The training dataset, HCtrain, was used to train a normative model to make predictions about regional GMV values given an individual’s age, sex and scan site (b). The predictions for held-out controls (HCtest) and cases were then compared with empirical GMV estimates. Model predictions for one region, showing individuals in the training set (HCtrain; light blue) and the held-out control (HCtest; dark blue) and clinical groups (red). Solid and dashed lines indicate the 99th and 95th centiles, respectively (c). For each individual, deviations from model predictions were quantified as a deviation z map (d). This deviation map was then thresholded at z>2.6 to identify extreme deviations (e). For the HCtest and each clinical group, we quantified the proportion of individuals showing an extreme deviation in a given brain region, yielding an extreme deviation overlap map (f). We subtracted the HCtest overlap map from each clinical group’s overlap map to obtain an overlap difference map (Δ overlap map) for each clinical group and then evaluated the magnitude of this difference (for details, see Extended Data Fig. 3a–d) (g). Cortical and subcortical surface renderings showing regions with significantly greater overlap of extreme negative GMV deviations in cases compared with controls, as identified using group-based permutation tests (pink corresponds to Puncorrected<0.05, red corresponds to PFDR<0.05; two tailed, cases > controls) (h). Data used to generate this figure can be found in Supplementary Data 1 (Regional_neg_thr26).
Fig. 3
Fig. 3. Functional circuit heterogeneity of extreme negative GMV deviations in each disorder.
af, Workflow for characterizing circuit-level heterogeneity. For each participant in the HCtest and each clinical group, we took each brain region showing an extreme deviation (a). For each individual in an independent sample of controls (HC150), we extracted a representative time course from each deviant region and mapped the areas to which it is functionally coupled to using a seed-related FC analysis. Shown here are three participants in a clinical group (Case: P1, P2, P3) and three participants in the control group (HCtest: C1, C2, C3). Two FC maps for two different deviant loci identified in P3, and one FC map for one deviant loci identified in C3 are depicted (b). We thresholded and binarized each FC map associated with a given extreme deviation (c). Note, that no subcortical regions survived this thresholding procedure. We took the union of the thresholded maps across all deviant FC maps to obtain a single map of all areas showing direct FC with one or more deviant areas for a given individual (d). For the HCtest and each clinical group, we quantified the proportion of individuals showing significant FC in a given region, yielding an extreme deviation FC overlap map (e). We subtracted the HCtest FC overlap map from each clinical group’s FC overlap map to obtain an FC Δ overlap map for each clinical group. Group differences in circuit-level overlap were evaluated with respect to two empirical null models (for details, see Extended Data Fig. 3) (f). g,h, Cortical surface renderings of regions with significantly greater overlap in cases compared with controls in areas functionally coupled to extreme deviations identified using group-based (g) or spatial permutation tests (h) (pink corresponds to Puncorrected<0.05, red corresponds to PFDR<0.05, two tailed, cases > controls). Data used to generate this figure can be found in Supplementary Data 1 (Circuit_neg_parc50).
Fig. 4
Fig. 4. Functional network heterogeneity of extreme negative GMV deviations in each disorder.
ad, Workflow for characterizing network-level GMV heterogeneity. For each individual in the HCtest and each clinical group (a), we assigned each brain region showing an extreme deviation to one of seven canonical cortical functional networks or three subcortical nuclei (b), such that the entire network was considered deviant if it contained at least one region with an extreme deviation. The cortical surface renderings show the resulting network-level extreme deviation maps (c). We quantified the proportion of individuals in each group showing a deviation within each network and compared these proportions to the network overlap in HCtest (d). e, Group differences in network-level overlap were evaluated with respect to two empirical null models (for details, see Extended Data Fig. 3). f,g, The network-level −log10 P values associated with the difference in percent overlap for extreme negative GMV deviations between each clinical group and the HCtest cohort (gray) under group-based (f) or spatial permutation (g) testing, respectively. ** corresponds to PFDR<0.05, two tailed, cases > controls, * corresponds to Puncorrected<0.05, two tailed, cases > controls. The solid black line indicates −log10 P = 1.6 (P = 0.05, two tailed, uncorrected). VIS, visual; SM, somatomotor; DA, dorsal attention; SAL/VA, salience/ventral attention; L, limbic; F, frontoparietal; DM, default mode; MeTe, medial temporal; Tha, thalamus; Bas, basal ganglia). Data used to generate this figure can be found in Supplementary Data 1 (Network_neg_10network).
Extended Data Fig. 1
Extended Data Fig. 1. Distribution of person-specific positive (Z > 2.6; blue) and negative (Z < -2.6; red) deviation burden scores (that is, total number of extreme deviations) in each diagnostic group.
* Indicates clinical groups showing a statistically significant difference in extreme deviation burden compared to the HCtest group (Mann Whitney U-test, p < .05, two-tailed).
Extended Data Fig. 2
Extended Data Fig. 2. Spatial overlap of extreme negative GMV deviations (Z < - 2.6) in each group.
a) Cortical and subcortical surface renderings showing spatial of overlap in 1032 brain regions, and b) the distribution of overlap percentages observed across all regions. Data used to generate this figure can be found in Supplementary Data 1(Regional_neg_thr26).
Extended Data Fig. 3
Extended Data Fig. 3. Permutation tests for evaluating region-level, circuit-level, and network-level overlap.
We used two types of permutation test to evaluate different hypotheses. Group-based permutation tests were used to evaluate group differences in region-level, circuit-level, and network-level overlap, regardless of total deviation burden. These tests involved repeating each analysis 10,000 times after shuffling case and control labels. (a) At each iteration, we obtained a new grouping of person-specific deviation maps according to the shuffled group labels. At the regional level, we focused on extreme deviation maps (Fig. 2e); at the circuit-level, we focused on union FC maps (Fig. 3d); and at the network level we focused on extreme network deviation maps (Fig. 4c). (b) For each brain region, we computed an overlap map for the HCtest and each clinical group under shuffled group assignment (Overlap map). (c) We then subtracted the surrogate HCtest overlap map from the surrogate clinical group’s overlap map to obtain an overlap difference map (Overlap map). Steps (b) and (c) were repeated 10,000 times to derive an empirical distribution of overlap difference maps under the null hypothesis of random group assignment (d). For each brain region, we obtained p-values as the proportion of null values that exceeded the observed difference. The second type of permutation test we used was a spatial permutation test. (e) We used the unthresholded deviation maps of each person derived from the normative model to generate an ensemble of surrogate deviation maps for each individual in the test data (f). For cortical regions, the surrogate maps were generated using Hungarian spin tests,. For subcortical regions, we randomly shuffled deviation values across all subcortical areas (see Methods). (g) We then thresholded the null deviation maps (Z> |2.6|) to generate surrogate extreme deviation maps. To evaluate circuit-level group differences in overlap, (h) we obtained individual-specific surrogate FC union maps using the same procedure described in Fig. 3a-d. (i) For the HCtest group and each clinical group, we calculated surrogate within-group overlap maps. (j) We subtracted the HCtest surrogate FC overlap map from each clinical group’s surrogate FC overlap map to obtain a surrogate overlap difference map (Overlap map). Steps (f) – (j) were repeated 10,000 times to generate (k) a null distribution of circuit-level overlap difference maps for each disorder. To evaluate network-level group differences in overlap, (l) we obtained surrogate network-level extreme deviation maps using the same procedure described in Figure 5a-c. (m) For each clinical group and the control group, we quantified the proportion of individuals showing a surrogate deviation within each network (Overlap map). (n) We subtracted the HCtest surrogate network overlap map from each clinical group’s surrogate overlap (Overlap map). Steps (f) – (n) were repeated 10, 000 times to generate (o) a null distribution of overlap difference maps for each disorder. For all tests, statistically significance differences were identified using a threshold of pFDR < 0.05, two-tailed.
Extended Data Fig. 4
Extended Data Fig. 4. Spatial overlap of regions functionally coupled (vertex-wise threshold pFWE < 0.025), to extreme negative deviations (Z < - 2.6) across groups, using a parcel-mapping threshold of 50%).
a) Cortical surface renderings showing spatial overlap and b) the distribution of overlap percentages observed across all regions. Data used to generate this figure can be found in Supplementary Data 1(Circuit_neg_parc50).
Extended Data Fig. 5
Extended Data Fig. 5. Comparison of regional and circuit-level heterogeneity.
(a) Statistical maps showing regions where the case-control differences in overlap observed at the circuit level (that is, Fig. 3g) is significantly greater than the overlap difference observed at the regional level (for example, Fig. 2h), identified using the group-based permutation testing (pink corresponds to puncorrected<.05, red corresponds to pFDR<.05, two-tailed, regional < circuit level overlap). (b) shows results for the reverse contrast (that is, regional > circuit level overlap). Data used to generate this figure can be found in Supplementary Data 1(RegionalvCircuit).
Extended Data Fig. 6
Extended Data Fig. 6. Spatial overlap of extreme positive GMV deviations (Z > 2.6) in each group.
a) Cortical and subcortical surface renderings showing spatial of overlap in 1032 brain regions, and b) the distribution of overlap percentages observed across all regions. Data used to generate this figure can be found in Supplementary Data 1(Regional_pos_thr26).
Extended Data Fig. 7
Extended Data Fig. 7. Regional heterogeneity of extreme positive GMV deviations in each disorder.
Cortical and subcortical surface renderings showing regions with significantly greater overlap of extreme positive GMV deviations in cases compared to controls identified using group-based permutation tests (light blue corresponds to puncorrected<.05, dark blue corresponds to pFDR<.05, two-tailed, cases>controls). Data used to generate this figure can be found in Supplementary Data 1(Regional_pos_thr26).
Extended Data Fig. 8
Extended Data Fig. 8. Spatial overlap in regions functionally coupled (vertex-wise threshold pFWE < 0.025), to extreme positive deviations (Z > 2.6) across groups, using a parcel-mapping threshold of 50%).
a) Cortical surface renderings showing spatial overlap, and b) the distribution of overlap percentages observed across all regions. Data used to generate this figure can be found in Supplementary Data 1(Circuit_pos_parc50).
Extended Data Fig. 9
Extended Data Fig. 9. Regions showing greater overlap in areas functionally coupled to extreme positive GMV deviations in cases compared to controls.
Group differences in circuit-level overlap were evaluated with respect to two empirical null models (see Extended Data Fig 3 for details). (a) and (b) show cortical surface renderings of regions with significantly greater overlap in cases compared to controls in areas functionally coupled to extreme deviations identified using group-based or spatial permutation tests, respectively (light blue corresponds to puncorrected<.05, dark blue corresponds to pFDR<.05, two-tailed, cases<controls). Data used to generate this figure can be found in Supplementary Data 1 (Circuit_pos_parc50).
Extended Data Fig. 10
Extended Data Fig. 10. Functional networks showing greater overlap in extreme positive GMV deviations in cases compared to controls.
The network-level -log10 p-values associated with difference in percent overlap for extreme positive GMV deviations between each clinical group and the HCtest cohort. ** corresponds to pFDR < 0.05, two-tailed, cases>controls, * corresponds to puncorrected < 0.05, two-tailed, cases>controls. The solid black line indicates -log10 p = 1.6 (p=0.05, two-tailed, uncorrected). (a) and (b) identify networks showing significant differences under group-based or spatial permutation testing, respectively. Data used to generate this figure can be found in Supplementary Data 1(Network_pos_10network).

References

    1. Opel N, et al. Cross-disorder analysis of brain structural abnormalities in six major psychiatric disorders: a secondary analysis of mega- and meta-analytical findings from the ENIGMA Consortium. Biol. Psychiatry. 2020;88:678–686. - PubMed
    1. Hibar DP, et al. Cortical abnormalities in bipolar disorder: an MRI analysis of 6503 individuals from the ENIGMA Bipolar Disorder Working Group. Mol. Psychiatry. 2018;23:932–942. - PMC - PubMed
    1. Boedhoe PSW, et al. An empirical comparison of meta- and mega-analysis with data from the ENIGMA Obsessive-Compulsive Disorder Working Group. Front. Neuroinform. 2019;12:1–8. - PMC - PubMed
    1. Hoogman M, et al. Brain imaging of the cortex in ADHD: a coordinated analysis of large-scale clinical and population-based samples. Am. J. Psychiatry. 2019;176:531–542. - PMC - PubMed
    1. van Erp TGM, et al. Cortical brain abnormalities in 4474 individuals with schizophrenia and 5098 control subjects via the Enhancing Neuro Imaging Genetics Through Meta Analysis (ENIGMA) Consortium. Biol. Psychiatry. 2018;84:644–654. - PMC - PubMed

Publication types