Review
. 2023 Dec;34(4):509-519.
doi: 10.1007/s00335-023-10014-3. Epub 2023 Aug 15.

Mouse phenome database: curated data repository with interactive multi-population and multi-trait analyses

Affiliations
Review

Mouse phenome database: curated data repository with interactive multi-population and multi-trait analyses

Molly A Bogue et al. Mamm Genome. 2023 Dec.

Abstract

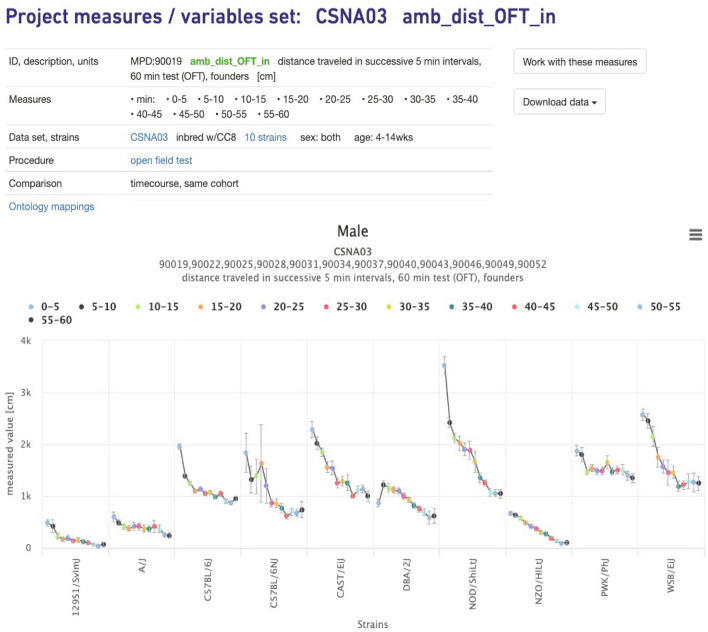
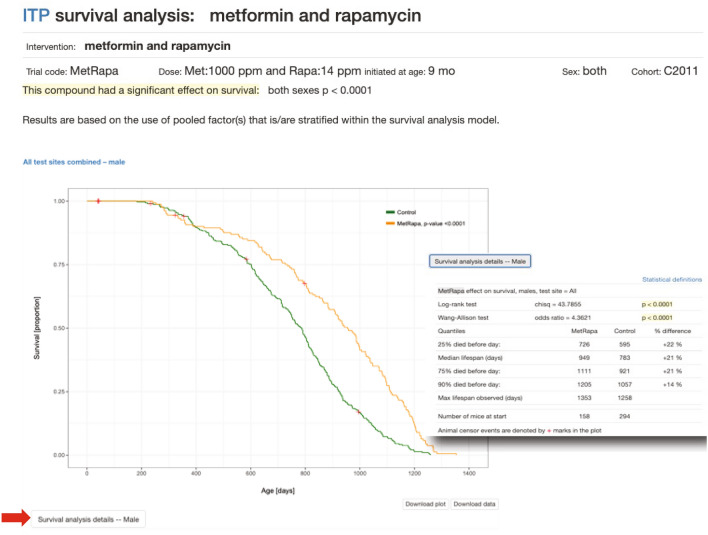
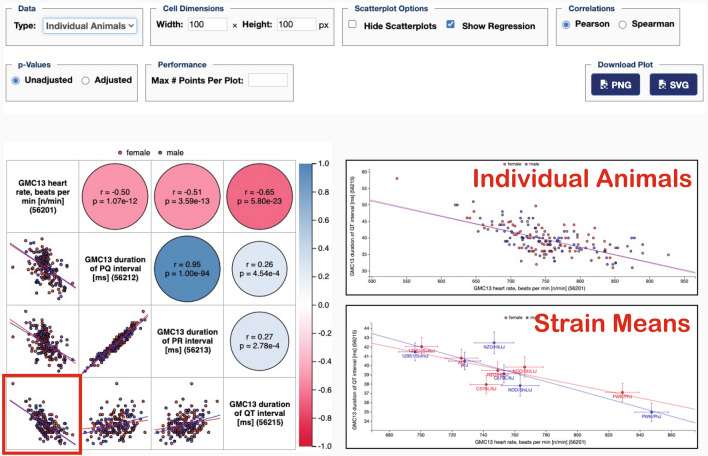
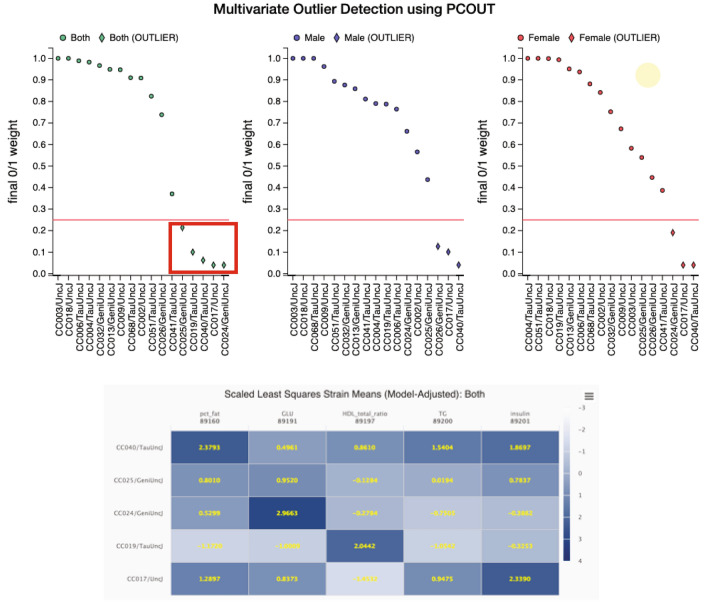
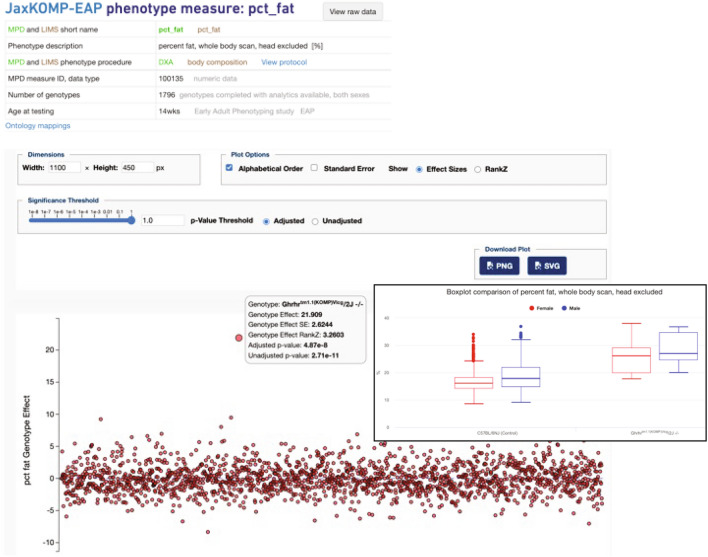
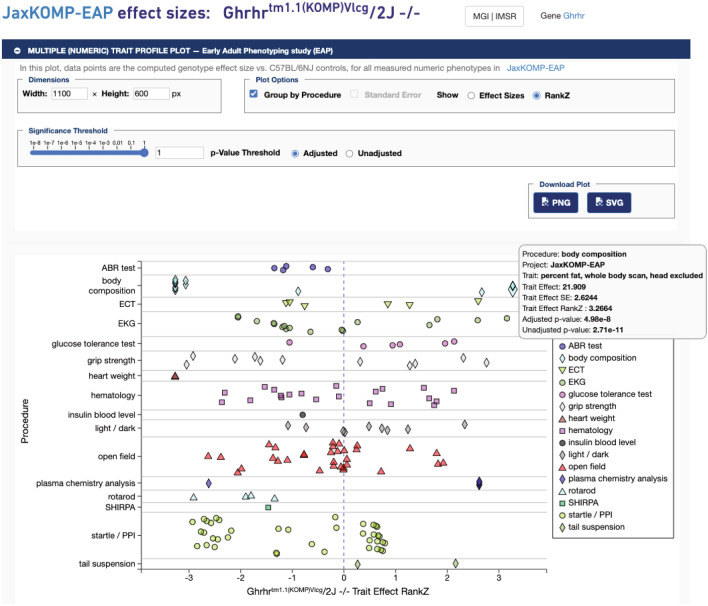
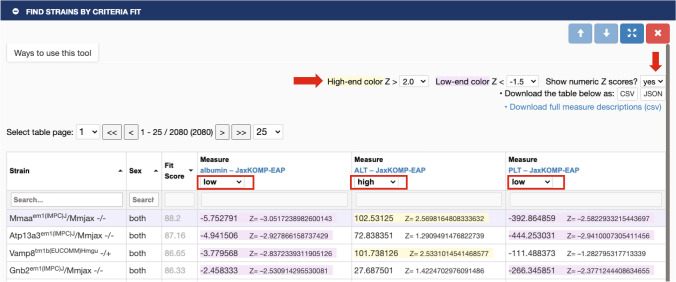
The Mouse Phenome Database continues to serve as a curated repository and analysis suite for measured attributes of members of diverse mouse populations. The repository includes annotation to community standard ontologies and guidelines, a database of allelic states for 657 mouse strains, a collection of protocols, and analysis tools for flexible, interactive, user directed analyses that increasingly integrates data across traits and populations. The database has grown from its initial focus on a standard set of inbred strains to include heterogeneous mouse populations such as the Diversity Outbred and mapping crosses and well as Collaborative Cross, Hybrid Mouse Diversity Panel, and recombinant inbred strains. Most recently the system has expanded to include data from the International Mouse Phenotyping Consortium. Collectively these data are accessible by API and provided with an interactive tool suite that enables users' persistent selection, storage, and operation on collections of measures. The tool suite allows basic analyses, advanced functions with dynamic visualization including multi-population meta-analysis, multivariate outlier detection, trait pattern matching, correlation analyses and other functions. The data resources and analysis suite provide users a flexible environment in which to explore the basis of phenotypic variation in health and disease across the lifespan.


Conflict of interest statement

The authors declare no competing interests.

Figures

Fig. 1
Fig. 1
Repeated measures plot. Time course for a single cohort of Collaborative Cross founder mice. Distance traveled in the Open Field in successive 5-min intervals. X-axis is strain, Y-axis is the measured value in centimeters. CSNA03 is the MPD project symbol (Center for Systems Neurogenetics of Addiction). Data can be found at: https://phenome.jax.org/measureset/90019
Fig. 2
Fig. 2
Kaplan–Meier plot of lifespan data. From the NIA supported multi-site Interventions Testing Program (ITP). The survival plot for metformin + rapamycin combined is shown for males (there is also a plot for females, not shown). Clicking on the button below the plot ‘Survival Analysis Details’ (red arrow) reveals statistical analysis data (shown in inset). Data can be found at: https://phenome.jax.org/itp/surv/MetRapa/C2011
Fig. 3
Fig. 3
Scatterplots and correlations tool. Applied to German Mouse Clinic data for Collaborative Cross founder strains for ECG data. Users may view Pearson or Spearman correlations (see control panel above plot on the right). Thumbnail scatterplots lie beneath the diagonal (red, female; blue, male), and above the diagonal are color-coded correlation coefficients (the more intense the color, the higher the absolute value of the correlation coefficient) with circle size corresponding to p-values (the lower the p-value, the larger the circle). The red square on the lower-left cell indicates that we have clicked on that cell. From there we can get enlarged scatterplots as shown in the right insets for individual animals and for strain means. Data can be found at: https://phenome.jax.org/measures/56201, https://phenome.jax.org/measures/56212, https://phenome.jax.org/measures/56213, https://phenome.jax.org/measures/56215
Fig. 4
Fig. 4
Multivariate outlier detection tool. Applied to a study of metabolic traits using the IMPC/KOMP phenotyping pipeline in Collaborative Cross strains. Strains below the red cut-off line are considered outliers. Selecting the outlier strains (click and drag resulting in the red box) in the first plot (both sexes) produces the heat map shown below of scaled least squares means to help users see at-a-glance phenotypic profiles for the selected strains. Data can be found at: https://phenome.jax.org/measures/89160, https://phenome.jax.org/measures/89191, https://phenome.jax.org/measures/89197, https://phenome.jax.org/measures/89200, https://phenome.jax.org/measures/89201
Fig. 5
Fig. 5
Genotype effect size plot for a particular phenotype in an IMPC engineered mutant strain. Each data point is a knockout strain. This is for the phenotype ‘percent fat, whole body scan’ for IMPC/JaxKOMP early adult pipeline data. Data were processed through the phenstat package with a soft window of temporally local controls and rank Z normalization to create a standard effect size for each strain and trait. P-value thresholds can be controlled through a slider as shown above the plot in the control panel. The default setting is p = 1 so that all data points are visible. Strain statistical values for the Ghrhr deletion mutant pop up by hovering over the data point. Clicking on that data point results in a box plot showing mutant versus control values (inset). Data can be found at: https://phenome.jax.org/komp/phenotypes/100135
Fig. 6
Fig. 6
Phenotype profile plot for a particular genotype. Clicking on the gene name Ghrhrtm1.1(KOMP)Vlcg/2 J -/- on the box plot page (shown in inset of Fig. 5) or in the project’s Genotype table opens this view. All phenotypes measured for this knock-out strain are shown by default. Users can adjust the p-value significance threshold in the control panel above the plot. The plot will automatically update only with measures meeting the new criteria in p-value threshold (not shown). Hovering over the data point ‘percent fat, whole body scan’ reveals statistical values in a popup (shown). Data can be found at: https://phenome.jax.org/komp/genotypes/1945902?study=JaxKOMP-EAP
Fig. 7
Fig. 7
Find Strains by Criteria Fit Tool. Users select their measures of interest and then select this tool. In this example, we have chosen albumin, alanine transaminase (ALT), and platelet count (PLT). Users then select the Z-score threshold (right red arrow) and their criteria for each measure. Here we have chosen low, high, low, respectively (boxed in red). The results table is shown. Users may then opt to see Z-scores displayed (down red arrow) which give an indication of how extreme the measures are. In this example only one strain out of over 2000 meets our criteria, the knockout for gene Mmaa. Data can be found at: https://phenome.jax.org/komp/phenotypes/100151, https://phenome.jax.org/komp/phenotypes/100169, https://phenome.jax.org/komp/phenotypes/100291

References

    1. Arslan A, Fang Z, Wang M, et al. Analysis of structural variation among inbred mouse strains. BMC Genom. 2023;24:97. doi: 10.1186/s12864-023-09197-5. - DOI - PMC - PubMed
    1. Ashbrook DG, Sasani T, Maksimov M et al (2022) Private and sub-family specific mutations of founder haplotypes in the BXD family reveal phenotypic consequences relevant to health and disease. 2022.04.21.489063
    1. Bandrowski AE, Martone ME. RRIDs: a simple step toward improving reproducibility through rigor and transparency of experimental methods. Neuron. 2016;90:434–436. doi: 10.1016/j.neuron.2016.04.030. - DOI - PMC - PubMed
    1. Basilico B, Ferrucci L, Ratano P, et al. Microglia control glutamatergic synapses in the adult mouse hippocampus. Glia. 2022;70:173–195. doi: 10.1002/glia.24101. - DOI - PMC - PubMed
    1. Bogue MA, Ball RL, Philip VM, et al. Mouse Phenome Database: towards a more FAIR-compliant and TRUST-worthy data repository and tool suite for phenotypes and genotypes. Nucleic Acids Res. 2023;51:D1067–D1074. doi: 10.1093/nar/gkac1007. - DOI - PMC - PubMed

LinkOut - more resources