. 2023 Oct 2;133(19):e169510.
doi: 10.1172/JCI169510.

Anticancer pan-ErbB inhibitors reduce inflammation and tissue injury and exert broad-spectrum antiviral effects

Affiliations

Anticancer pan-ErbB inhibitors reduce inflammation and tissue injury and exert broad-spectrum antiviral effects

Sirle Saul et al. J Clin Invest. .

Abstract

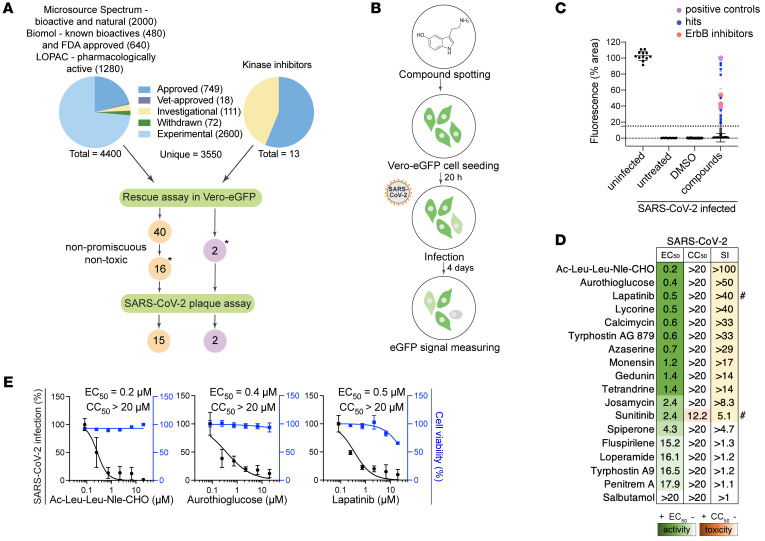
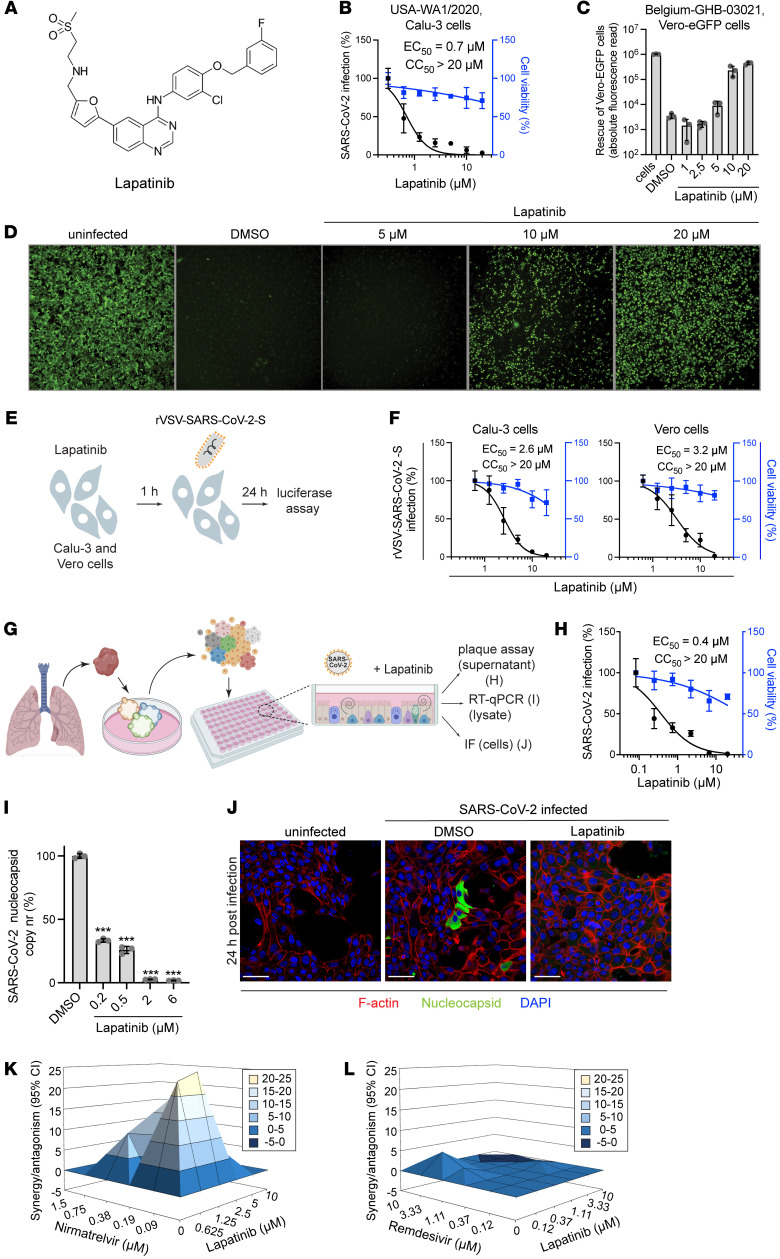
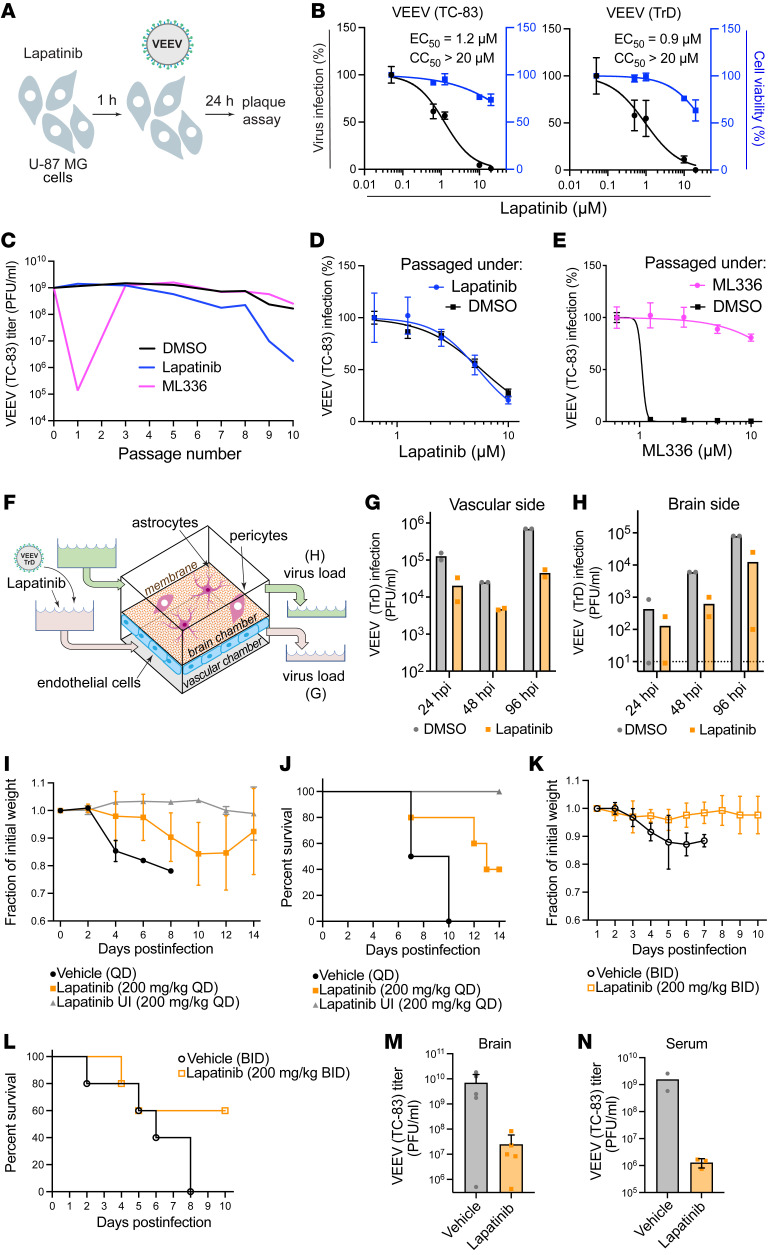
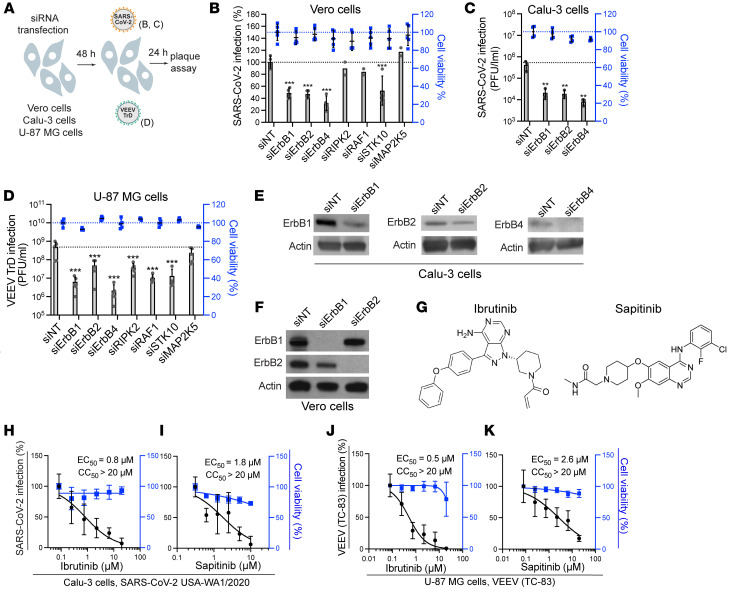
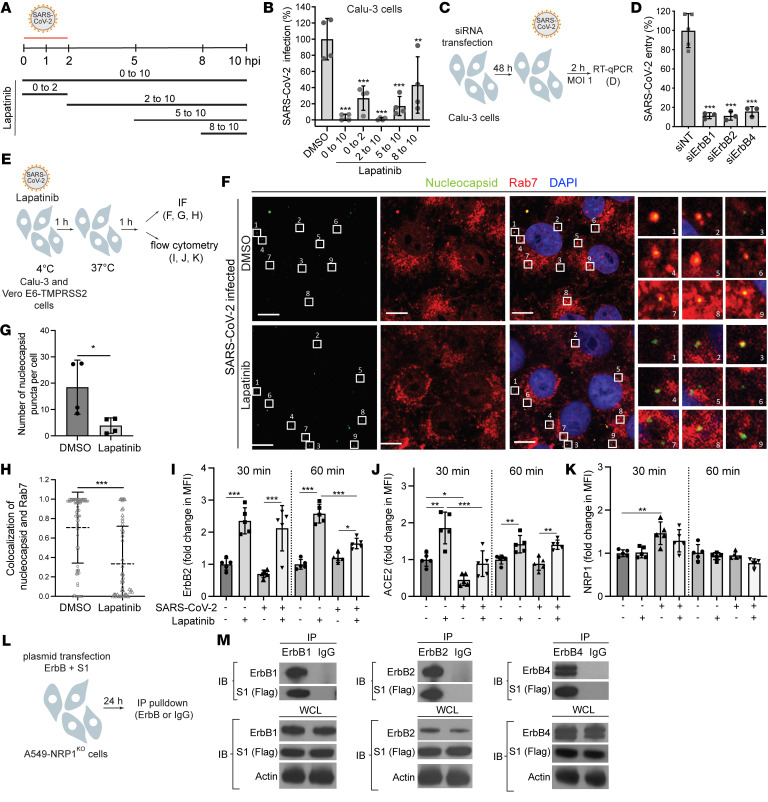
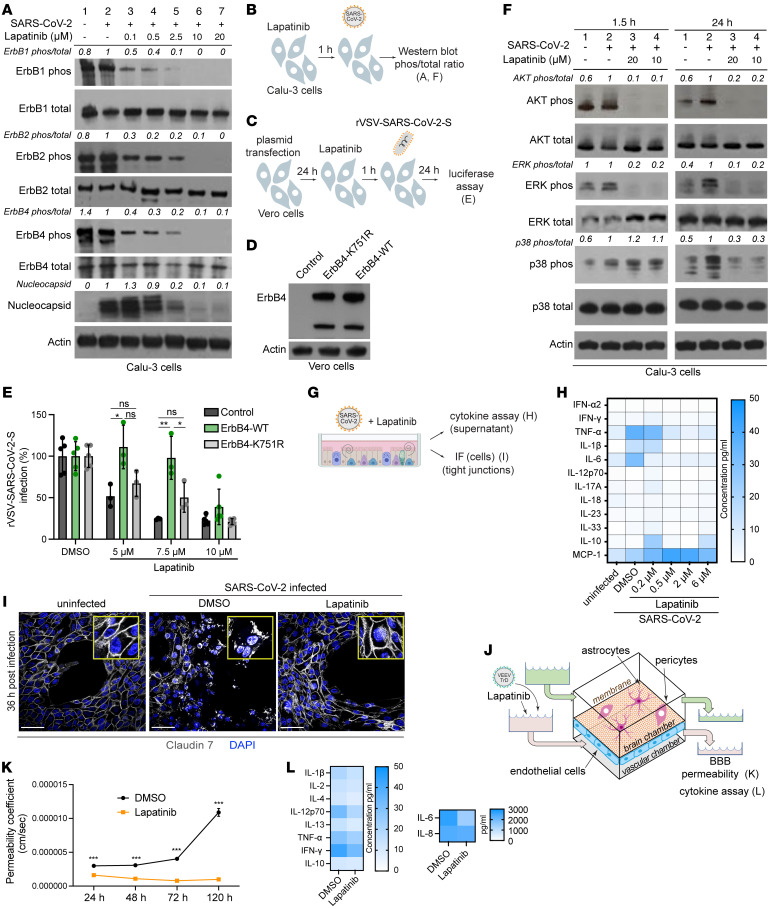
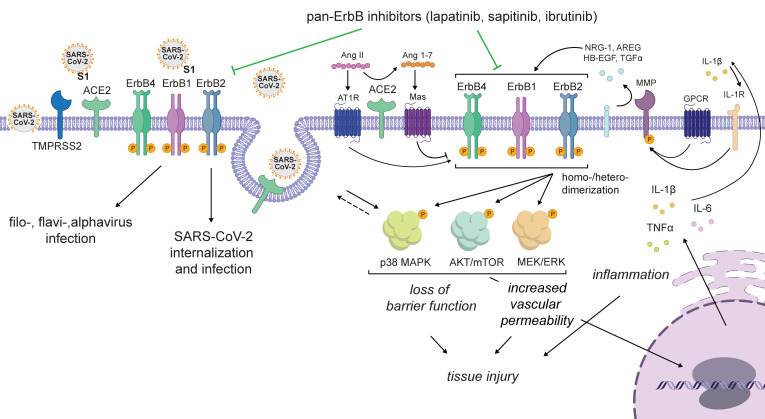
Targeting host factors exploited by multiple viruses could offer broad-spectrum solutions for pandemic preparedness. Seventeen candidates targeting diverse functions emerged in a screen of 4,413 compounds for SARS-CoV-2 inhibitors. We demonstrated that lapatinib and other approved inhibitors of the ErbB family of receptor tyrosine kinases suppress replication of SARS-CoV-2, Venezuelan equine encephalitis virus (VEEV), and other emerging viruses with a high barrier to resistance. Lapatinib suppressed SARS-CoV-2 entry and later stages of the viral life cycle and showed synergistic effect with the direct-acting antiviral nirmatrelvir. We discovered that ErbB1, ErbB2, and ErbB4 bind SARS-CoV-2 S1 protein and regulate viral and ACE2 internalization, and they are required for VEEV infection. In human lung organoids, lapatinib protected from SARS-CoV-2-induced activation of ErbB-regulated pathways implicated in non-infectious lung injury, proinflammatory cytokine production, and epithelial barrier injury. Lapatinib suppressed VEEV replication, cytokine production, and disruption of blood-brain barrier integrity in microfluidics-based human neurovascular units, and reduced mortality in a lethal infection murine model. We validated lapatinib-mediated inhibition of ErbB activity as an important mechanism of antiviral action. These findings reveal regulation of viral replication, inflammation, and tissue injury via ErbBs and establish a proof of principle for a repurposed, ErbB-targeted approach to combat emerging viruses.

Keywords: Drug screens; Protein kinases; Therapeutics; Virology.


Figures

Figure 1
Figure 1. High-throughput screening for compounds that counteract SARS-CoV-2–induced lethality and validation by plaque assays.
(A) Schematic of the composition of the screened libraries and screening and hit selection pipeline. LOPAC, Library of Pharmacologically Active Compounds (Sigma-Aldrich). (B) High-throughput screening (HTS) assay schematic. Compounds were pre-spotted in 384-well plates at a final concentration of 10 μM and incubated with Vero E6 cells constitutively expressing eGFP for 20 hours, followed by SARS-CoV-2 infection (Belgium-GHB-03021, MOI = 0.001). eGFP signal measured at 4 days after infection was used as an indicator for survival from virus-induced lethality. (C) Box plots of the percentage of fluorescence area values combining the entire HTS data set (2 independent experiments) split into the 4 indicated categories. The box horizontal lines indicate the first, second (median), and third quartiles. Outliers above a cutoff of 15% were defined as positive hits. Dots represent individual compounds, and colors denote positive controls (purple), new hits (blue), and ErbB inhibitors (peach). (D) Heatmap of the EC50 and CC50 values of hits emerging in the HTS, color-coded based on the antiviral activity measured by plaque assays (green) and toxicity measured by alamarBlue assays (orange), 24 hours after infection of Vero cells with SARS-CoV-2 (USA-WA1/2020 strain, MOI = 0.05). Selectivity indices (SI) greater than 5 are depicted in yellow. “#” indicates compounds from the 13-kinase set. (E) Dose-response curves of representative hits depicting SARS-CoV-2 infection (black) and cell viability (blue). Data are relative to DMSO. Data in E are combined from 2 independent experiments, each with 2–3 biological replicates. Means ± SD are shown. Asterisks in A denote 18 hits screened for SARS-CoV-2, VEEV (TC-83), and DENV2.
Figure 2
Figure 2. Lapatinib inhibits SARS-CoV-2 infection in vitro and ex vivo and is synergistic with nirmatrelvir.
(A) Chemical structure of lapatinib. (B) Dose response to lapatinib of SARS-CoV-2 infection (black, USA-WA1/2020 strain, MOI = 0.05) and cell viability (blue) in Calu-3 cells via plaque and alamarBlue assays at 24 hpi, respectively. (C and D) Dose-dependent graph (C) and corresponding fluorescence images (D) of Vero-eGFP cells rescued from SARS-CoV-2–induced lethality by lapatinib at 96 hpi (Belgium-GHB-03021 strain, MOI = 0.05). Original magnification, ×5. (E) Schematic of the experiment shown in F. (F) Dose response to lapatinib of rVSV-SARS-CoV-2-S infection (black) and cell viability (blue) in Calu-3 and Vero cells via luciferase and alamarBlue assays at 24 hpi. (G) Schematic of ALO model and experimental procedures. ALO-derived monolayers were infected with SARS-CoV-2 (USA-WA1/2020 strain, MOI = 1). (H) Dose response to lapatinib of SARS-CoV-2 infection (black) and cell viability (blue) in ALO-derived monolayer supernatants via plaque and alamarBlue assays at 48 hpi. (I) Dose response to lapatinib of SARS-CoV-2 nucleocapsid copy number in ALO-derived monolayer lysates measured by RT-qPCR assays at 48 hpi. (J) Confocal IF microscopy images of F-actin (red), SARS-CoV-2 nucleocapsid (green), and DAPI (blue) in naive and SARS-CoV-2–infected ALO-derived monolayers pretreated with DMSO or 10 μM lapatinib 24 hpi. Representative merged images at ×40 magnification are shown. Scale bars: 50 μm. (K and L) Synergy/antagonism of combination treatment with lapatinib and nirmatrelvir (K) or remdesivir (L) on antiviral effect measured in Calu-3 cells infected with rSARS-CoV-2/Nluc (USA-WA1/2020 strain, MOI = 0.05) at 24 hpi via Nluc assays. Data represent differential surface analysis at the 95% confidence interval (MacSynergy II program). Data are representative (C, H, I, K, and L) or a combination (B and F) of 2 independent experiments with 2–3 replicates each. Data in B, F, H, and I are relative to DMSO. Means ± SD are shown. ***P < 0.001 by 1-way ANOVA followed by Dunnett’s multiple-comparison test.
Figure 3
Figure 3. Lapatinib is a potent broad-spectrum antiviral with a high genetic barrier to resistance and is protective in human gNVU and murine models of VEEV.
(A) Schematic of the experiment shown in B. (B) Dose response to lapatinib of infection with vaccine (TC-83) and WT (TrD) VEEV strains (MOI = 0.1) in U-87 MG cells via plaque and alamarBlue assays at 24 hpi, respectively. (C) VEEV (TC-83) was used to infect U-87 MG cells (MOI = 0.1) and then passaged every 24 hours by inoculation of naive cells with equal volumes of supernatants under DMSO treatment or selection with lapatinib or ML336 increasing from 2.5 to 15 μM over 10 passages. Viral titers were measured by plaque assays. (D and E) Dose response to lapatinib (D) and ML336 (E) of VEEV (TC-83) harvested after 10 passages in the presence of lapatinib (D) and ML336 (E) via luciferase assays. (F) Schematic of gNVU. (G and H) Viral load in longitudinal samples collected from the vascular (G) and brain (H) sides of the gNVU after infection with VEEV (TrD) and treatment with lapatinib or DMSO. (IL) Weight loss (I and K) and mortality (J and L) of VEEV (TC-83)–infected C3H/HeN mice treated once (I and J) or twice (K and L) daily for 14 (I and J) or 10 (K and L) days with vehicle or lapatinib (200 mg/kg) (n = 2–5 per group). (M and N) Viral titers in brain (M) and serum (N) samples obtained upon euthanasia for morbidity or at the end of the experiment from mice treated twice daily (n = 2–5 per group). In N, day 8 (vehicle) and day 10 (lapatinib) titers were compared. Data in B, D, and E are relative to DMSO. Data are representative (C, D, E, G, and H) or a combination (B) of 2 independent experiments with 2–3 replicates each. See another independent experiment associated with G and H in Supplemental Figure 4E. Means ± SD are shown. QD, once daily; BID, twice daily; UI, uninfected.
Figure 4
Figure 4. ErbBs are essential for SARS-CoV-2 and VEEV infections.
(A) Schematic of the experiment shown in BD. (B) Percentage of infection by plaque assays (gray) and cell viability by alamarBlue assays (blue) in Vero cells transfected with the indicated siRNA pools measured at 24 hours after infection with WT SARS-CoV-2. (C and D) Viral titers (gray) and cell viability (blue) in Calu-3 (C) and U-87 MG (D) cells transfected with the indicated siRNA pools measured at 24 hours after infection with WT SARS-CoV-2 (C) or VEEV (TrD) (D). (E and F) Confirmation of siRNA-mediated gene expression knockdown in Calu-3 (E) and Vero (F) cells at 48 hours after transfection by Western blot. Notably, 2 anti-ErbB4 antibodies detected no signal of endogenous protein in Vero cells. (G) Chemical structures of ibrutinib and sapitinib. (HK) Dose response to ibrutinib (H and J) and sapitinib (I and K) of SARS-CoV-2 (black, USA-WA1/2020 strain, MOI = 0.05) (H and I) and VEEV (TC-83) (J and K) infection by plaque assays and cell viability (blue) by alamarBlue assays at 24 hours after infection of Calu-3 (H and I) or U-87 MG (J and K) cells. Data are representative (C) or a combination (B, D, and HK) of 2 independent experiments with 2–3 replicates each. Means ± SD are shown. Data are relative to DMSO (HK) or siNT (BD). **P = 0.003, ***P < 0.001 by 1-way ANOVA followed by Dunnett’s multiple-comparison test.
Figure 5
Figure 5. ErbBs bind the viral spike S1 subunit, and their inhibition suppresses SARS-CoV-2 and ACE2 internalization.
(A) Schematic of the time-of-addition experiment shown in B. (B) Calu-3 cells were infected with SARS-CoV-2 (MOI = 1). At the indicated times, 10 μM lapatinib or DMSO was added. Supernatants were collected at 10 hpi, and viral titers were measured by plaque assay. Values are shown relative to DMSO control. (C) Schematic of the experiment shown in D. (D) WT SARS-CoV-2 entry at 2 hpi in Calu-3 cells (MOI = 1) depleted of the indicated ErbBs measured by RT-qPCR. (E) Schematic of the experiments shown in FK. (FH) Quantitative IF analysis of SARS-CoV-2 internalization. Vero-TMPRSS2 cells were pretreated with lapatinib (10 μM) or DMSO and infected with SARS-CoV-2 (MOI = 1) at 4°C for 1 hour followed by temperature shift to 37°C. At 1 hpi, cells were fixed and labeled with nucleocapsid (green) and Rab7 (red) antibodies. The right panel shows the numbered areas magnified 6-fold. Scale bars: 10 μm. (G) Number of nucleocapsid puncta per cell after DMSO and lapatinib treatment. (H) Scatter plots of colocalization of nucleocapsid and Rab7 quantified by Manders’ coefficient. Dots represent individual viral particles; horizontal lines indicate means ± SD (DMSO: n = 71; lapatinib: n = 53). (IK) Flow cytometry data of cell surface expression levels of ErbB2 (I), ACE2 (J), and NRP1 (K) at 30 and 60 minutes after temperature shift to 37°C in uninfected and SARS-CoV-2–infected Calu-3 cells treated with lapatinib or DMSO. Fold change in MFI is relative to 30-minutes uninfected DMSO-treated cells. (L) Schematic of the experiment shown in M. (M) A549-NRP1KO cells were cotransfected with plasmids expressing S1-FLAG and ErbBs, followed by immunoprecipitation using anti-ErbB or IgG antibodies and protein G Dynabeads. Representative Western blots of eluates and whole-cell lysates (WCL) are shown. Data are representative (D, FH, and M) or a combination (B and IK) of 2 independent experiments with 2–5 replicates each. Means ± SD are shown (B, D, and GK). Data are relative to DMSO (B and GK) or siNT (D). *P ≤ 0.05, **P < 0.01, ***P < 0.001 by 1-way ANOVA followed by Dunnett’s (B and D) or Tukey’s (IK) multiple-comparison test or by unpaired, 2-tailed Student’s t test (G and H).
Figure 6
Figure 6. ErbBs are the molecular targets mediating the antiviral effect of lapatinib, and they regulate virus-induced inflammation and tissue injury.
(A and F) ErbB (A), AKT, ERK, and p38 MAPK (F) phosphorylation and nucleocapsid expression (A) in Calu-3 cells that were uninfected (lane 1), infected and DMSO-treated (lane 2), or infected and lapatinib-treated (lanes 3–7) measured via Western blotting at 1.5 (F) and 24 (A and F) hours after infection with SARS-CoV-2 (USA-WA1/2020 strain, MOI = 1). Shown are representative membranes blotted for phospho- and total proteins and quantitative phospho- to total protein ratio data relative to infected cells treated with DMSO (lane 2). (B) Schematic of the experiment shown in A and F. (C) Schematic of the experiments shown in D and E. (D) Level of ErbB4 and actin expression via Western blot after transfection of Vero cells with control or ErbB4-expressing plasmids. (E) Rescue of rVSV-SARS-CoV-2-S infection in the presence of lapatinib upon ectopic expression of the indicated plasmids measured by luciferase assays at 24 hpi in Vero cells. (G) Schematic of the experiments shown in H and I. (H) Cytokine concentration (pg/mL) in ALOs’ supernatants at 48 hours after infection with SARS-CoV-2 by LEGENDplex kit. (I) Confocal IF microscopy images of claudin-7 (gray) and DAPI (blue) in naive or SARS-CoV-2–infected ALOs treated with DMSO or lapatinib (10 μM) and imaged at 36 hpi. Representative merged images at ×40 magnification are shown. Scale bars: 50 μm. (J) Schematic of the experiments shown in K and L. (K) Permeability of the endothelial layer of gNVUs infected with VEEV (TrD) and treated with lapatinib (5 μM) or DMSO assessed by FITC-dextran quantification in samples collected from brain and vascular chambers. (L) Cytokine concentration (pg/mL) in the brain side of gNVUs treated with lapatinib (5 μM) or DMSO at 120 hours after infection with VEEV (TrD) by LEGENDplex kit. Data are a combination (E) or representative (A, D, F, H, I, K, and L) of 2 independent experiments each with 2–4 replicates. Means ± SD are shown (E and K). *P < 0.05, **P < 0.01, ***P < 0.001 relative to DMSO by 1-way ANOVA followed by Tukey’s multiple-comparison test at each lapatinib concentration (E) or unpaired, 2-tailed Student’s t test (K).
Figure 7
Figure 7. Proposed model for the roles of ErbBs in the regulation of viral infection and pathogenesis and the mechanism of action of pan-ErbB inhibitors.
ErbBs regulate SARS-CoV-2 internalization and other stages of the viral life cycle and are required for effective replication of other emerging RNA viruses. Moreover, pan-ErbB activation promotes signaling in pathways implicated in inflammation and tissue injury in severe pandemic coronaviral infections and other disease models. By inhibiting ErbBs, lapatinib and other pan-ErbB inhibitors not only suppress viral infection but also protect from the resulting inflammation and tissue injury.

Update of

References

    1. Wu Z, McGoogan JM. Characteristics of and important lessons from the Coronavirus Disease 2019 (COVID-19) outbreak in China: summary of a report of 72 314 cases from the Chinese center for disease control and prevention. JAMA. 2020;323(13):1239–1242. doi: 10.1001/jama.2020.2648. - DOI - PubMed
    1. Weaver SC, et al. Venezuelan equine encephalitis. Annu Rev Entomol. 2004;49:141–174. doi: 10.1146/annurev.ento.49.061802.123422. - DOI - PubMed
    1. Lum FM, et al. Monkeypox: disease epidemiology, host immunity and clinical interventions. Nat Rev Immunol. 2022;22(10):597–613. doi: 10.1038/s41577-022-00775-4. - DOI - PMC - PubMed
    1. Morse SA, Meyer RF. Viruses and bioterrorism. Refer Module Life Sci. 2017;B978-0-12-809633-8.11007-6.
    1. Bekerman E, Einav S. Infectious disease. Combating emerging viral threats. Science. 2015;348(6232):282–283. doi: 10.1126/science.aaa3778. - DOI - PMC - PubMed

Publication types