. 2023 Oct 2;133(19):e163402.
doi: 10.1172/JCI163402.

Rescue of alveolar wall liquid secretion blocks fatal lung injury due to influenza-staphylococcal coinfection

Affiliations

Rescue of alveolar wall liquid secretion blocks fatal lung injury due to influenza-staphylococcal coinfection

Stephanie Tang et al. J Clin Invest. .

Abstract

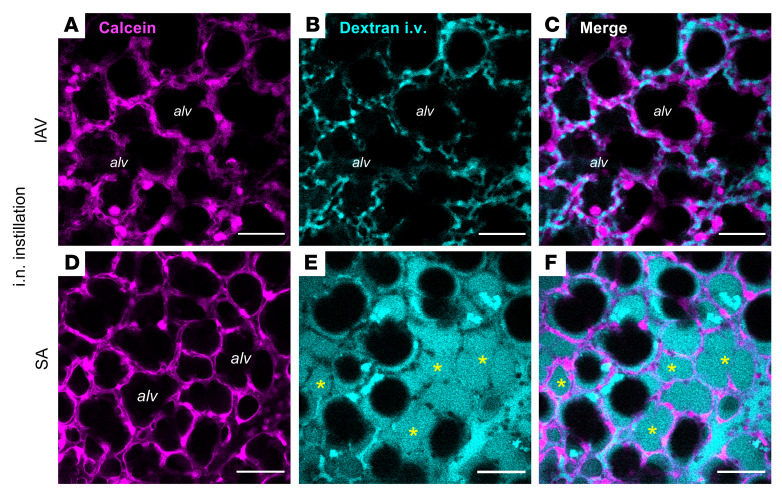
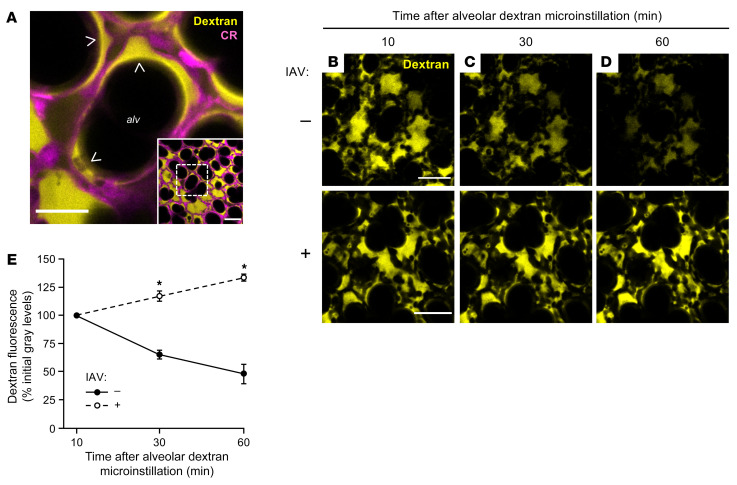
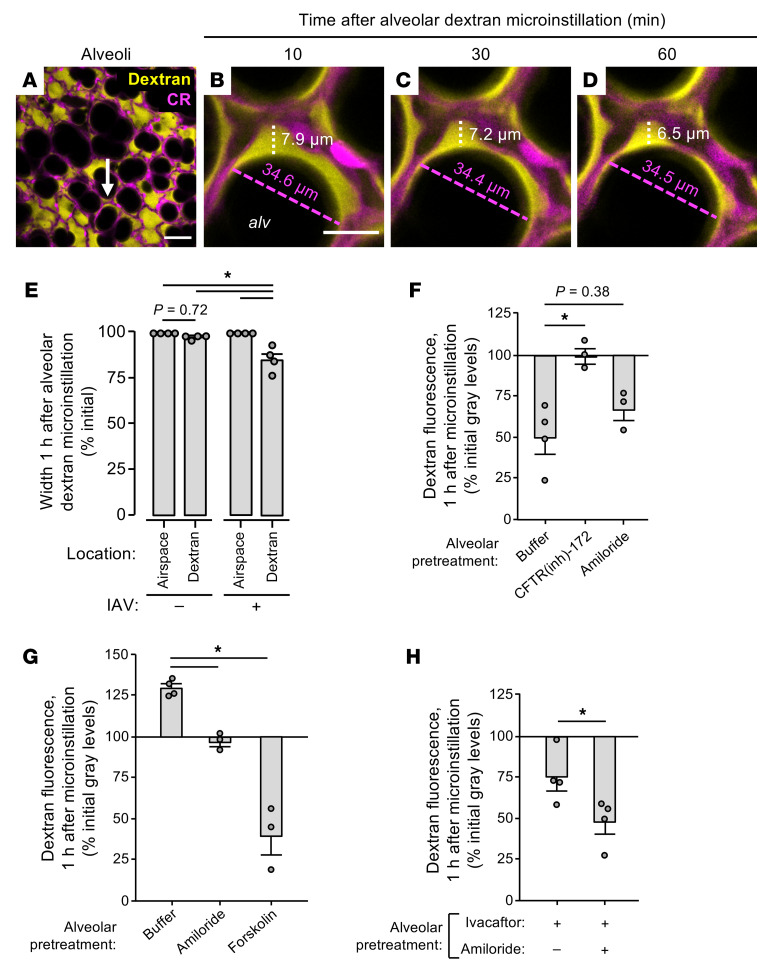
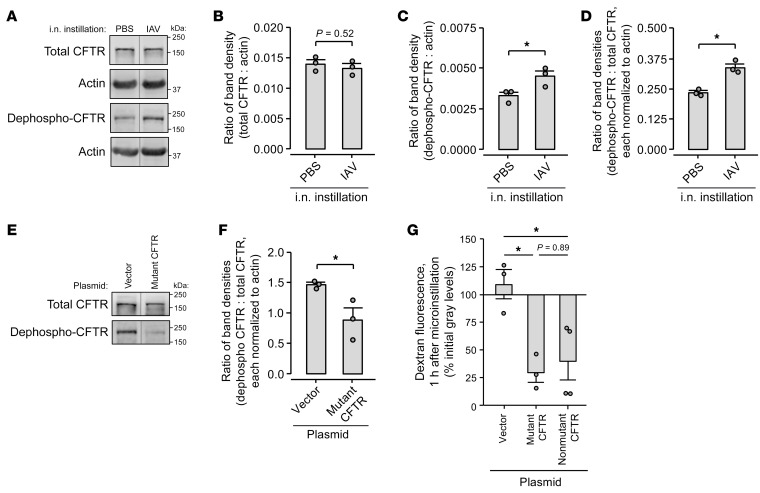
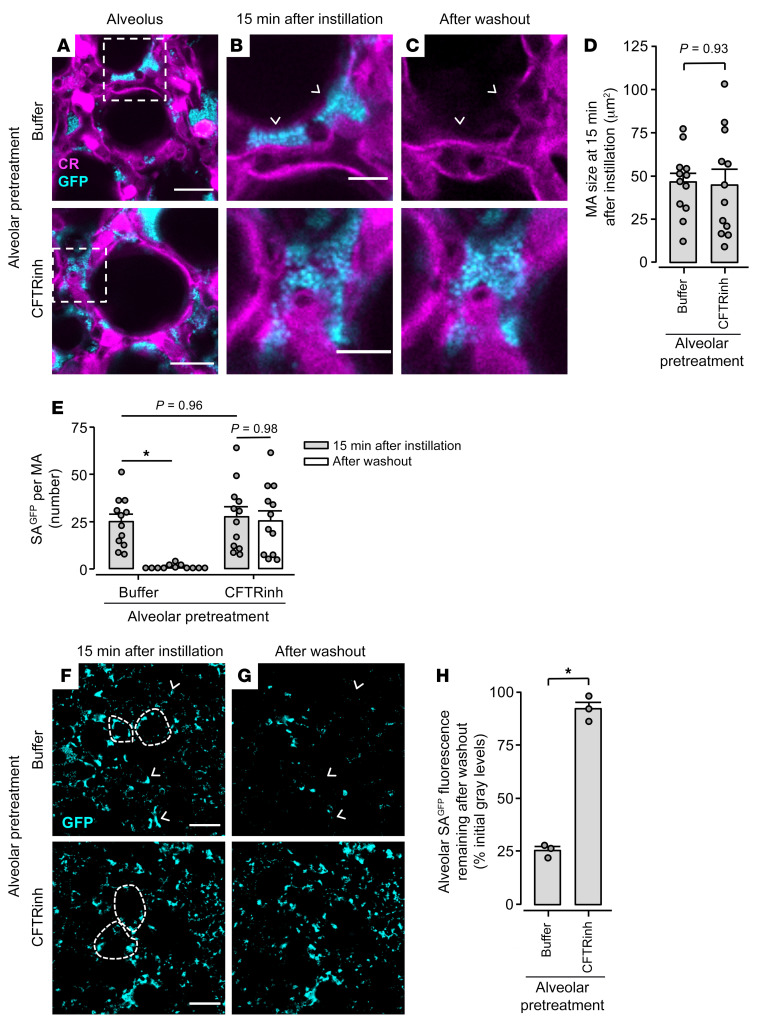
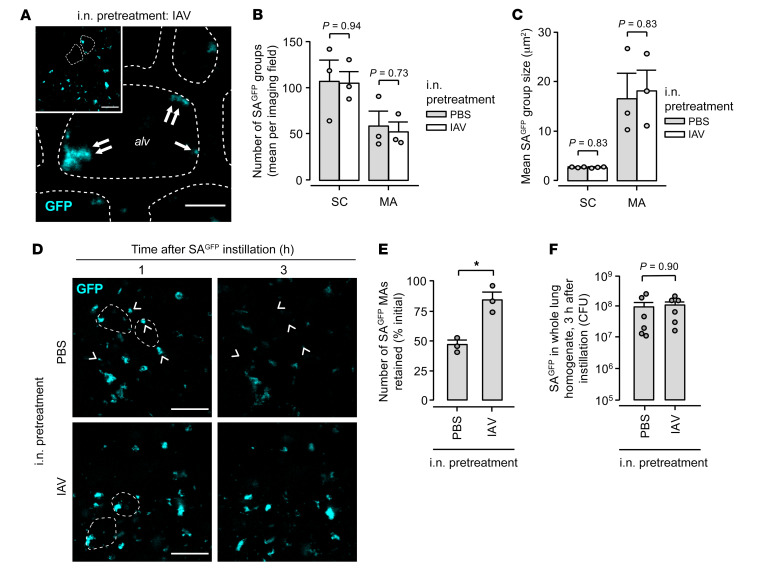
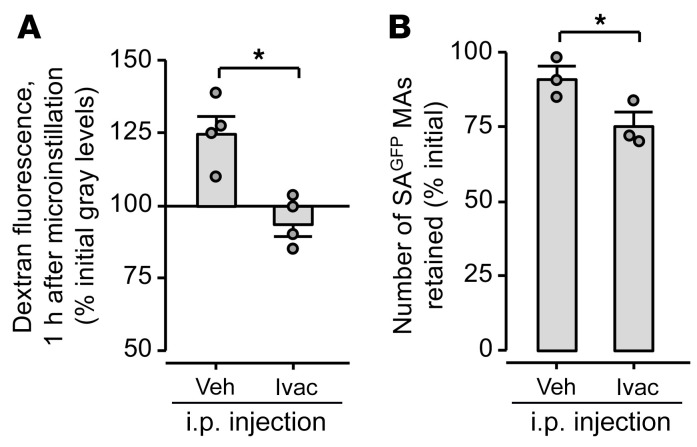
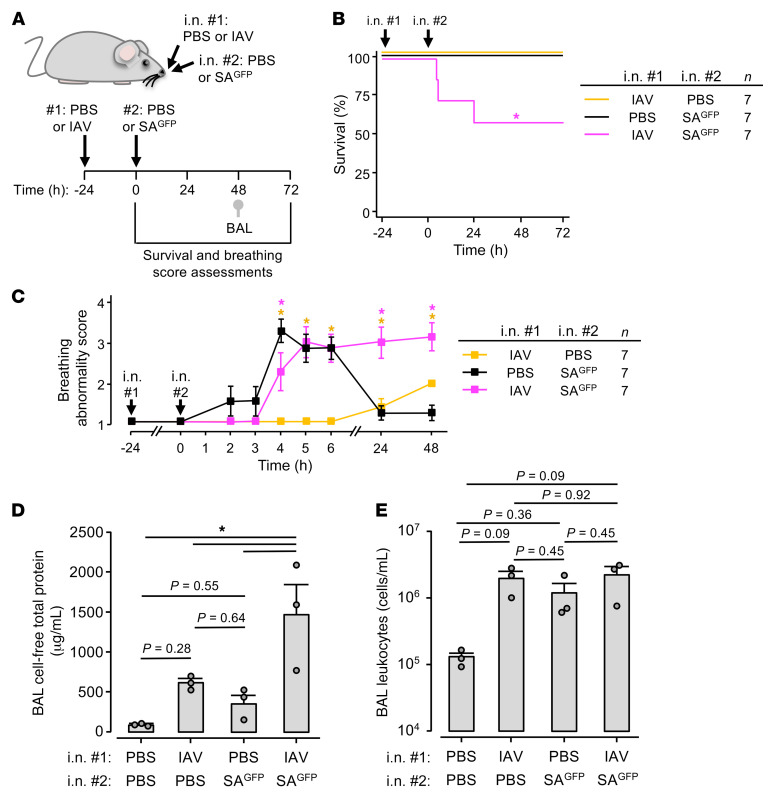
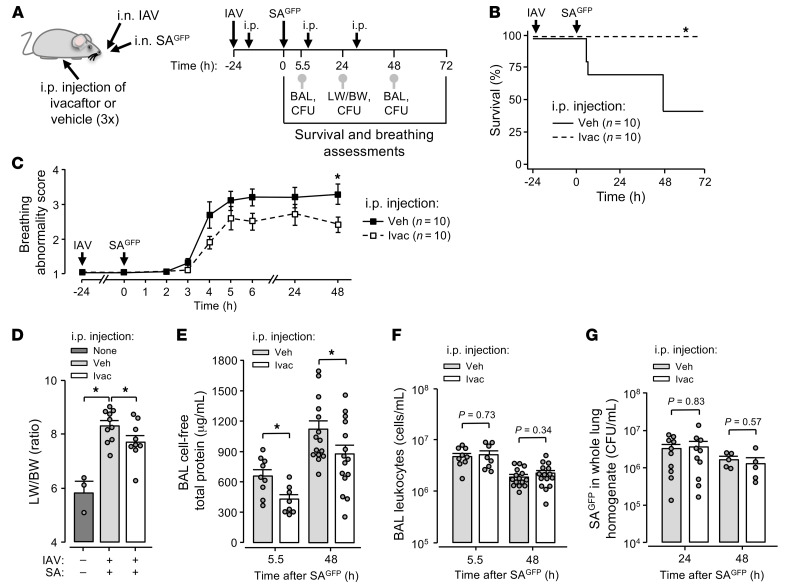
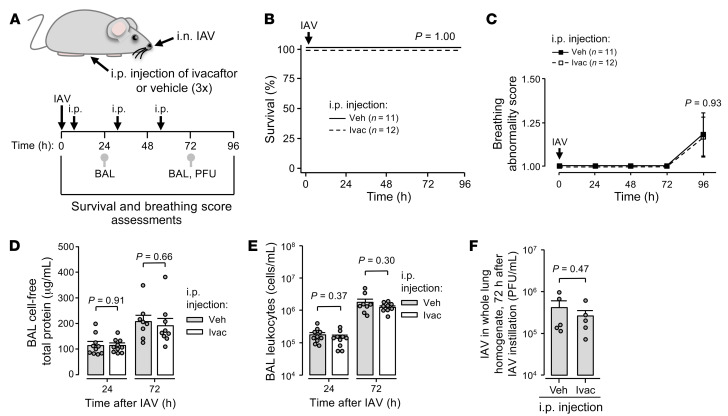
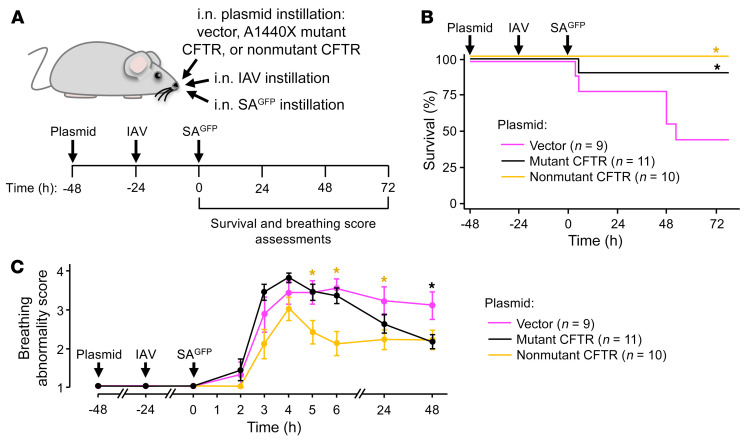
Secondary lung infection by inhaled Staphylococcus aureus (SA) is a common and lethal event for individuals infected with influenza A virus (IAV). How IAV disrupts host defense to promote SA infection in lung alveoli, where fatal lung injury occurs, is not known. We addressed this issue using real-time determinations of alveolar responses to IAV in live, intact, perfused lungs. Our findings show that IAV infection blocked defensive alveolar wall liquid (AWL) secretion and induced airspace liquid absorption, thereby reversing normal alveolar liquid dynamics and inhibiting alveolar clearance of inhaled SA. Loss of AWL secretion resulted from inhibition of the cystic fibrosis transmembrane conductance regulator (CFTR) ion channel in the alveolar epithelium, and airspace liquid absorption was caused by stimulation of the alveolar epithelial Na+ channel (ENaC). Loss of AWL secretion promoted alveolar stabilization of inhaled SA, but rescue of AWL secretion protected against alveolar SA stabilization and fatal SA-induced lung injury in IAV-infected mice. These findings reveal a central role for AWL secretion in alveolar defense against inhaled SA and identify AWL inhibition as a critical mechanism of IAV lung pathogenesis. AWL rescue may represent a new therapeutic approach for IAV-SA coinfection.

Keywords: Epithelial transport of ions and water; Influenza; Innate immunity; Pulmonology.


Figures

Figure 1
Figure 1. Alveolar epithelial viability and barrier function in live, intact, perfused lungs.
(AF) Confocal images show epithelial fluorescence of calcein (magenta) and intravascular (i.v.) fluorescence of tetramethylrhodamine-labeled dextran (20 kDa; 10 mg/mL; cyan) in live alveoli of intact, blood-perfused mouse lungs. Lungs were excised for imaging at 24 hours after intranasal (i.n.) IAV instillation (AC) or 4 hours after intranasal SA instillation (DF). Calcein-AM was microinstilled in alveoli by alveolar micropuncture, and dextran was added to the lung perfusate solution. Example dextran-filled airspaces are indicated by asterisks (E and F). Note that dextran fluorescence fills numerous alveolar airspaces (alv) in the SA-infected lung (E and F) but is absent from airspaces in the IAV-infected lung (B and C). Bacteria are not shown. Scale bars: 50 μm. Each set of images was replicated in lungs of 3 mice.
Figure 2
Figure 2. IAV lung infection disrupts AWL secretion in live alveoli.
(A) Low-power (inset) and high-power confocal images show fluorescence of tetramethylrhodamine-conjugated (TRITC-conjugated) dextran (70 kDa; 10 mg/mL; yellow) in live alveoli (magenta) at 10 minutes after alveolar dextran microinstillation. Note that dextran formed a thin layer against alveolar walls and pooled in structural alveolar niches (arrowheads). CR, calcein red-orange; alv, alveolar airspace. Scale bars: 50 (inset) and 20 μm. Images replicated in 40 mice. (BE) Confocal images (BD) and group data (E) show time-dependent change of alveolar dextran fluorescence in airspaces of live alveoli in lungs excised from mice that were untreated (BD), top row, and E, filled circles; n = 4 mice) or intranasally instilled with IAV at 24 hours before imaging (BD, bottom row, and E, open circles; n = 4 mice). Fluorescence of alveolar walls is not shown. Group data (E) represent mean ± SEM. For each mouse, mean dextran fluorescence was quantified at each of the 3 indicated time points in an imaging field containing at least 30 lung alveoli. *P < 0.05 vs. closed circles by 2-tailed t test. Scale bars: 50 μm.
Figure 3
Figure 3. IAV lung infection induces airspace liquid absorption in live alveoli.
(AE) Confocal images (AD) and group data (E) show time-dependent change of fluorescence of microinstilled TRITC-conjugated dextran (70 kDa; 10 mg/mL; yellow) in the live alveolus (magenta) shown in Figure 2A. Imaged lungs were excised from mice that were untreated (“–”; shown in E only) or intranasally instilled with IAV (“+”; AE) at 24 hours before excision. High-power confocal views (BD) of the structural alveolar niche (A, arrow) demonstrate, in IAV-infected lungs, time-dependent decrease of dextran pool width (white dashed lines and text) but not airspace width (magenta dashed lines and text). For group data (E), circles indicate n and each represent 1 mouse in which widths were quantified at 10 random locations in an imaging field containing at least 30 alveoli. Bars represent mean ± SEM; *P < 0.05 as indicated by ANOVA with post hoc Tukey testing. CR, calcein red-orange; alv, alveolar airspace. Scale bars: 50 (A) and 15 (B) μm. (FH) Group data quantify change of TRITC-dextran fluorescence in alveolar airspaces of live, intact lungs. Mice were untreated (F) or intranasally instilled with IAV (G and H) at 24 hours before lung excision for imaging. The alveolar epithelium was pretreated as indicated with alveolar microinstillation of HEPES-buffered solution (Buffer) or the indicated reagents dissolved in HEPES-buffered solution; then alveolar airspaces were microinstilled with dextran. Circles indicate n and each represent 1 mouse in which mean dextran fluorescence change was quantified in imaging fields of at least 30 alveoli. Note that dextran fluorescence increased in buffer-treated alveoli of IAV-infected lungs (G, first bar), suggesting that the dextran concentration increased over time. Bars represent mean ± SEM; *P < 0.05 as indicated by ANOVA with post hoc Tukey testing (F and G) or 2-tailed t test (H).
Figure 4
Figure 4. IAV lung infection causes CFTR dephosphorylation.
(AD) Lungs from mice intranasally instilled with IAV or PBS were excised at 24 hours after instillation and homogenized. Representative images (A) and group data of band densitometry (BD) show immunoblot results using antibodies against total (clone A-3) and dephosphorylated (clone 570) CFTR protein as indicated. For group data (BD), circles indicate n and each represent lungs of 1 mouse. Lanes were run on the same gel but were noncontiguous. *P < 0.05 by 2-tailed t test. (EG) Mice were treated with (a) intranasal instillation of liposome-complexed plasmid DNA encoding the plasmid vector, A1440X mutant CFTR, or non-mutant CFTR; then (b) intranasal instillation of IAV at 24 hours. Lungs were excised at 48 hours after plasmid instillation for immunoblot (E and F) or imaging (G). In E and F, representative images (E) and group data of band densitometry (F) show immunoblot results using the indicated antibodies against total and dephosphorylated CFTR protein. Lanes were run on the same gel but were noncontiguous. Actin-probed membranes are not shown. In F and G, circles indicate n and each represent lungs of 1 mouse. In G, group data were derived by confocal imaging of live, intact, perfused mouse lungs and show change of TRITC-dextran fluorescence in alveolar airspaces after alveolar dextran microinstillation. Mean dextran fluorescence change was quantified in an imaging field of at least 30 alveoli. Bars represent mean ± SEM; *P < 0.05 by 1-tailed t test (F) or as indicated by ANOVA with post hoc Tukey testing (G).
Figure 5
Figure 5. Alveolar epithelial CFTR function protects against alveolar stabilization of SAGFP.
(AH) High-power confocal images (AC) and associated group data (D and E) and low-power images (F and G) and associated group data (H) show SAGFP fluorescence in alveolar airspaces before and after alveolar washout. We pretreated alveoli with microinstillation of HEPES-buffered solution (Buffer) or CFTRinh-172 dissolved in HEPES-buffered solution, as indicated, then microinstilled alveolar airspaces with SAGFP. Alveoli were subjected to washout by vigorous alveolar microinstillation of buffer at 1 hour after SAGFP microinstillation. Arrowheads (B, C, F, and G) point out example SAGFP microaggregates (MA) that had complete loss of fluorescence in response to washout, hence were cleared from alveoli. In A, dashed squares indicate locations of images shown in B and C. In F and G, fluorescence of the alveolar epithelium is not shown, but dashed lines delineate example alveolar walls. Circles in D, E, and H indicate n. In D and E, circles each refer to one MA randomly selected before washout from 4 imaging fields of at least 30 alveoli. In H, circles were each generated by comparison of mean SAGFP fluorescence before and after washout in 1 imaging field of at least 30 alveoli. Bars represent mean ± SEM; *P < 0.05 by 2-tailed t test (D and H) or as indicated by ANOVA with post hoc Tukey testing (E). Scale bars: 20 (A), 8 (B), and 50 (F) μm.
Figure 6
Figure 6. IAV lung infection causes alveolar retention of inhaled SAGFP.
Mice were pretreated with intranasal instillation of IAV or PBS as indicated, then intranasally instilled with SAGFP 24 hours later. For group data, circles indicate n and each represent 1 mouse. Bars represent mean ± SEM; *P < 0.05 as indicated by 2-tailed t test. (AC) Low-power (inset) and high-power confocal images (A) show SAGFP fluorescence in live alveoli of intact, blood-perfused, IAV-infected mouse lungs, 1 hour after intranasal SAGFP instillation. Dashed lines delineate example alveolar walls (fluorescence not shown). Single and double arrows indicate SAGFP grouped as small clusters (SC) and microaggregates (MA), respectively. Group data show number (B) and size (C) of SCs and MAs in alveoli of lungs pretreated with PBS or IAV instillation. For B and C, SAGFP group number and size were quantified as means in at least 2 imaged fields of 30 alveoli each. Alv, example alveolar airspace. Scale bars: 50 (inset) and 10 μm. (D and E) Confocal images (D) show alveolar SAGFP fluorescence at 1 hour (left) and, in the same alveoli, at 3 hours (right) after SAGFP instillation. Arrowheads indicate example MAs that spontaneously lost all fluorescence, hence were cleared from alveoli. Group data (E) show the proportion of SAGFP MAs that maintained alveolar fluorescence, hence were retained in alveoli. For E, MAs were quantified as the mean proportion retained in at least 2 imaged fields of 30 alveoli each. Scale bars: 50 μm. (F) Content of viable SAGFP in lung homogenate at 3 hours after intranasal SAGFP instillation.
Figure 7
Figure 7. Systemic CFTR potentiation rescues AWL secretion and blocks alveolar SAGFP stabilization in IAV-infected mice.
Group data quantify confocal images of live, intact, perfused lungs. Mice were given intranasal instillation of IAV, then, at 6 hours, intraperitoneal injection of vehicle (Veh) or ivacaftor (Ivac) as indicated. (A) Lungs were excised for imaging at 24 hours after IAV instillation, and alveoli were microinstilled with TRITC-labeled dextran. Data show change of dextran fluorescence in alveolar airspaces. (B) At 24 hours after IAV instillation, mice were intranasally instilled with SAGFP, then the lungs were immediately excised for imaging. Data show spontaneous change of SAGFP microaggregate (MA) fluorescence in alveolar airspaces from 1–3 hours after intranasal SAGFP instillation. Circles indicate n and each represent 1 mouse in which change of dextran (A) or SAGFP (B) fluorescence was quantified in imaging fields of at least 30 alveoli. Bars represent mean ± SEM; *P < 0.05 by 2-tailed t test.
Figure 8
Figure 8. IAV augments the lung pathogenesis of SAGFP.
Experimental design (A) for group data (BE) indicates timing of intranasal instillations, survival (B) and breathing score (C) assessments, and BAL fluid collection for quantifications of total protein (D) and leukocytes (E). All mice were given a series of 2 instillations as indicated. Breathing scores (C) were imputed for non-surviving mice using their last observed value. Squares (C) and bars (D and E) indicate mean ± SEM; circles (D and E) indicate n and each represent data from 1 mouse; *P < 0.05 vs. black line by log rank (B) or 2-tailed t test (C) or as indicated by ANOVA with post hoc Tukey testing (D and E). BAL contents of protein (D) and leukocytes (E) were quantified using the same fluid specimens.
Figure 9
Figure 9. AWL rescue therapy protects against fatal IAV-SAGFP coinfection.
(AG) Experimental design (A) for group data shown in BG shows timing of intranasal instillations, intraperitoneal injections, and procedures including mouse survival (B) and breathing score (C) assessments, lung excision for quantification of lung wet weight to body weight (LW/BW) ratio (D), BAL fluid collection for quantification of total protein (E) and leukocyte (F) content, and lung excision for SAGFP quantification (CFU; G). Note that 3 mice were untreated and are indicated in D (first bar). Breathing scores (C) were imputed for non-surviving mice using their last observed value. Squares (C) and bars (DG) indicate mean ± SEM; circles (DG) indicate n and each represent data from 1 mouse; *P < 0.05 vs. black line by log rank (B) or 2-tailed t test (C) or as indicated by 1- (D) or 2-tailed (EG) t test. BAL contents of protein (E) and leukocytes (F) were quantified using the same fluid specimen.
Figure 10
Figure 10. AWL rescue therapy does not affect early outcomes of IAV lung infection.
(AF) Experimental design (A) for group data shown in BF shows timing of intranasal instillations, intraperitoneal injections, and procedures including mouse survival (B) and breathing score (C) assessments, BAL fluid collection for quantification of total protein (D) and leukocyte (E) content, and lung excision for IAV quantification (PFU; F). Breathing scores (C) were imputed for non-surviving mice using their last observed value. Squares (C) and bars (DF) indicate mean ± SEM; circles (DF) indicate n and each represent data from 1 mouse; P values were calculated vs. black line by log rank (B) or 2-tailed t test (C) or as indicated by 2-tailed t test (DF). BAL contents of protein (D) and leukocytes (E) were quantified using the same BAL fluid specimen.
Figure 11
Figure 11. CFTR transfections protect against SAGFP-induced mortality in IAV-infected mice.
Experimental design (A) for group data (B and C) indicates timing of intranasal instillations and survival (B) and breathing score (C) assessments. Breathing scores were imputed for non-surviving mice using their last observed value. Circles (C) indicate mean ± SEM; n as indicated; *P < 0.05 vs. magenta line by log rank testing (B) or 2-tailed t test (C).

References

    1. GBD 2017 Causes of Death Collaborators Global, regional, and national age-sex-specific mortality for 282 causes of death in 195 countries and territories, 1980-2017: a systematic analysis for the Global Burden of Disease Study 2017. Lancet. 2018;392(10159):1736–1788. doi: 10.1016/S0140-6736(18)32203-7. - DOI - PMC - PubMed
    1. Jain S, et al. Community-acquired pneumonia requiring hospitalization among U.S. children. N Engl J Med. 2015;372(9):835–845. doi: 10.1056/NEJMoa1405870. - DOI - PMC - PubMed
    1. Jain S, et al. Community-acquired pneumonia requiring hospitalization among U.S. Adults. N Engl J Med. 2015;373(5):415–427. doi: 10.1056/NEJMoa1500245. - DOI - PMC - PubMed
    1. Bartley PS, et al. Bacterial coinfection in influenza pneumonia: rates, pathogens, and outcomes. Infect Control Hosp Epidemiol. 2021;43(2):212–217. doi: 10.1017/ice.2021.96. - DOI - PMC - PubMed
    1. Teng F, et al. Community-acquired bacterial co-infection predicts severity and mortality in influenza-associated pneumonia admitted patients. J Infect Chemother. 2019;25(2):129–136. doi: 10.1016/j.jiac.2018.10.014. - DOI - PubMed

Publication types