. 2023 Aug 15;21(8):e3002176.
doi: 10.1371/journal.pbio.3002176. eCollection 2023 Aug.

Music can be reconstructed from human auditory cortex activity using nonlinear decoding models

Affiliations

Music can be reconstructed from human auditory cortex activity using nonlinear decoding models

Ludovic Bellier et al. PLoS Biol. .

Abstract

Music is core to human experience, yet the precise neural dynamics underlying music perception remain unknown. We analyzed a unique intracranial electroencephalography (iEEG) dataset of 29 patients who listened to a Pink Floyd song and applied a stimulus reconstruction approach previously used in the speech domain. We successfully reconstructed a recognizable song from direct neural recordings and quantified the impact of different factors on decoding accuracy. Combining encoding and decoding analyses, we found a right-hemisphere dominance for music perception with a primary role of the superior temporal gyrus (STG), evidenced a new STG subregion tuned to musical rhythm, and defined an anterior-posterior STG organization exhibiting sustained and onset responses to musical elements. Our findings show the feasibility of applying predictive modeling on short datasets acquired in single patients, paving the way for adding musical elements to brain-computer interface (BCI) applications.


Conflict of interest statement

The authors have declared that no competing interests exist.

Figures

Fig 1
Fig 1. Protocol, data preparation, and encoding model fitting.
(A) Top: Waveform of the entire song stimulus. Participants listened to a 190.72-second rock song (Another Brick in the Wall, Part 1, by Pink Floyd) using headphones. Bottom: Auditory spectrogram of the song. Orange bars on top represent parts of the song with vocals. (B) X-ray showing electrode coverage of 1 representative patient. Each dot is an electrode, and the signal from the 4 highlighted electrodes is shown in (C). (C) HFA elicited by the song stimulus in 4 representative electrodes. (D) Zoom-in on 10 seconds (black bars in A and C) of the auditory spectrogram and the elicited neural activity in a representative electrode. Each time point of the HFA (yi, red dot) is paired with a preceding 750-ms window of the song spectrogram (Xi, black rectangle) ending at this time point (right edge of the rectangle, in red). The set of all pairs (Xi, yi), with i ranging from .75 to 190.72 seconds constitute the examples (or observations) used to train and evaluate the linear encoding models. Linear encoding models used here consist in predicting the neural activity (y) from the auditory spectrogram (X), by finding the optimal intercept (a) and coefficients (w). (E) STRF for the electrode shown in red in (B), (C), and (D). STRF coefficients are z-valued and are represented as w in the previous equation. Note that 0 ms (timing of the observed HFA) is at the right end of the x-axis, as we predict HFA from the preceding auditory stimulus. The data underlying this figure can be obtained at https://doi.org/10.5281/zenodo.7876019. HFA, high-frequency activity; STRF, spectrotemporal receptive field.
Fig 2
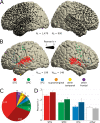
Fig 2. Anatomical location of song-responsive electrodes.
(A) Electrode coverage across all 29 patients shown on the MNI template (N = 2,379). All presented electrodes are free of any artifactual or epileptic activity. The left hemisphere is plotted on the left. (B) Location of electrodes significantly encoding the song’s acoustics (Nsig = 347). Significance was determined by the STRF prediction accuracy bootstrapped over 250 resamples of the training, validation, and test sets. Marker color indicates the anatomical label as determined using the FreeSurfer atlas, and marker size indicates the STRF’s prediction accuracy (Pearson’s r between actual and predicted HFA). We use the same color code in the following panels and figures. (C) Number of significant electrodes per anatomical region. Darker hue indicates a right-hemisphere location. (D) Average STRF prediction accuracy per anatomical region. Electrodes previously labeled as supramarginal, other temporal (i.e., other than STG), and other frontal (i.e., other than SMC or IFG) are pooled together, labeled as other and represented in white/gray. Error bars indicate SEM. The data underlying this figure can be obtained at https://doi.org/10.5281/zenodo.7876019. HFA, high-frequency activity; IFG, inferior frontal gyrus; MNI, Montreal Neurological Institute; SEM, Standard Error of the Mean; SMC, sensorimotor cortex; STG, superior temporal gyrus; STRF, spectrotemporal receptive field.
Fig 3
Fig 3. Song reconstruction and methodological considerations.
(A) Prediction accuracy as a function of the number of electrodes included as predictors in the linear decoding model. On the y-axis, 100% represents the maximum decoding accuracy, obtained using all 347 significant electrodes. The black curve shows data points obtained from a bootstrapping analysis with 100 resamples for each number of electrodes (without replacement), while the red curve shows a two-term power series fit line. Error bars indicate SEM. (B) Prediction accuracy as a function of dataset duration. (C) Auditory spectrograms of the original song (top) and of the reconstructed song using either linear (middle) or nonlinear models (bottom) decoding from all responsive electrodes. This 15-second song excerpt was held out during hyperparameter tuning through cross-validation and model fitting and used solely as a test set to evaluate model performance. Corresponding audio waveforms were obtained through an iterative phase-estimation algorithm and can be listened to in S1, S2, and S3 Audio files, respectively. Average effective r-squared across all 128 frequency bins is shown above both decoded spectrograms. (D) Auditory spectrogram of the reconstructed song using nonlinear models from electrodes of patient P29 only. Corresponding audio waveform can be listened to in S4 Audio. The data underlying this figure can be obtained at https://doi.org/10.5281/zenodo.7876019. SEM, Standard Error of the Mean.
Fig 4
Fig 4. Song-excerpt identification rank analysis.
After decoding the whole song through 12 distinct 15-second test sets, we divided both the original song and the decoded spectrogram into 5-second excerpts and computed the correlation coefficient for all possible original-decoded pairs. (A) Decoding using linear models. Left panel shows the correlation matrix, with red dots indicating the row-wise maximum values (e.g., first decoded 5-second excerpt correlates most with 32nd original song excerpt). Right panel shows a histogram of the excerpt identification rank, a measure of how close the maximum original-decoded correlation coefficient landed from true excerpt identify (e.g., third original-decoded pair correlation coefficient, on the matrix diagonal, was the second highest value on the third excerpt’s row, thus ranked 37/38). Gray shaded area represents the 95% confidence interval of the null distribution estimated through 1,000 random permutations of the original song excerpt identities. The red vertical line shows the average identification rank across all song excerpts. (B) Same panels for decoding using nonlinear models. The data underlying this figure can be obtained at https://doi.org/10.5281/zenodo.7876019.
Fig 5
Fig 5. Analysis of the STRF tuning patterns.
(A) Representative set of 10 STRFs (out of the 347 significant ones) with their respective locations on the MNI template using matching markers. Color code is identical to the one used in Fig 1. (B) Three ICA components each explaining more than 5% variance of all 347 significant STRFs. These 3 components show onset, sustained, and late onset activity. Percentages indicate explained variance. (C) ICA coefficients of these 3 components, plotted on the MNI template. Color code indicates coefficient amplitude, with in red the electrodes which STRFs represent the components the most. (D) To capture tuning to the rhythm guitar pattern (16th notes at 100 bpm, i.e., 6.66 Hz), pervasive throughout the song, we computed temporal modulation spectra of all significant STRFs. Example modulation spectrum is shown for a right STG electrode. For each electrode, we extracted the maximum temporal modulation value across all spectral frequencies around a rate of 6.66 Hz (red rectangle). (E) All extracted values are represented on the MNI template. Electrodes in red show tuning to the rhythm guitar pattern. The data underlying this figure can be obtained at https://doi.org/10.5281/zenodo.7876019. ICA, independent component analysis; MNI, Montreal Neurological Institute; STG, superior temporal gyrus; STRF, spectro-temporal receptive field.
Fig 6
Fig 6. Encoding of musical elements.
(A) Auditory spectrogram of the whole song. Orange bars above the spectrogram mark all parts with vocals. Blue bars mark lead guitar motifs, and purple bars mark synthesizer motifs. Green vertical bars delineate a series of eight 4/4 bars (or measures). Thicker orange and blue bars mark locations of the zoom-ins presented in (D) and (E), respectively. (B) Three STRF components as presented in Fig 5B, namely onset (top), sustained (middle), and late onset (bottom). (C) Output of the sliding correlation between the song spectrogram (A) and each of the 3 STRF components (B). Positive Pearson’s r values are plotted in red, marking parts of the song that elicited an increase of HFA in electrodes exhibiting the given component. Note that for the sustained plot (middle), positive correlation coefficients are specifically observed during vocals. Also, note for both the onset and late onset plots (top and bottom, respectively), positive r values in the second half of the song correspond to lead guitar and synthesizer motifs, occurring every other 4/4 bar. (D) Zoom-in on the third vocals. Lyrics are presented above the spectrogram, decomposed into syllables. Most syllables triggered an HFA increase in both onset and late onset plots (top and bottom, respectively), while a sustained increase of HFA was observed during the entire vocals (middle). (E) Zoom-in on a lead guitar motif. Sheet music is presented above the spectrogram. Most notes triggered an HFA increase in both onset and late onset plots (top and bottom, respectively), while there was no HFA increase for the sustained component (middle). The data underlying this figure can be obtained at https://doi.org/10.5281/zenodo.7876019. HFA, high-frequency activity; STRF, spectrotemporal receptive field.
Fig 7
Fig 7. Ablation analysis on linear decoding models.
We performed “virtual lesions” in the predictors of decoding models, by ablating either anatomical (A) or functional (B) sets of electrodes. Ablated sets are shown on the x-axis, and their impacts on the prediction accuracy (Pearson’s r) of linear decoding models, as compared to the performance of a baseline decoding model using all 347 significant electrodes, are shown on the y-axis. For each ablation, a notched box plot represents the distribution of the changes in decoding accuracy for all 32 decoding models (one model per frequency bin of the auditory spectrogram). For each box, the central mark indicates the median; the notch delineates the 95% confidence interval of the median; bottom and top box edges indicate the 25th and 75th percentiles, respectively; whiskers delineate the range of nonoutlier values; and circles indicate outliers. Red asterisks indicate significant impact from ablating a given set of electrodes. The data underlying this figure can be obtained at https://doi.org/10.5281/zenodo.7876019.

References

    1. Peretz I. The nature of music from a biological perspective. Cognition. 2006. May 1;100(1):1–32. doi: 10.1016/j.cognition.2005.11.004 - DOI - PubMed
    1. Janata P. Neural basis of music perception. Handb Clin Neurol. 2015;129:187–205. doi: 10.1016/B978-0-444-62630-1.00011-1 - DOI - PubMed
    1. Goydke KN, Altenmüller E, Möller J, Münte TF. Changes in emotional tone and instrumental timbre are reflected by the mismatch negativity. Brain Res Cogn Brain Res. 2004;21(3):351–359. doi: 10.1016/j.cogbrainres.2004.06.009 - DOI - PubMed
    1. Alluri V, Toiviainen P, Jääskeläinen IP, Glerean E, Sams M, Brattico E. Large-scale brain networks emerge from dynamic processing of musical timbre, key and rhythm. Neuroimage. 2012. Feb 15;59(4):3677–3689. doi: 10.1016/j.neuroimage.2011.11.019 - DOI - PubMed
    1. Kumar S, Sedley W, Nourski KV, Kawasaki H, Oya H, Patterson RD, et al.. Predictive coding and pitch processing in the auditory cortex. J Cogn Neurosci. 2011. Oct;23(10):3084–3094. doi: 10.1162/jocn_a_00021 - DOI - PMC - PubMed

Publication types