. 2023 Nov 14;7(21):6520-6531.
doi: 10.1182/bloodadvances.2023010887.

AML with complex karyotype: extreme genomic complexity revealed by combined long-read sequencing and Hi-C technology

Affiliations

AML with complex karyotype: extreme genomic complexity revealed by combined long-read sequencing and Hi-C technology

Marius-Konstantin Klever et al. Blood Adv. .

Abstract

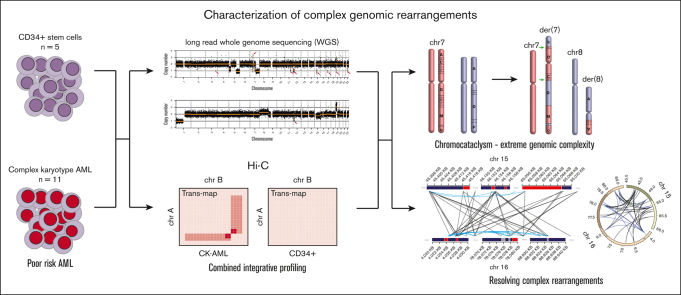
Acute myeloid leukemia with complex karyotype (CK-AML) is associated with poor prognosis, which is only in part explained by underlying TP53 mutations. Especially in the presence of complex chromosomal rearrangements, such as chromothripsis, the outcome of CK-AML is dismal. However, this degree of complexity of genomic rearrangements contributes to the leukemogenic phenotype and treatment resistance of CK-AML remains largely unknown. Applying an integrative workflow for the detection of structural variants (SVs) based on Oxford Nanopore (ONT) genomic DNA long-read sequencing (gDNA-LRS) and high-throughput chromosome confirmation capture (Hi-C) in a well-defined cohort of CK-AML identified regions with an extreme density of SVs. These rearrangements consisted to a large degree of focal amplifications enriched in the proximity of mammalian-wide interspersed repeat elements, which often result in oncogenic fusion transcripts, such as USP7::MVD, or the deregulation of oncogenic driver genes as confirmed by RNA-seq and ONT direct complementary DNA sequencing. We termed this novel phenomenon chromocataclysm. Thus, our integrative SV detection workflow combing gDNA-LRS and Hi-C enables to unravel complex genomic rearrangements at a very high resolution in regions hard to analyze by conventional sequencing technology, thereby providing an important tool to identify novel important drivers underlying cancer with complex karyotypic changes.


Conflict of interest statement

Conflict-of-interest disclosure: L.B. has advisory role in AbbVie, Amgen, Astellas, Bristol Myers Squibb, Celgene, Daiichi Sankyo, Gilead, Hexal, Janssen, Jazz Pharmaceuticals, Menarini, Novartis, Pfizer, Sanofi, and Seattle Genetics; and receives research funding from Bayer and Jazz Pharmaceuticals. The remaining authors declare no competing financial interests.

Figures

None
Graphical abstract
Figure 1.
Figure 1.
Cohort overview and complex genomic rearrangements detected by our SV detection workflow. (A) Samples from patients with CK-AML (n = 11) were subjected to genomic sequencing (Hi-C and ONT-GS) for SV detection. In addition, healthy CD34+ stem cell donors (n = 5) and the CK-AML samples were RNA-sequenced (Illumina RNA-Seq and ONT cDNA Seq) to study the functional consequences of the SVs. (B-C) Hi-C maps of patient CK1-Mut, chromosome 7/8 trans-map (B) and chromosome 7 cis-map (C). Hi-C breakend regions were inferred based on signal intensity at the breakends and are marked by black squares (named “a” to “h” for simplicity). Region d was shown to only harbor breakpoint-like patterns in the integrated analysis with NanoVar data. (D) Zoomed in detail of Hi-C maps showing breakends detected by both Hi-C and NanoVar (green squares with black squares inside). In these cases, the NanoVar SV calls were found to map in the same 10 kb range in which the BND were located estimated based on Hi-C. In region “e,” we observed an indirect BND-like structure in the upper right corner (black square) without a corresponding NanoVar SV call. Interestingly, a NanoVar SV pointed out to a small fragment (<5 kb, named N2), also visible in Hi-C but missed in the primary visual inspection. This fragment represents the actual trans-map BND of chromosome 7/8 in breakpoint region “e” and is depicted also by a black square inside a green square (for Hi-C and NanoVar support) here. The previously assumed breakend in region “e” was shown to be connected to the N2 fragment in cis (data not shown). (E) Based on the Hi-C pattern, we identified 2 regimes of complexity in our cohort: all of the CK-AML cases that were TP53 mutated displayed chromothriptic rearrangements, whereas most cases that were TP53 wildtype showed far less complexity. Hi-C BND regions are highlighted by black squares.
Figure 2.
Figure 2.
Chromocataclysm in CK-AML. (A) Circos plot of a chromocataclysm rearrangement in CK2-Mut and noncomplex rearrangements in CK6-Wt, CK7-Wt, and CK9-Wt. A clustering of breakends is preserved at all 3 stages of magnification shown here for case CK2-Mut. The clustering is here shown at full chromosome view on the left to increasing levels of magnifications in the middle and to the right indicating a chromocataclysm like pattern. Numbers indicate position on the chromosome in megabases. CK7-Wt and CK9-Wt have a similar BND connecting chromosomes 19 and 11. (B) Detailed view of some of the most complex regions that are involved in the chromocataclysm rearrangement of Chr15 and Chr16 in CK2-Mut, illustrating the extreme local complexity of CNVs and breakends. Bars show the local CN of the involved fragments. Blue: CN loss (CN < 1.7). Gray: CN stable (CN 1.7 ≤ x ≤ 2.3). Red: CN gain (CN > 2.3). Black lines show translocations (breakends on 2 different chromosomes), blue lines show inversions (breakends on the same chromosome). Dots connecting the displayed regions represent regions that are due to the complexity of the rearrangement not shown here. If breakends from the displayed regions projected to the nondisplayed regions, connections were still shown here by blue or black lines.
Figure 3.
Figure 3.
CN distribution and enrichment of breakends in the genome. (A) Violin plots of CN distribution in the final CNV data set of the TP53 mutated (n = 6) and TP53 wildtype (n = 5) cases. Each dot represents 1 fragment (distinct region on a genome of reference) and its respective CN. (B) Genomic fragments of <20 kb in size of the 4 cases with the highest complexity (total number of CN changes). The cases are ordered by rearrangement complexity. Blue: CN loss (CN < 1.7); red: CN gain (CN > 2.3). (C) Breakend enrichment analysis showed increased observed/expected ratio of breakends in gene promoters, 3’UTRs and introns; the opposite is observed for intergenic and 5’UTR regions. (D-E) Heatmap of the occurrence of BND in chromocataclysm cases (D) and chromothripsis cases without chromocataclysm (E) in the proximity of repetitive elements (repeat subcategories from RepeatMasker). The normalized relative occurrence was calculated for different intervals from the BNDs.
Figure 4.
Figure 4.
Identification of fusion transcripts. (A) Illustration of the fusion transcript detection pipeline, starting with integrating matching fusion transcript calls from JAFFA (Illumina RNA and ONTdirect cDNA data set) and filtering them by applying the criterion of 2 corresponding SV breakends to each identified fusion transcript. (B) Two fusion transcripts that were identified in RNA sequencing data set and also present matching genomic BNDs. The USP7/MVD fusion transcript was created by including the transcription start site (TSS) of USP7 next to the TSS of MVD, without disrupting MVD open reading frame. The fusion transcript was likely generated owing to a use of USP7 TSS and subsequent splicing-out of the first exon of MVD. TSSs are represented by black arrows; the genomic BNDs are marked by a blue arrow; and regions where the point of exon fusion was identified by JAFFA are marked with green arrows. (C) Cell culture growth of the NIH3T3 cell line transfected with a retroviral vector containing the USP7/MVD fusion transcript vs NIH3T3 cell line containing an empty vector. (D) Western blot results of the USP7/MVD fusion transcript compared with empty vector results.
Figure 5.
Figure 5.
Gene dysregulation and influence of CN changes in CK-AML. (A) Schematic overview of our differentially expressed genes (DEG) analysis that integrates gene expression (GE) with CN information. CN ↓, CN loss; CN ↑, CN gain; GE ↓, gene downregulation; GE ↑, gene upregulation. (B) Number of genes from the 30 “downregulated candidate genes” that were downregulated in the respective case. (C) Number of genes from the 30 downregulated candidate genes that were downregulated and showed a CN loss at the gene locus.

References

    1. Shallis RM, Wang R, Davidoff A, Ma X, Zeidan AM. Epidemiology of acute myeloid leukemia: recent progress and enduring challenges. Blood Rev. 2019;36:70–87. - PubMed
    1. Döhner H, Wei AH, Appelbaum FR, et al. Diagnosis and management of AML in adults: 2022 recommendations from an international expert panel on behalf of the ELN. Blood. 2022;140(12):1345–1377. - PubMed
    1. Khoury JD, Solary E, Abla O, et al. The 5th edition of the World Health Organization classification of haematolymphoid tumours: myeloid and histiocytic/dendritic neoplasms. Leukemia. 2022;36(7):1703–1719. - PMC - PubMed
    1. Arber DA, Orazi A, Hasserjian RP, et al. International Consensus Classification of myeloid neoplasms and acute leukemias: integrating morphologic, clinical, and genomic data. Blood. 2022;140(11):1200–1228. - PMC - PubMed
    1. Rücker FG, Schlenk RF, Bullinger L, et al. TP53 alterations in acute myeloid leukemia with complex karyotype correlate with specific copy number alterations, monosomal karyotype, and dismal outcome. Blood. 2012;119(9):2114–2121. - PubMed

Publication types

Substances