. 2023 Aug 31;186(18):3945-3967.e26.
doi: 10.1016/j.cell.2023.07.013. Epub 2023 Aug 14.

Pan-cancer analysis of post-translational modifications reveals shared patterns of protein regulation

Collaborators, Affiliations

Pan-cancer analysis of post-translational modifications reveals shared patterns of protein regulation

Yifat Geffen et al. Cell. .

Abstract

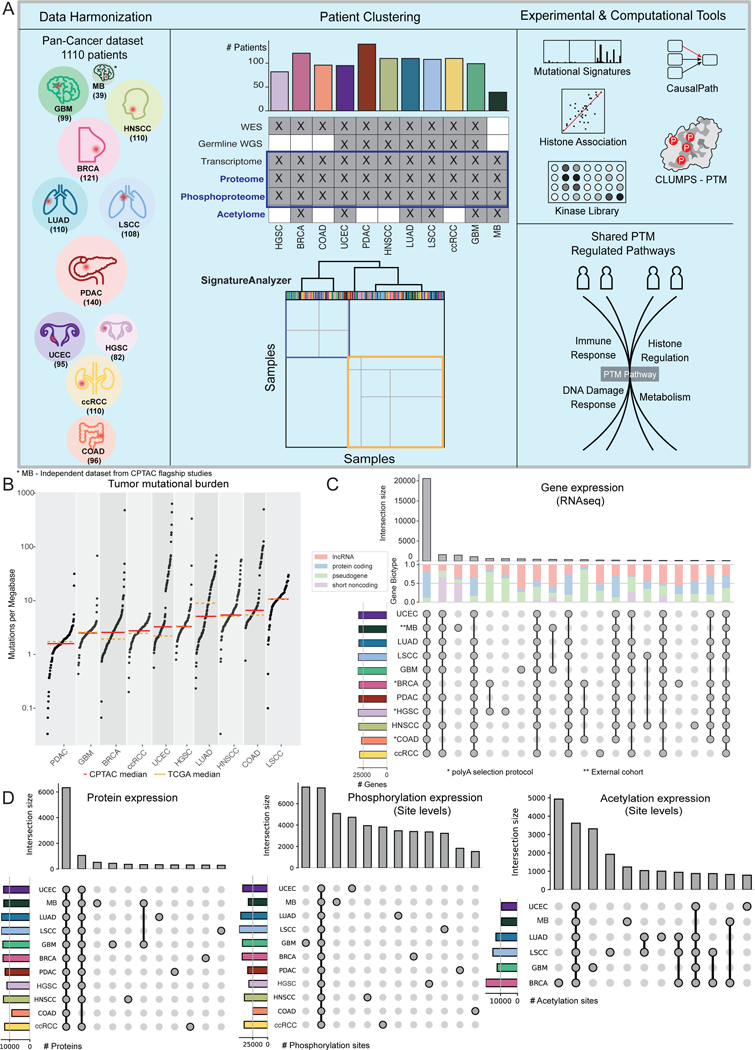
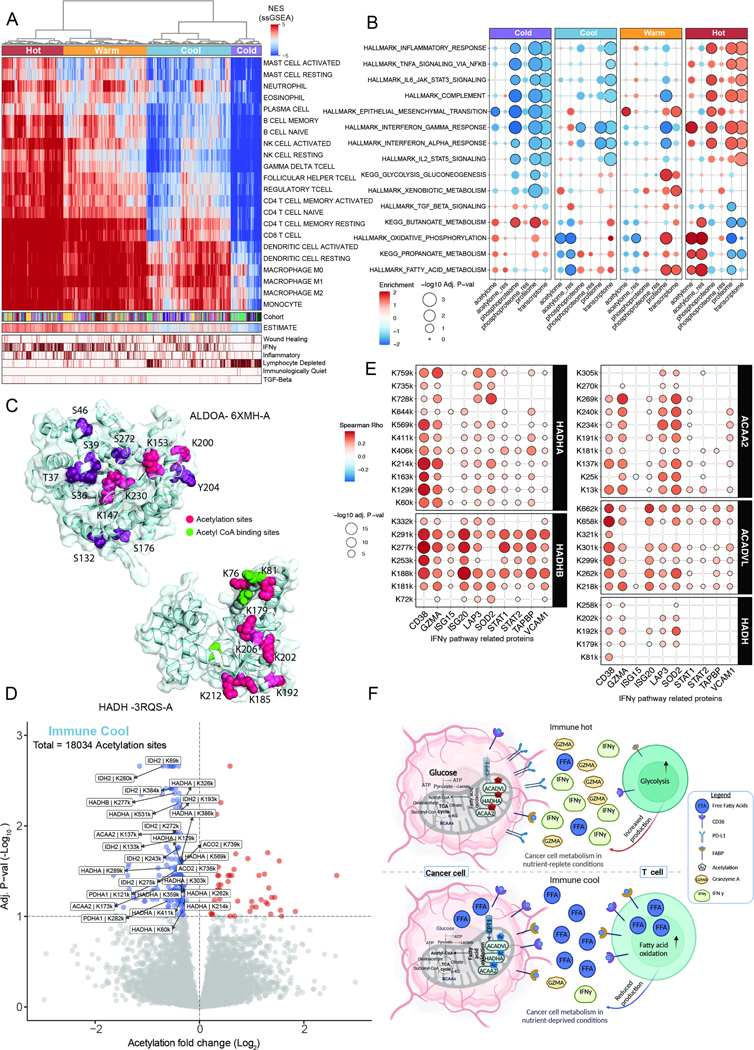
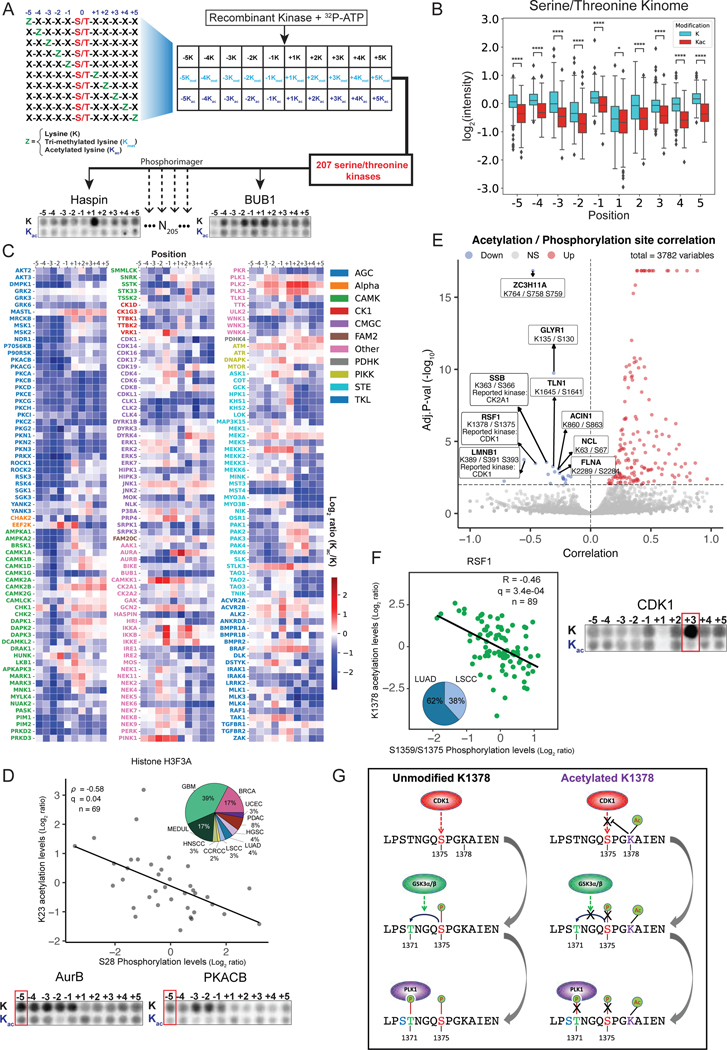
Post-translational modifications (PTMs) play key roles in regulating cell signaling and physiology in both normal and cancer cells. Advances in mass spectrometry enable high-throughput, accurate, and sensitive measurement of PTM levels to better understand their role, prevalence, and crosstalk. Here, we analyze the largest collection of proteogenomics data from 1,110 patients with PTM profiles across 11 cancer types (10 from the National Cancer Institute's Clinical Proteomic Tumor Analysis Consortium [CPTAC]). Our study reveals pan-cancer patterns of changes in protein acetylation and phosphorylation involved in hallmark cancer processes. These patterns revealed subsets of tumors, from different cancer types, including those with dysregulated DNA repair driven by phosphorylation, altered metabolic regulation associated with immune response driven by acetylation, affected kinase specificity by crosstalk between acetylation and phosphorylation, and modified histone regulation. Overall, this resource highlights the rich biology governed by PTMs and exposes potential new therapeutic avenues.

Keywords: CPTAC; DNA damage response; genomics; mass spectrometry; metabolism; pan-cancer; post-translational modifications; proteomics; transcriptomics.


Conflict of interest statement

Declaration of interests Y.G. is a consultant for Oriel Research Therapeutics. T.M.Y. is a co-founder, stockholder, and on the board of directors of DESTROKE, Inc., an early-stage start-up developing mobile technology for automated clinical stroke detection. J.L.J. has received consulting fees from Scorpion Therapeutics and Volastra Therapeutics. Y.E.M. is a consultant for ForseeGenomics and is also an inventor on patent applications filed by the Broad Institute related to MSMuTect, MSMutSig, and MSIDetect. N.J.H. is a consultant for MorphoSys. F.A. is an inventor on a patent application related to SignatureAnalyzer-GPU and has been an employee of Illumina, Inc., since 8 November 2021. L.C.C. is a founder and member of the board of directors of Agios Pharmaceuticals and is a founder of Petra Pharmaceuticals. L.C.C. is an inventor on patents (pending) for Combination Therapy for PI3K-associated Disease or Disorder, and The Identification of Therapeutic Interventions to Improve Response to PI3K Inhibitors for Cancer Treatment. L.C.C. is a co-founder and shareholder in Faeth Therapeutics. G.G. receives research funds from IBM, Pharmacyclics, and Ultima Genomics, and is also an inventor on patent applications filed by the Broad Institute related to MSMuTect, MSMutSig, POLYSOLVER, SignatureAnalyzer-GPU, MSIDetect, and MinimuMM-Seq. He is also a founder, consultant, and privately held equity in Scorpion Therapeutics.

Figures

Figure 1 -
Figure 1 -
Pan-Cancer dataset overview A. Pan-Cancer analysis workflow: (left) Data harmonization of available cohorts; (middle top) Available data types and discovery of multi-omic signatures based on RNA, proteins, and phosphosites, (middle bottom) clustering of samples based on signature activities; (right top) Experimental and computational tools used to study clusters of tumors and pathways; (right bottom) Highlighted cancer pathways with altered post-translational modifications. B. TMB across cohorts -CPTAC median: Red, TCGA median: dotted orange. C. Upset plots showing the distribution of shared expressed genes (RNA) and the different RNA Biotypes contribution. D. Upset plots showing the distribution of shared proteins (left) and site-level phosphorylation (middle) and acetylation (right) across the different cohorts (bars representing ~85% of the data for visibility).
Figure 2 -
Figure 2 -
Pan-Cancer PTM landscape A. Hierarchical clustering of sample similarity matrices across their signature activities (middle heatmap). Tracks: (top) Cluster, and cohort annotations, (middle) whole-exome mutational signatures and (below) ESTIMATE assignments. Lower panel heatmap shows RNA, proteins and phosphosites in the top differentially expressed pathways between the left and right sides of the first split of the dendrogram. B. Bubble plot representation of The Kinase Library enrichment based on differentially expressed substrates of each kinase between the first split of the dendrogram. Enrichment (Red), depletion (Blue). C. CLUMPS-PTM results for the first split shows Significant 3D spatial clustering of differentially acetylated (left, triangles) or phosphorylated (right, boxes) sites. Circles represent significance based on the union of both. DDR hallmark geneset (blue). Red: Significant results - FDR <0.1, Yellow: near significance results- FDR <0.25. D. SRSF2 phosphorylation cluster on 3D crystal structure (cyan; PDB ID: 2LEA), RRM-1 domain (amber), phosphosites (purple). E. ARID1A acetylation cluster on 3D crystal structure (cyan,PDB ID: 6LTH), acetylsites (pink). F. Violin plots showing protein abundances of ARID1A (left), and Glucocorticoid targets (right) between the first split of the dendrogram.
Figure 3 -
Figure 3 -
PTM Analysis of DNA Repair Deficiencies A. Mutational signatures associated with each cohort. Circle size represents the proportion of tumors. Circle color indicates median mutations/Mb. B. Volcano plot illustrating the differential phosphorylation between HRD and HRP tumors. MMEJ genes are labeled. C. Violin plot of 1st principal component projections based on the multi-omic signature activities for HRD tumors. Points are colored by their cancer type and separated by HRD cluster. D.Schematic diagram of the acute and chronic hypoxia HRD clusters (top). Arrow length represents duration of hypoxia. Bubble plot showing GSEA results between the acute and chronic hypoxia HRD subgroups (bottom). E. CausalPath results of differentially expressed DDR genes between acute and chronic hypoxia HRD tumors. Acute hypoxia upregulation (red), downregulation (blue). Black dashed lines - 90th percentile scoring substrates based on The Kinase Library results. F. Bubble plot showing GSEA results between MMRD and MMRP tumors. MMRD pathways upregulated (red), downregulated (blue). G. Violin plots showing protein abundance (top) and RNA (bottom) levels of MRN complex proteins between MMRD and MMRP tumors (COAD [circle] and UCEC [triangle]). RAD50 microsatellite frameshift indel samples indicated in red. H. CausalPath results of differentially expressed DDR genes between MMRD and MMRP tumors as in panel E.
Figure 4 -
Figure 4 -
PTM regulation of immuno-metabolism across cancers A. ssGSEA hierarchical clustering for immune-related gene sets (heatmap) showing four immune clusters: hot to cold. Tracks represent ESTIMATE and ImmuneSubtypeClassifier annotations. B. Bubble plot representing MSigDB Hallmark and KEGG pathways enrichment among the four immune subtypes. C. Significant clustering based on CLUMPS-PTM of both acetylation and phosphorylation sites on ALDOA (top panel; PDB ID: 6XMH-A) in the immune-hot group, and clustering of decreased acetylation sites on HADH in the immune-cool cluster (lower panel; PDB ID: 3RQS-A). Phosphosites (purple), acetylsites (pink), and Acetyl CoA binding sites (green). D. Volcano plot showing differential acetylation between the immune-cool subtype and the other immune clusters. Acetylation sites on fatty acid metabolism proteins are highlighted. E. Bubble plot representing significant correlations between fatty acid beta oxidation enzymes acetylation sites and protein levels from the IFNγ pathway. F. Schematic representation of PTM-based metabolic changes in immune-cool vs. immune- hot tumors showing key enzymes in the glycolysis and fatty acid beta oxidation pathways and their proposed effect on T cells.
Figure 5 -
Figure 5 -
Pan-Cancer histone regulation A. Heatmap showing site level acetylation of various histone protein substrates across 6 cohorts. Tracks above show the cohort, cluster assignment, gender and smoking score. B. Scatter plots showing the rankings of site-specific histone PTM levels and tobacco smoking mutational signature activities. 95% confidence intervals of the Spearman’s correlation coefficient determined by bootstrapping. C. Bubble plot showing Pan-Cancer associations between key regulators of histone acetylation and histone acetylation sites. D. Scatter plots showing the lasso regression associations between histone regulators and H2B acetylation levels across all tumors and in specific clusters in the dendrogram. E. Heatmap showing the differentially acetylated histone sites in the Immune Cold subtype compared to all other immune subtypes. F. Correlations between histone acetylation sites and close proximity phosphorylation sites.
Figure 6 -
Figure 6 -
Pan-Cancer acetylation and phosphorylation crosstalk A. The Kinase Library overview - biochemical assay of a combinatorial peptide library with unmodified, methylated, or acetylated lysine for testing kinases affinity to peptides with modified lysins at ±5 positions relative to the Ser/Thr phospho-acceptor residue (excluding serine, threonine, and cysteine). B. Box plot showing the average intensity for unmodified and acetylated lysine residues. C. Heatmap showing ratio between mean intensities for acetylated and unmodified lysine residues. Kinases are colored according to their phylogenetic groups. D. Scatter plot showing the correlation between K23 acetylation levels and S28 phosphorylation levels on Histone H3–3A and their cohort distribution (top panel). Biochemical specificity assays showing AurB and PKACB phosphorylation between unmodified and acetylated peptides (bottom panel). E. Volcano plot showing correlations between pairs of phosphorylation and acetylation sites. Negative correlations are highlighted. F. Scatter plot showing the correlation between K1378 acetylation levels and S1375 phosphorylation levels on RSF1 and their cohort distribution (left panel). Biochemical specificity assays showing CDK1 phosphorylation between unmodified and acetylated peptides (right panel). G. Inhibitory crosstalk proposed mechanism on RSF1.

References

    1. Ding L, Bailey MH, Porta-Pardo E, Thorsson V, Colaprico A, Bertrand D, Gibbs DL, Weerasinghe A, Huang K-L, Tokheim C, et al. (2018). Perspective on Oncogenic Processes at the End of the Beginning of Cancer Genomics. Cell 173, 305–320.e10. 10.1016/j.cell.2018.03.033. - DOI - PMC - PubMed
    1. Doroshow DB, and Doroshow JH (2020). Genomics and the History of Precision Oncology. Surg. Oncol. Clin. N. Am 29, 35–49. 10.1016/j.soc.2019.08.003. - DOI - PMC - PubMed
    1. Rodriguez H, Zenklusen JC, Staudt LM, Doroshow JH, and Lowy DR (2021). The next horizon in precision oncology: Proteogenomics to inform cancer diagnosis and treatment. Cell 184, 1661–1670. 10.1016/j.cell.2021.02.055. - DOI - PMC - PubMed
    1. Wang L-B, Karpova A, Gritsenko MA, Kyle JE, Cao S, Li Y, Rykunov D, Colaprico A, Rothstein JH, Hong R, et al. (2021). Proteogenomic and metabolomic characterization of human glioblastoma. Cancer Cell 39, 509–528.e20. 10.1016/j.ccell.2021.01.006. - DOI - PMC - PubMed
    1. Huang C., Chen L., Savage SR., Eguez RV., Dou Y., L Y., da Veiga Leprevost F., Jaehnig EJ., Lei JT., Wen B., et al. (2021). Proteogenomic insights into the biology and treatment of HPV-negative head and neck squamous cell carcinoma. Cancer Cell 39, 361–379.e16. 10.1016/j.ccell.2020.12.007. - DOI - PMC - PubMed

Publication types

LinkOut - more resources