

Protein-metabolite association studies identify novel proteomic determinants of metabolite levels in human plasma
- PMID: 37582364
- PMCID: PMC11118091
- DOI: 10.1016/j.cmet.2023.07.012
Protein-metabolite association studies identify novel proteomic determinants of metabolite levels in human plasma
Abstract
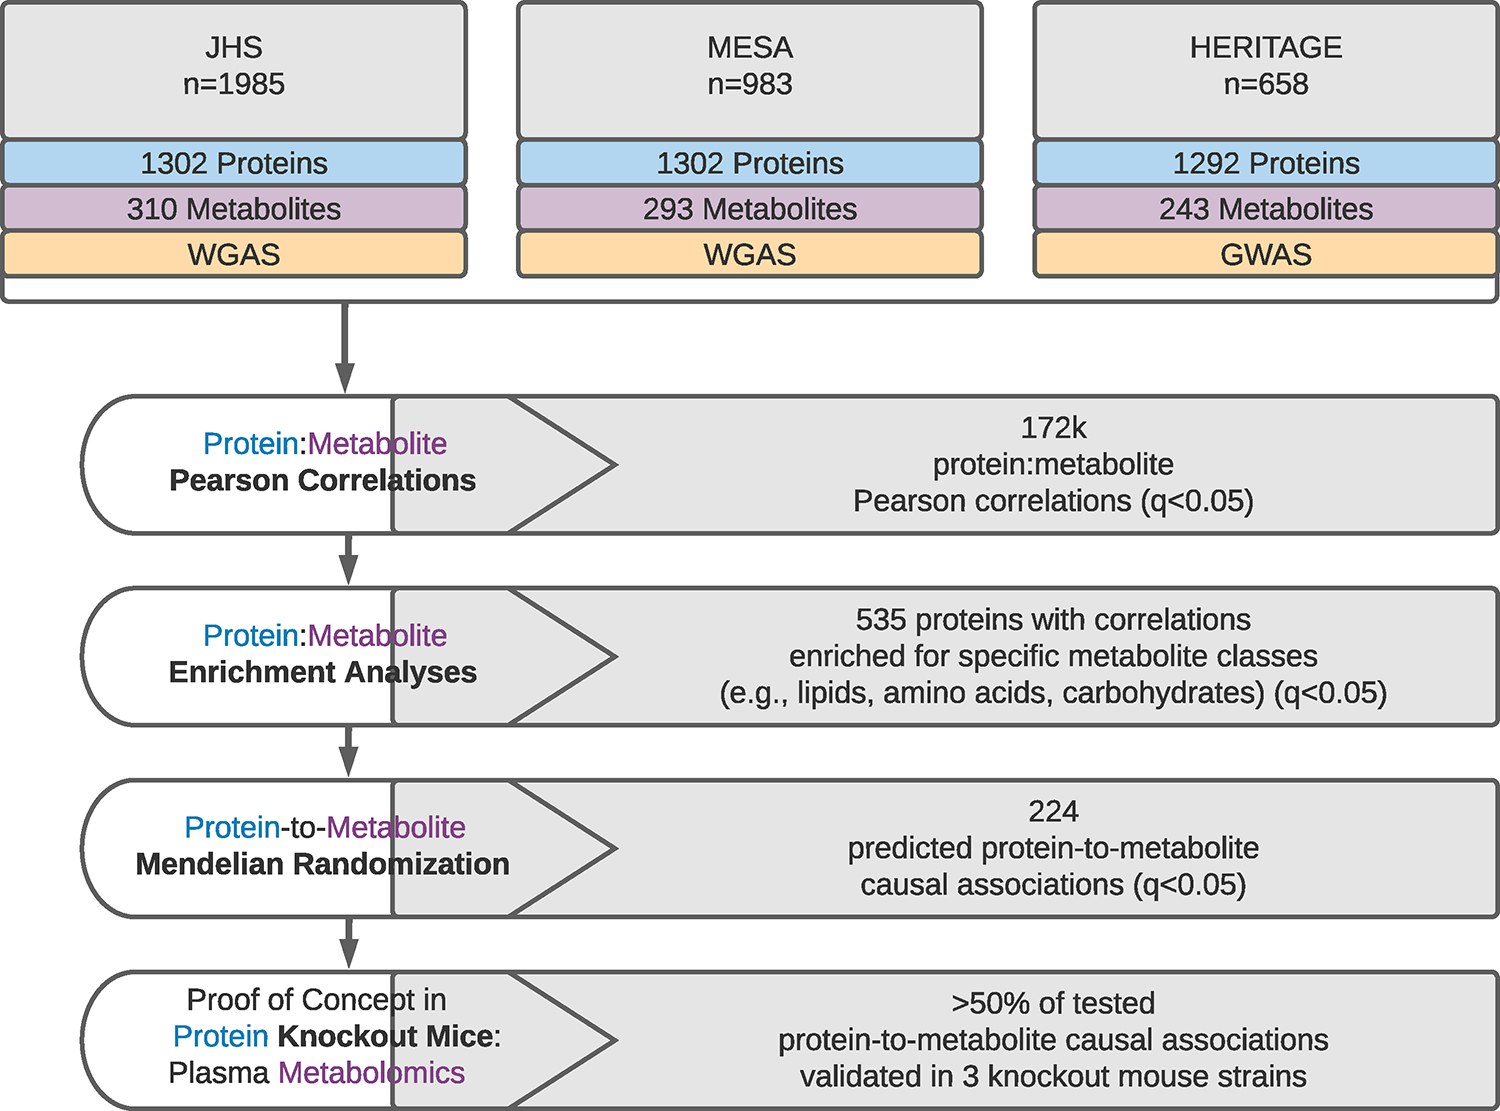
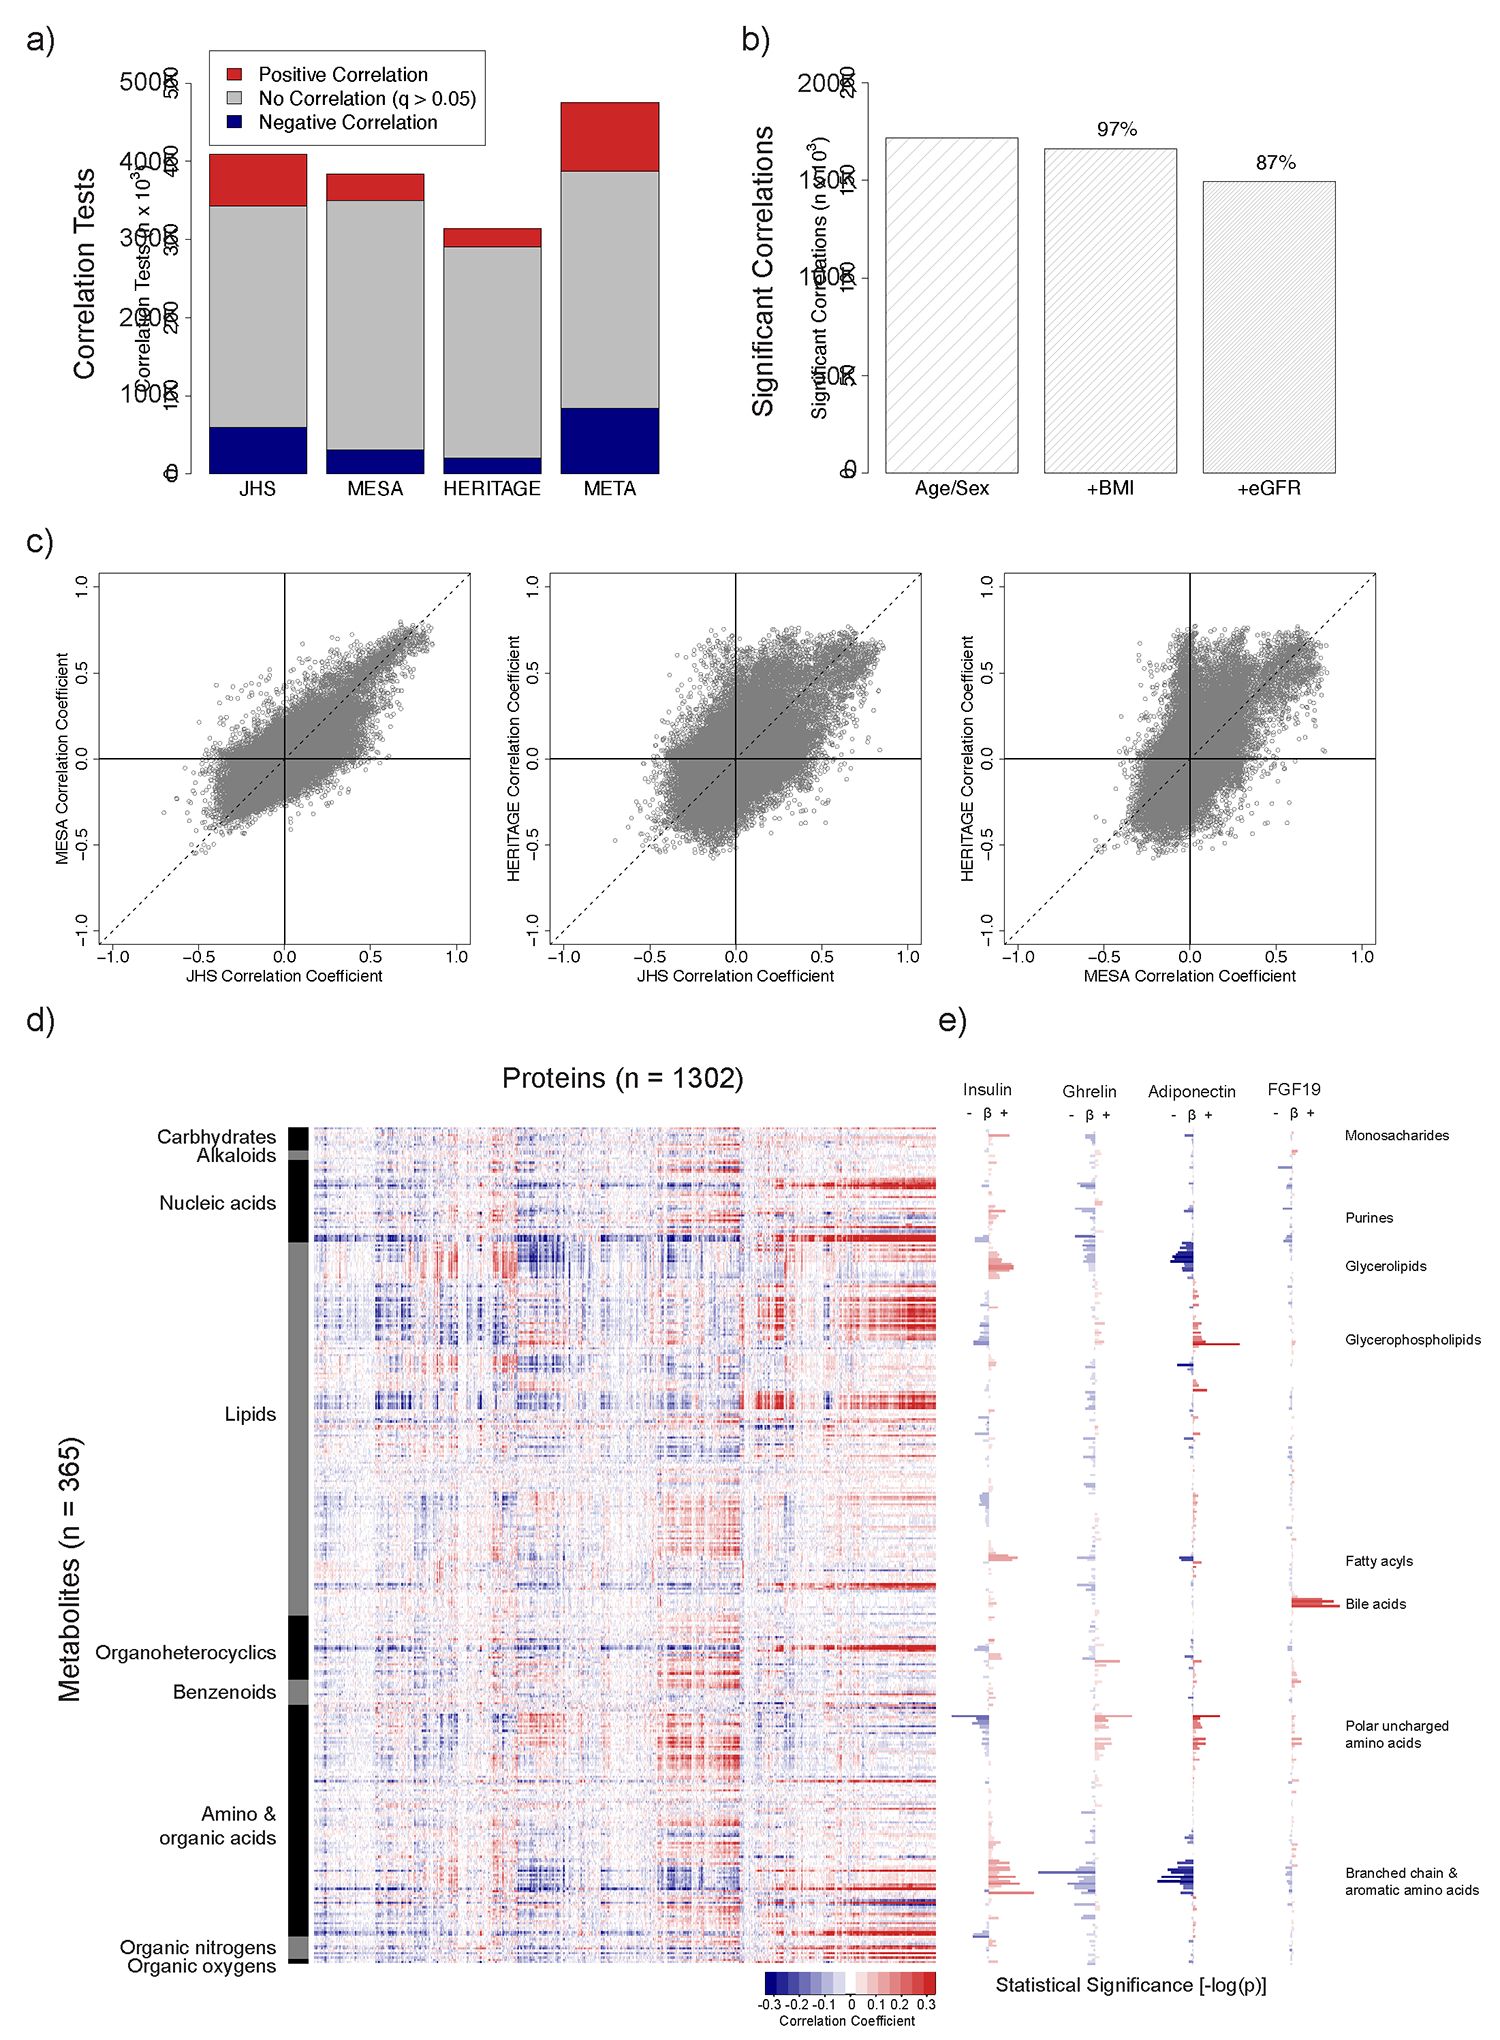
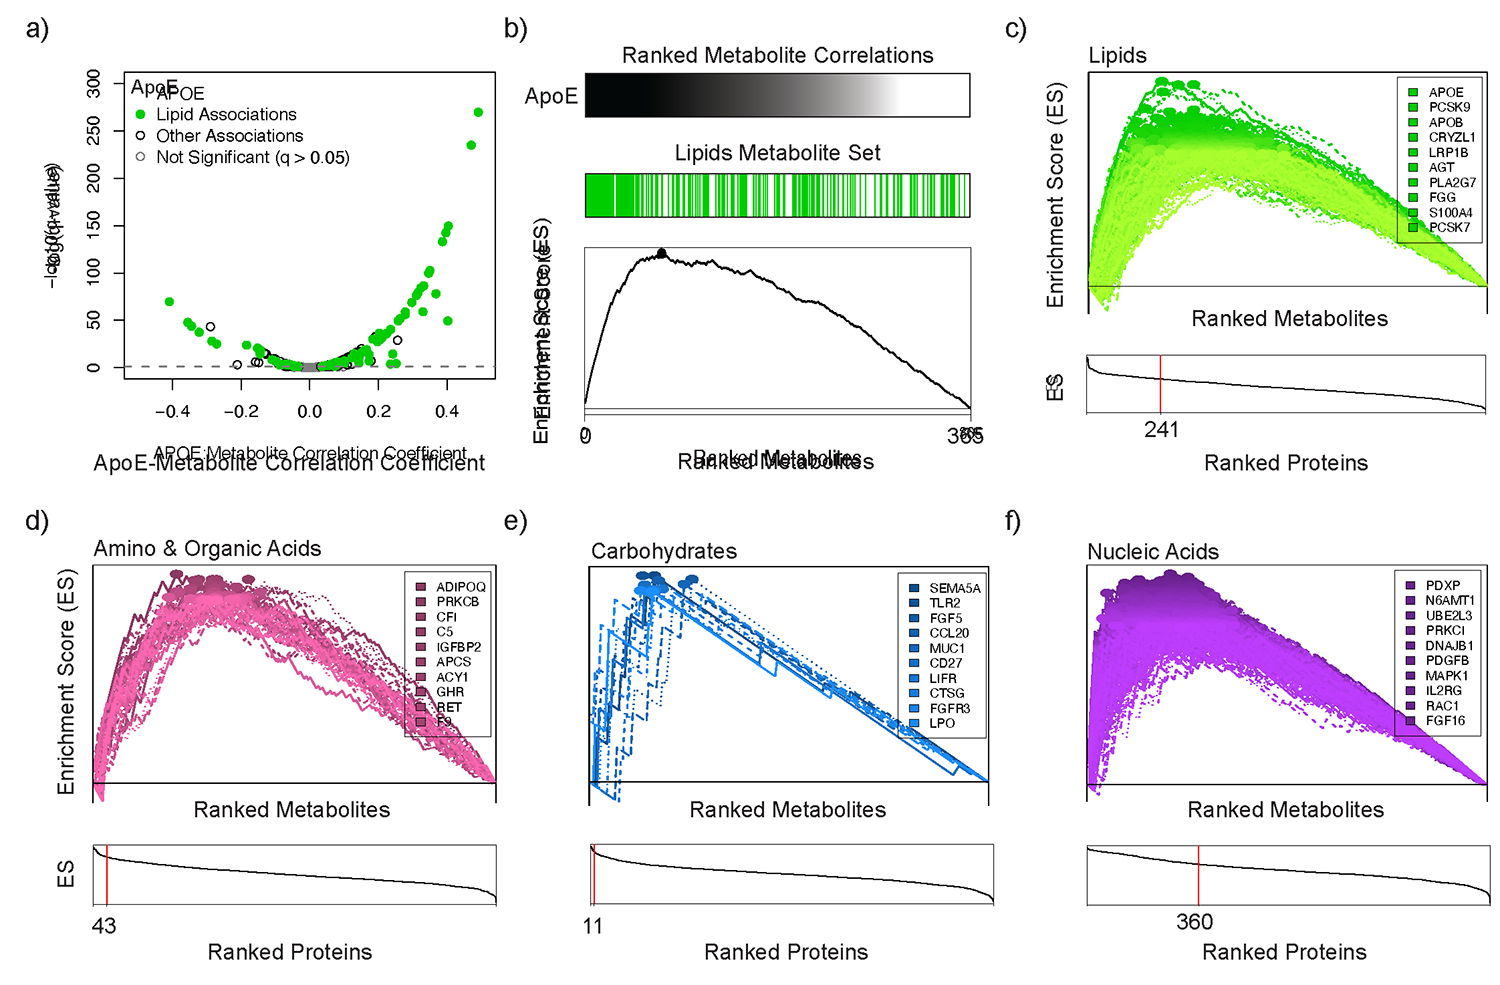
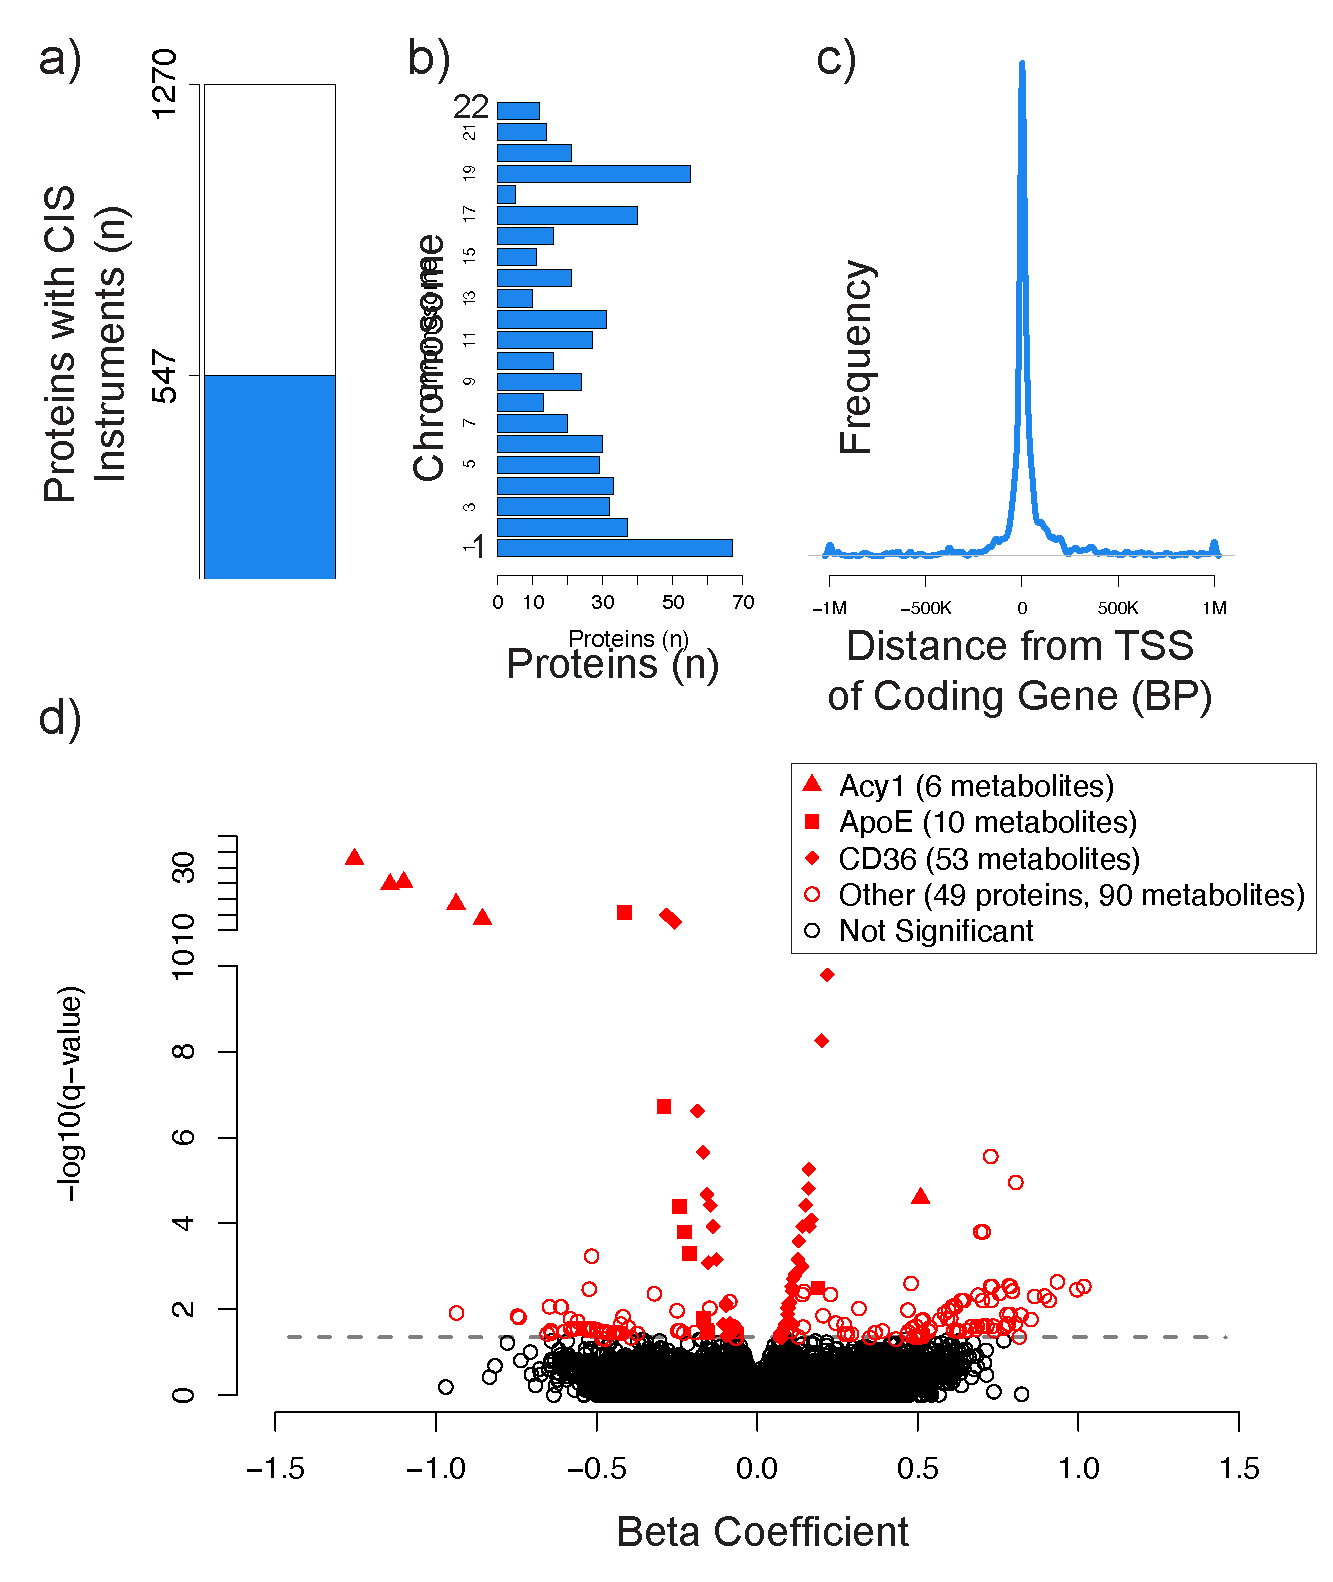
Although many novel gene-metabolite and gene-protein associations have been identified using high-throughput biochemical profiling, systematic studies that leverage human genetics to illuminate causal relationships between circulating proteins and metabolites are lacking. Here, we performed protein-metabolite association studies in 3,626 plasma samples from three human cohorts. We detected 171,800 significant protein-metabolite pairwise correlations between 1,265 proteins and 365 metabolites, including established relationships in metabolic and signaling pathways such as the protein thyroxine-binding globulin and the metabolite thyroxine, as well as thousands of new findings. In Mendelian randomization (MR) analyses, we identified putative causal protein-to-metabolite associations. We experimentally validated top MR associations in proof-of-concept plasma metabolomics studies in three murine knockout strains of key protein regulators. These analyses identified previously unrecognized associations between bioactive proteins and metabolites in human plasma. We provide publicly available data to be leveraged for studies in human metabolism and disease.
Keywords: GWAS; functional genomics; genome-wide association study; genomics; metabolomics; multi-omics; pathway discovery; proteomics.
Copyright © 2023. Published by Elsevier Inc.
Conflict of interest statement
Declaration of interests M.D.B. reports investigator-initiated grants from Amgen and Boehringer-Ingelheim. P.N. reports investigator-initiated grants from Amgen, Apple, AstraZeneca, Boston Scientific, and Novartis and personal fees from Apple, AstraZeneca, Blackstone Life Sciences, Foresite Labs, Novartis, Roche/Genentech; is a co-founder of TenSixteen Bio; is a shareholder of geneXwell, TenSixteen Bio, and Vertex; is a scientific advisory board member of geneXwell and TenSixteen Bio; and reports spousal employment at Vertex, all unrelated to the present work.
Figures
References
-
- Gieger C, Geistlinger L, Altmaier E, Hrabé de Angelis M, Kronenberg F, Meitinger T, Mewes HW, Wichmann HE, Weinberger KM, Adamski J, et al. (2008). Genetics meets metabolomics: a genome-wide association study of metabolite profiles in human serum. PLoS Genet 4, e1000282. 10.1371/journal.pgen.1000282. - DOI - PMC - PubMed
Publication types
MeSH terms
Grants and funding
- HHSN268201100037C/HL/NHLBI NIH HHS/United States
- N01 HC095167/HL/NHLBI NIH HHS/United States
- U24 DK112340/DK/NIDDK NIH HHS/United States
- HHSN268201100002I/HL/NHLBI NIH HHS/United States
- R01 HL142711/HL/NHLBI NIH HHS/United States
- P30 DK063491/DK/NIDDK NIH HHS/United States
- HHSN268201800012I/HL/NHLBI NIH HHS/United States
- HHSN268201800015I/HB/NHLBI NIH HHS/United States
- UL1 TR000040/TR/NCATS NIH HHS/United States
- P30 GM118430/GM/NIGMS NIH HHS/United States
- 75N92020D00002/HL/NHLBI NIH HHS/United States
- HHSN268201500003C/HL/NHLBI NIH HHS/United States
- R01 NR019628/NR/NINR NIH HHS/United States
- F30 LM013320/LM/NLM NIH HHS/United States
- HHSN268201800012C/HL/NHLBI NIH HHS/United States
- N01 HC095161/HL/NHLBI NIH HHS/United States
- 75N92020D00005/HL/NHLBI NIH HHS/United States
- N01 HC095168/HL/NHLBI NIH HHS/United States
- R01 HL120393/HL/NHLBI NIH HHS/United States
- U54 HG003067/HG/NHGRI NIH HHS/United States
- R01 HL047327/HL/NHLBI NIH HHS/United States
- UL1 TR001079/TR/NCATS NIH HHS/United States
- N01 HC095169/HL/NHLBI NIH HHS/United States
- R01 HL047323/HL/NHLBI NIH HHS/United States
- HHSN268201800014I/HB/NHLBI NIH HHS/United States
- K08 HL161445/HL/NHLBI NIH HHS/United States
- 75N92020D00001/HL/NHLBI NIH HHS/United States
- U01 HL120393/HL/NHLBI NIH HHS/United States
- R01 DK081572/DK/NIDDK NIH HHS/United States
- HHSN268201800014C/HL/NHLBI NIH HHS/United States
- N01 HC095159/HL/NHLBI NIH HHS/United States
- 75N92020D00003/HL/NHLBI NIH HHS/United States
- HHSN268201800001C/HL/NHLBI NIH HHS/United States
- HHSN268201800013I/MD/NIMHD NIH HHS/United States
- UL1 TR001420/TR/NCATS NIH HHS/United States
- 75N92020D00004/HL/NHLBI NIH HHS/United States
- 75N92020D00007/HL/NHLBI NIH HHS/United States
- N01 HC095163/HL/NHLBI NIH HHS/United States
- HHSN268201800011C/HL/NHLBI NIH HHS/United States
- K99 HG012956/HG/NHGRI NIH HHS/United States
- R01 HL133870/HL/NHLBI NIH HHS/United States
- HHSN268201500003I/HL/NHLBI NIH HHS/United States
- N01 HC095166/HL/NHLBI NIH HHS/United States
- HHSN268201800010I/HB/NHLBI NIH HHS/United States
- R01 HL047317/HL/NHLBI NIH HHS/United States
- 75N92020D00006/HL/NHLBI NIH HHS/United States
- R01 HL117626/HL/NHLBI NIH HHS/United States
- N01 HC095162/HL/NHLBI NIH HHS/United States
- UL1 TR001881/TR/NCATS NIH HHS/United States
- HHSN268201800011I/HB/NHLBI NIH HHS/United States
- N01 HC095165/HL/NHLBI NIH HHS/United States
- N01 HC095164/HL/NHLBI NIH HHS/United States
- K23 DK127073/DK/NIDDK NIH HHS/United States
- R01 HL146462/HL/NHLBI NIH HHS/United States
- K08 HL145095/HL/NHLBI NIH HHS/United States
- HHSN268201000001I/HL/NHLBI NIH HHS/United States
- R01 HL045670/HL/NHLBI NIH HHS/United States
- N01 HC095160/HL/NHLBI NIH HHS/United States
LinkOut - more resources
Full Text Sources
Molecular Biology Databases
