Review
. 2023 Aug;20(205):20230232.
doi: 10.1098/rsif.2023.0232. Epub 2023 Aug 16.

Conservation tools: the next generation of engineering-biology collaborations

Affiliations
Review

Conservation tools: the next generation of engineering-biology collaborations

Andrew K Schulz et al. J R Soc Interface. 2023 Aug.

Abstract

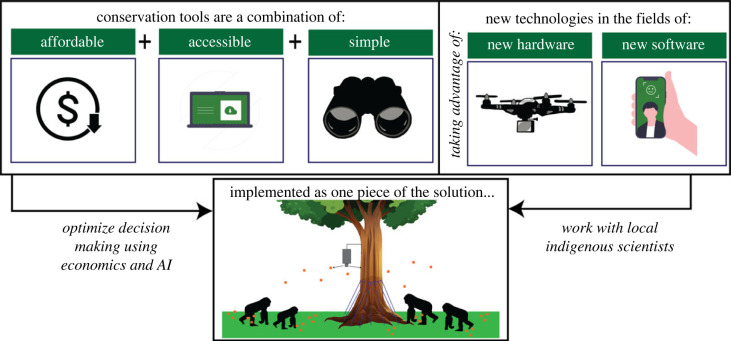
The recent increase in public and academic interest in preserving biodiversity has led to the growth of the field of conservation technology. This field involves designing and constructing tools that use technology to aid in the conservation of wildlife. In this review, we present five case studies and infer a framework for designing conservation tools (CT) based on human-wildlife interaction. Successful CT range in complexity from cat collars to machine learning and game theory methodologies and do not require technological expertise to contribute to conservation tool creation. Our goal is to introduce researchers to the field of conservation technology and provide references for guiding the next generation of conservation technologists. Conservation technology not only has the potential to benefit biodiversity but also has broader impacts on fields such as sustainability and environmental protection. By using innovative technologies to address conservation challenges, we can find more effective and efficient solutions to protect and preserve our planet's resources.

Keywords: AI4Good; Tech4Wildlife; conservation tech; human-centred design.


Conflict of interest statement

We declare we have no competing interests.

Figures

Figure 1.
Figure 1.
Visual abstract displaying the conservation tool framework discussed in this piece. Silhouettes created by Gabriela Palomo-Munoz and Undraw.co.
Figure 2.
Figure 2.
(a) AudioMoth, (b) open source printed circuit board that Open Acoustic Devices (https://www.openacousticdevices.info/) included on the website, (c) open source code for controlling and interpreting data from the AudioMoth via GitHub, (d) online and app-based user-interface for AudioMoth users. Images were taken from the Audio Moth website with permission.
Figure 3.
Figure 3.
Basic camera trap set-up. (a) A camouflaged camera trap is often placed on a tree or a pole. (b) Camera trap model. It is equipped with a motion-triggering sensor, a digital camera and a memory card. When an animal passes in the region of interest, the camera captures photos/video at a specified frame rate of the animal. (c) The figure was made using a dataset from LilaBC [81] and images from Flickr.
Figure 4.
Figure 4.
Sonar camera arrangement: here are some diagrams of the camera deployment. On the left, you can see the camera shooting out multiple acoustic sonar beams—they are used to pick up fish in high resolution. The closer the fish are to the camera, the higher their resolution is. In the top right, you can see how these sonar cameras are placed to ‘see’ all areas where the salmon might swim. There are two sonar cameras—the one with the red triangle only captures one field of view; the one with the three narrow triangles oscillates between capturing three different strata (20 min at one, 20 min at the second, 20 min at the third). The bottom right image shows what these three strata images look like when combined. The white boxes are the annotated fish swimming through the stream. Images have been provided from the Alaska Department of Fish and Game and Caltech [86].
Figure 5.
Figure 5.
Using game theory and optimization for conservation practices. (a) Data mapping of a conservation issue to determine which states' conservation funding is most important. (b) Raw map of the USA. (c) Overlapped image of the clustering depicted in (a) with the raw map of the USA. (d) Data-interpreted map displaying large arrows in the states where the most conservation is needed with smaller arrows (in light green) displaying states where clustering is beginning. Images made using DataWrapper.
Figure 6.
Figure 6.
Process that goes into designing and using technology to develop new CT. Bolded terms are principle design components of conservation tool creation.

References

    1. Berger-Tal O, Lahoz-Monfort JJ. 2018. Conservation technology: the next generation. Conserv. Lett. 11, e12458. (10.1111/conl.12458) - DOI
    1. Aucone E, Kirchgeorg S, Valentini A, Pellissier L, Deiner K, Mintchev S. 2023. Drone-assisted collection of environmental DNA from tree branches for biodiversity monitoring. Sci. Rob. 8, eadd5762. (10.1126/scirobotics.add5762) - DOI - PubMed
    1. Schad L, Fischer J. 2022. Opportunities and risks in the use of drones for studying animal behaviour. Methods Ecol. Evol. 00, 1-9. (10.1111/2041-210X.13922) - DOI
    1. Zwerts JA, et al. 2021. Methods for wildlife monitoring in tropical forests: comparing human observations, camera traps, and passive acoustic sensors. Conserv. Sci. Practice 3, e568. (10.1111/csp2.568) - DOI
    1. Green AM, Chynoweth MW, Şekercioğlu Ç. 2020. Spatially explicit capture-recapture through camera trapping: a review of benchmark analyses for wildlife density estimation. Front. Ecol. Evol. 8, 473. (10.3389/fevo.2020.563477) - DOI

Publication types

LinkOut - more resources