Investigating the impact of fluid status on the ultrasound assessment of muscle quantity and quality in the diagnosis of sarcopenia - a multidimensional cross-sectional study
- PMID: 37582710
- PMCID: PMC10428636
- DOI: 10.1186/s12877-023-04177-6
Investigating the impact of fluid status on the ultrasound assessment of muscle quantity and quality in the diagnosis of sarcopenia - a multidimensional cross-sectional study
Abstract
Background: Sarcopenia is a clinical manifestation of adverse ageing, characterised by progressive loss of muscle mass and function. Diagnosis requires assessment of muscle quantity and quality; ultrasound represents an emerging tool for this. However, ultrasound muscle assessment may be impacted by fluid balance. This is particularly important when assessing for acute sarcopenia in hospitalised patients, where fluid disturbance often occurs. The primary aim of this study was to characterise the impact of fluid status on ultrasound muscle assessment, such that this may be accounted for in sarcopenia diagnostics.
Methods: This Multidimensional Cross-sectional study involved 80 participants, who were inpatients at QEHB, a large UK tertiary centre. Fluid status was evaluated clinically and quantified using Bioelectrical Impedance Analysis (BIA). Muscle quantity was measured using Bilateral Anterior Thigh Thickness (BATT) with Rectus Femoris (RF) echogenicity used to assesses muscle adiposity and hence provide an inverse measure of muscle quality.
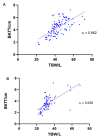
Results: A significant positive correlation was found between fluid status, measured using BIA, and BATT as a measure of muscle quantity, in males (rs = 0.662, p < 0.001) and females (rs = 0.638, p < 0.001). A significant negative correlation was found between fluid status and RF echogenicity (rs=-0.448, p < 0.001).
Conclusions: These findings demonstrate associations between fluid balance and ultrasound assessment of muscle quantity and quality. Given the emerging use of ultrasound muscle assessment in sarcopenia diagnosis, there is a need to account for this in clinical practice. Future research should focus on the development of a corrective equation allowing assessment of muscle quantity and quality which account for changes in fluid status, hence aiding accurate diagnosis of sarcopenia.
Keywords: Bioelectrical Impedance Analysis; Echogenicity; Sarcopenia; Ultrasound muscle assessment.
© 2023. BioMed Central Ltd., part of Springer Nature.
Conflict of interest statement
The authors declare that they have no competing interests.
Figures


Similar articles
-
Phase Angle and Ultrasound Assessment of the Rectus Femoris for Predicting Malnutrition and Sarcopenia in Patients with Esophagogastric Cancer: A Cross-Sectional Pilot Study.Nutrients. 2024 Dec 29;17(1):91. doi: 10.3390/nu17010091. Nutrients. 2024. PMID: 39796524 Free PMC article.
-
Bilateral Anterior Thigh Thickness: A New Diagnostic Tool for the Identification of Low Muscle Mass?J Am Med Dir Assoc. 2019 Oct;20(10):1247-1253.e2. doi: 10.1016/j.jamda.2019.04.005. Epub 2019 Jun 1. J Am Med Dir Assoc. 2019. PMID: 31164257
-
The Diagnostic Value of Ultrasound of the Rectus Femoris for the diagnosis of Sarcopenia in adults: A systematic review.Injury. 2022 Nov;53 Suppl 3:S23-S29. doi: 10.1016/j.injury.2022.06.004. Epub 2022 Jun 15. Injury. 2022. PMID: 35732560
-
The clinical applicability of ultrasound technique for diagnosis of sarcopenia in hemodialysis patients.Clin Nutr. 2021 Mar;40(3):1161-1167. doi: 10.1016/j.clnu.2020.07.025. Epub 2020 Aug 1. Clin Nutr. 2021. PMID: 32798065
-
Evaluation of Appendicular Muscle Mass in Sarcopenia in Older Adults Using Ultrasonography: A Systematic Review and Meta-Analysis.Gerontology. 2022;68(10):1174-1198. doi: 10.1159/000525758. Epub 2022 Jul 25. Gerontology. 2022. PMID: 35878591 Free PMC article.
Cited by
-
Obstacles to the Early Diagnosis and Management of Sarcopenia: Current Perspectives.Clin Interv Aging. 2024 Feb 20;19:323-332. doi: 10.2147/CIA.S438144. eCollection 2024. Clin Interv Aging. 2024. PMID: 38404480 Free PMC article. Review.
-
Artificial Intelligence-Assisted Muscular Ultrasonography for Assessing Inflammation and Muscle Mass in Patients at Risk of Malnutrition.Nutrients. 2025 May 9;17(10):1620. doi: 10.3390/nu17101620. Nutrients. 2025. PMID: 40431361 Free PMC article.
-
Ultrasound Evaluation of Sarcopenia in Patients with Hepatocellular Carcinoma: A Faster and Easier Way to Detect Patients at Risk.Diagnostics (Basel). 2024 Feb 8;14(4):371. doi: 10.3390/diagnostics14040371. Diagnostics (Basel). 2024. PMID: 38396410 Free PMC article. Review.
-
A sarcopenia prediction model based on the calf maximum muscle circumference measured by ultrasound.BMC Geriatr. 2025 Feb 5;25(1):81. doi: 10.1186/s12877-025-05733-y. BMC Geriatr. 2025. PMID: 39910436 Free PMC article.
-
Phase Angle and Ultrasound Assessment of the Rectus Femoris for Predicting Malnutrition and Sarcopenia in Patients with Esophagogastric Cancer: A Cross-Sectional Pilot Study.Nutrients. 2024 Dec 29;17(1):91. doi: 10.3390/nu17010091. Nutrients. 2024. PMID: 39796524 Free PMC article.
References
Publication types
MeSH terms
Grants and funding
LinkOut - more resources
Full Text Sources

