

Identification of adipose tissue transcriptomic memory of anorexia nervosa
- PMID: 37582711
- PMCID: PMC10428576
- DOI: 10.1186/s10020-023-00705-7
Identification of adipose tissue transcriptomic memory of anorexia nervosa
Abstract
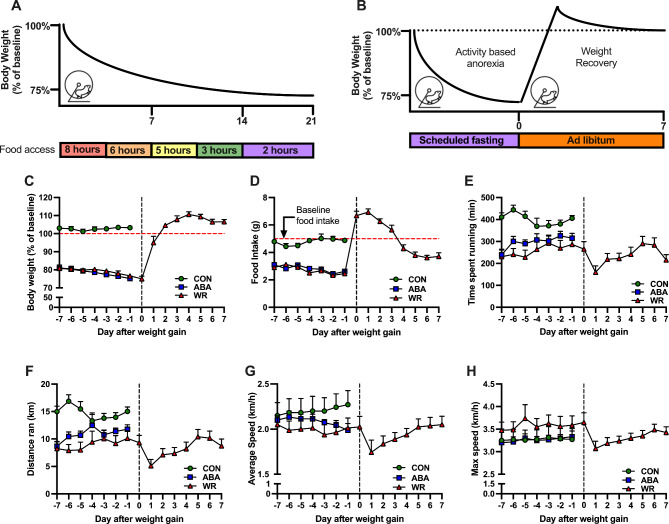
Background: Anorexia nervosa (AN) is a complex debilitating disease characterized by intense fear of weight gain and excessive exercise. It is the deadliest of any psychiatric disorder with a high rate of recidivism, yet its pathophysiology is unclear. The Activity-Based Anorexia (ABA) paradigm is a widely accepted mouse model of AN that recapitulates hypophagia and hyperactivity despite reduced body weight, however, not the chronicity.
Methods: Here, we modified the prototypical ABA paradigm to increase the time to lose 25% of baseline body weight from less than 7 days to more than 2 weeks. We used this paradigm to identify persistently altered genes after weight restoration that represent a transcriptomic memory of under-nutrition and may contribute to AN relapse using RNA sequencing. We focused on adipose tissue as it was identified as a major location of transcriptomic memory of over-nutririon.
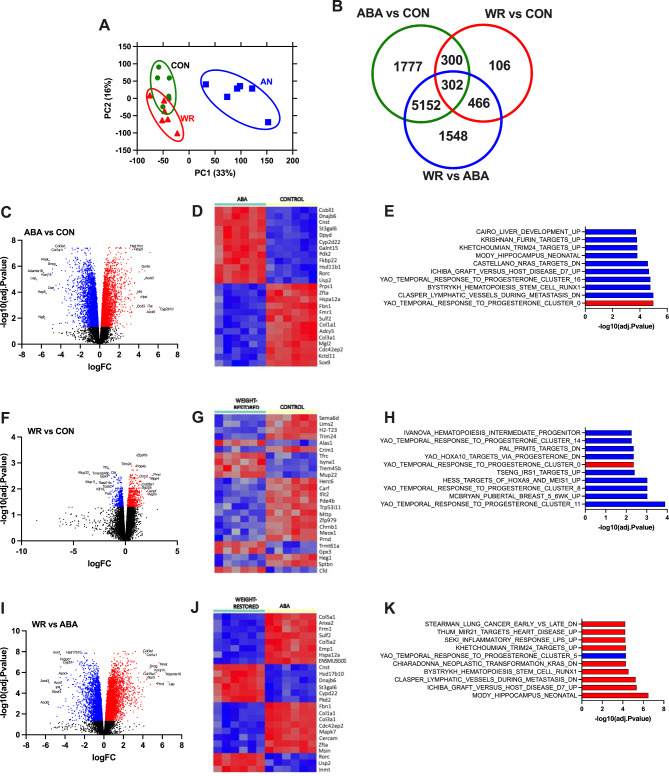
Results: We identified 300 dysregulated genes that were refractory to weight restroration after ABA, including Calm2 and Vps13d, which could be potential global regulators of transcriptomic memory in both chronic over- and under-nutrition.
Conclusion: We demonstrated the presence of peristent changes in the adipose tissue transcriptome in the ABA mice after weight restoration. Despite being on the opposite spectrum of weight perturbations, majority of the transcriptomic memory genes of under- and over-nutrition did not overlap, suggestive of the different mechanisms involved in these extreme nutritional statuses.
Keywords: Adipose tissue; Anorexia nervosa; Calm2; Transcriptomic memory; Undernutrition; Vps13d.
© 2023. The Feinstein Institute for Medical Research.
Conflict of interest statement
The authors have nothing to disclose.
Figures
Similar articles
-
Activity-Based Anorexia Induces Browning of Adipose Tissue Independent of Hypothalamic AMPK.Front Endocrinol (Lausanne). 2021 Jun 2;12:669980. doi: 10.3389/fendo.2021.669980. eCollection 2021. Front Endocrinol (Lausanne). 2021. PMID: 34149618 Free PMC article.
-
Timing matters: The contribution of running during different periods of the light/dark cycle to susceptibility to activity-based anorexia in rats.Physiol Behav. 2023 Nov 1;271:114349. doi: 10.1016/j.physbeh.2023.114349. Epub 2023 Sep 12. Physiol Behav. 2023. PMID: 37709000
-
Olanzapine, but not fluoxetine, treatment increases survival in activity-based anorexia in mice.Neuropsychopharmacology. 2012 Jun;37(7):1620-31. doi: 10.1038/npp.2012.7. Epub 2012 Mar 7. Neuropsychopharmacology. 2012. PMID: 22395732 Free PMC article.
-
[Hyperactivity and anorexia nervosa: behavioural and biological perspective].Encephale. 2004 Sep-Oct;30(5):492-9. doi: 10.1016/s0013-7006(04)95463-2. Encephale. 2004. PMID: 15627053 Review. French.
-
Rethinking the Approach to Preclinical Models of Anorexia Nervosa.Curr Psychiatry Rep. 2022 Jan;24(1):71-76. doi: 10.1007/s11920-022-01319-2. Epub 2022 Feb 11. Curr Psychiatry Rep. 2022. PMID: 35147866 Free PMC article. Review.
Cited by
-
Father's adolescent body silhouette is associated with offspring asthma, lung function and BMI through DNA methylation.Commun Biol. 2025 May 24;8(1):796. doi: 10.1038/s42003-025-08121-9. Commun Biol. 2025. PMID: 40410506 Free PMC article.
-
The attenuation of activity-based anorexia by obese adipose tissue transplant is AgRP neuron-dependent.bioRxiv [Preprint]. 2024 Apr 27:2024.04.23.590824. doi: 10.1101/2024.04.23.590824. bioRxiv. 2024. PMID: 38712190 Free PMC article. Preprint.
-
Postprandial Dysmetabolism and Its Medical Implications.Life (Basel). 2023 Dec 10;13(12):2317. doi: 10.3390/life13122317. Life (Basel). 2023. PMID: 38137918 Free PMC article. Review.
-
Investigating the Contribution of Coding Variants in Alcohol Use Disorder Using Whole-Exome Sequencing Across Ancestries.Biol Psychiatry. 2025 Jul 1;98(1):46-55. doi: 10.1016/j.biopsych.2025.01.020. Epub 2025 Jan 30. Biol Psychiatry. 2025. PMID: 39892688
References
-
- Abete I, Parra MD, Zulet MA, Martinez JA. Different dietary strategies for weight loss in obesity: role of energy and macronutrient content. Nutr Res Rev. 2006;19(1):5–17. - PubMed
-
- Balthasar N, Coppari R, McMinn J, Liu SM, Lee CE, Tang V, et al. Leptin receptor signaling in POMC neurons is required for normal body weight homeostasis. Neuron. 2004;42(6):983–91. - PubMed
Publication types
MeSH terms
Grants and funding
LinkOut - more resources
Full Text Sources
Medical
Molecular Biology Databases
