

Bioinformatics analysis of the immune cell infiltration characteristics and correlation with crucial diagnostic markers in pulmonary arterial hypertension
- PMID: 37582718
- PMCID: PMC10428559
- DOI: 10.1186/s12890-023-02584-4
Bioinformatics analysis of the immune cell infiltration characteristics and correlation with crucial diagnostic markers in pulmonary arterial hypertension
Abstract
Background: Pulmonary arterial hypertension (PAH) is a pathophysiological syndrome, characterized by pulmonary vascular remodeling. Immunity and inflammation are progressively recognized properties of PAH, which are crucial for the initiation and maintenance of pulmonary vascular remodeling. This study explored immune cell infiltration characteristics and potential biomarkers of PAH using comprehensive bioinformatics analysis.
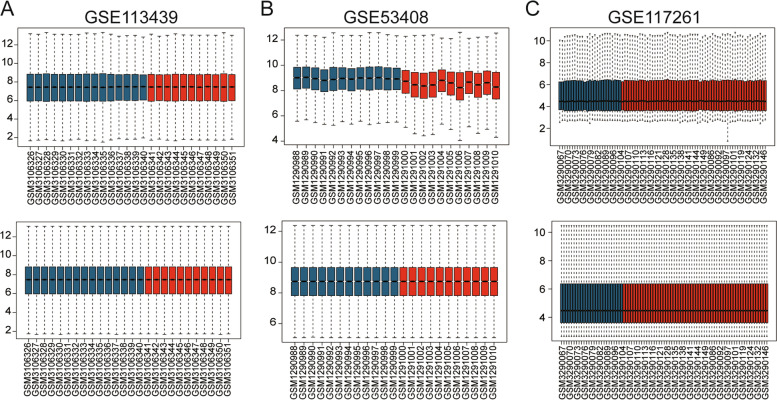
Methods: Microarray data of GSE117261, GSE113439 and GSE53408 datasets were downloaded from Gene Expression Omnibus database. The differentially expressed genes (DEGs) were identified in GSE117261 dataset. The proportions of infiltrated immune cells were evaluated by CIBERSORT algorithm. Feature genes of PAH were selected by least absolute shrinkage and selection operator (LASSO) regression analysis and validated by fivefold cross-validation, random forest and logistic regression. The GSE113439 and GSE53408 datasets were used as validation sets and logistic regression and receiver operating characteristic (ROC) curve analysis were performed to evaluate the prediction value of PAH. The PAH-associated module was identified by weighted gene association network analysis (WGCNA). The intersection of genes in the modules screened and DEGs was used to construct protein-protein interaction (PPI) network and the core genes were selected. After the intersection of feature genes and core genes, the hub genes were identified. The correlation between hub genes and immune cell infiltration was analyzed by Pearson correlation analysis. The expression level of LTBP1 in the lungs of monocrotaline-induced PAH rats was determined by Western blotting. The localization of LTBP1 and CD4 in lungs of PAH was assayed by immunofluorescence.
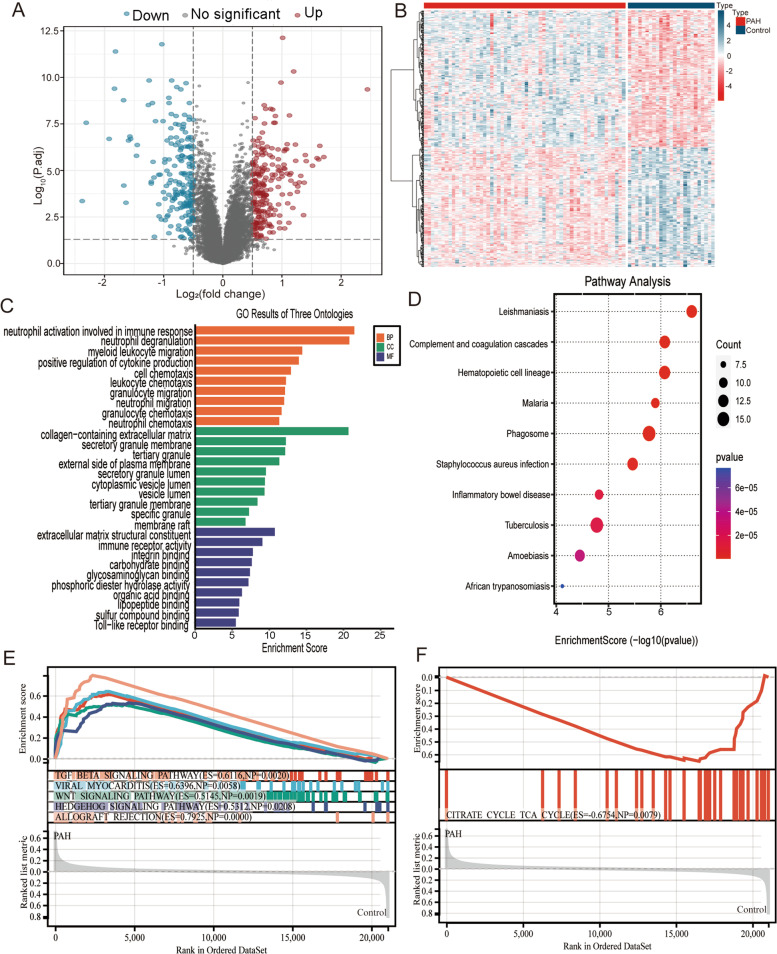
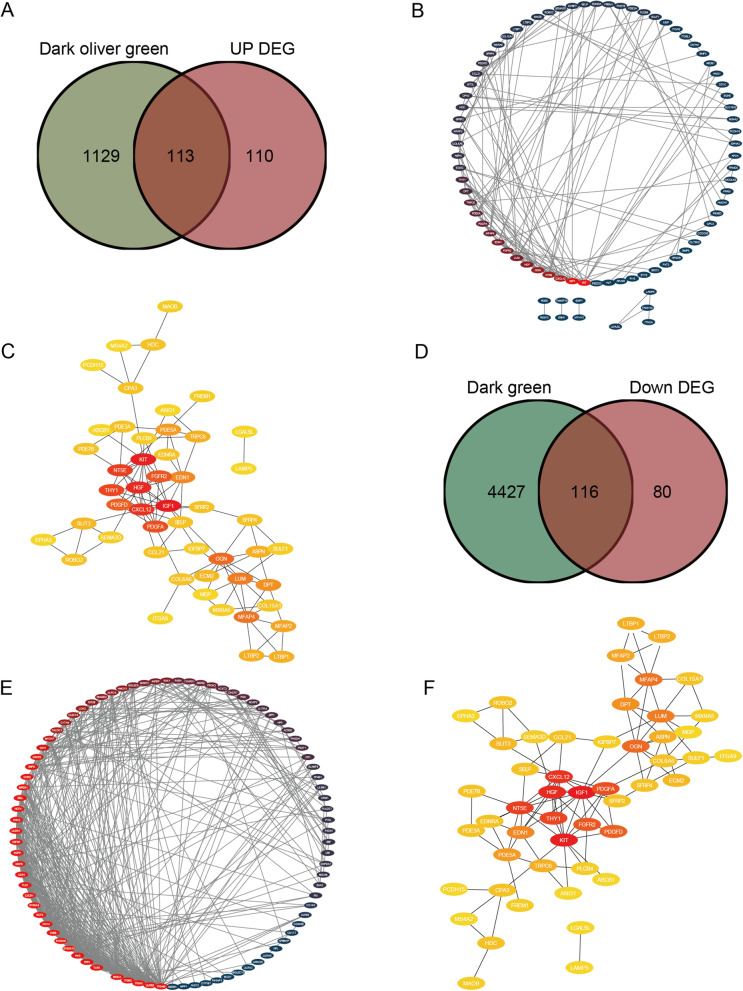
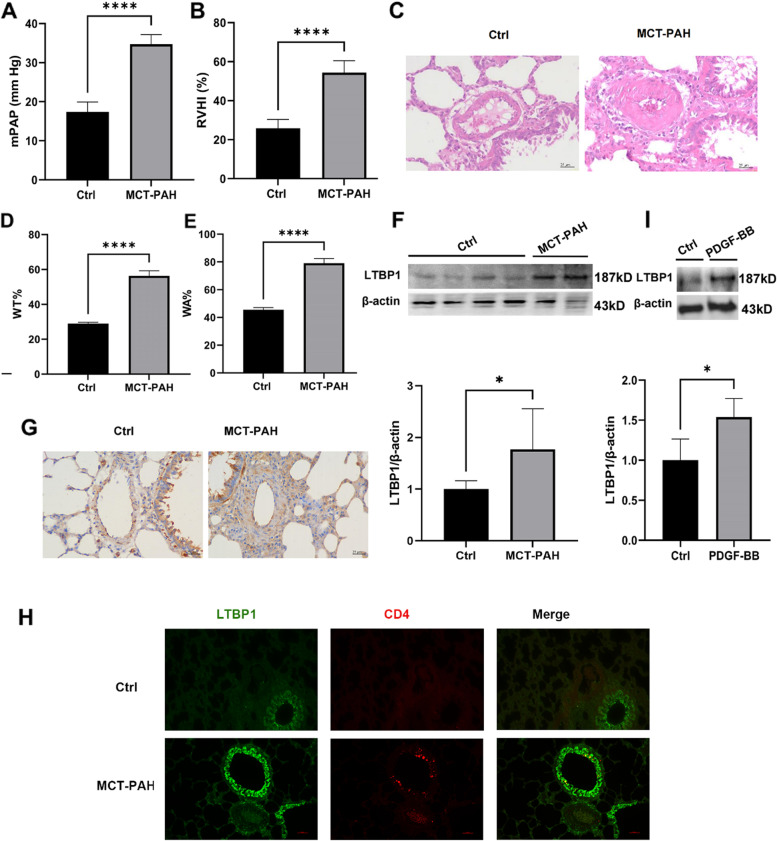
Results: A total of 419 DEGs were identified, including 223 upregulated genes and 196 downregulated genes. Functional enrichment analysis revealed that a significant enrichment in inflammation, immune response, and transforming growth factor β (TGFβ) signaling pathway. CIBERSORT analysis showed that ten significantly different types of immune cells were identified between PAH and control. Resting memory CD4+ T cells, CD8+ T cells, γδ T cells, M1 macrophages, and resting mast cells in the lungs of PAH patients were significantly higher than control. Seventeen feature genes were identified by LASSO regression for PAH prediction. WGCNA identified 15 co-expression modules. PPI network was constructed and 100 core genes were obtained. Complement C3b/C4b receptor 1 (CR1), thioredoxin reductase 1 (TXNRD1), latent TGFβ binding protein 1 (LTBP1), and toll-like receptor 1 (TLR1) were identified as hub genes and LTBP1 has the highest diagnostic efficacy for PAH (AUC = 0.968). Pearson correlation analysis showed that LTBP1 was positively correlated with resting memory CD4+ T cells, but negatively correlated with monocytes and neutrophils. Western blotting showed that the protein level of LTBP1 was increased in the lungs of monocrotaline-induced PAH rats. Immunofluorescence of lung tissues from rats with PAH showed increased expression of LTBP1 in pulmonary arteries as compared to control and LTBP1 was partly colocalized with CD4+ cells in the lungs.
Conclusion: LTBP1 was correlated with immune cell infiltration and identified as the critical diagnostic maker for PAH.
Keywords: Bioinformatics analysis; Hub gene; Immune infiltration; LTBP1; Pulmonary arterial hypertension.
© 2023. BioMed Central Ltd., part of Springer Nature.
Conflict of interest statement
The authors declare no competing interests.
Figures


Similar articles
-
Screening of key biomarkers and immune infiltration in Pulmonary Arterial Hypertension via integrated bioinformatics analysis.Bioengineered. 2021 Dec;12(1):2576-2591. doi: 10.1080/21655979.2021.1936816. Bioengineered. 2021. PMID: 34233597 Free PMC article.
-
Identification of TFRC as a biomarker for pulmonary arterial hypertension based on bioinformatics and experimental verification.Respir Res. 2024 Aug 3;25(1):296. doi: 10.1186/s12931-024-02928-6. Respir Res. 2024. PMID: 39097701 Free PMC article.
-
Identification of Potential Biomarkers and Immune Infiltration Characteristics in Idiopathic Pulmonary Arterial Hypertension Using Bioinformatics Analysis.Front Cardiovasc Med. 2021 Feb 1;8:624714. doi: 10.3389/fcvm.2021.624714. eCollection 2021. Front Cardiovasc Med. 2021. PMID: 33598484 Free PMC article.
-
Identification of oxidative stress-related diagnostic markers and immune infiltration features for idiopathic pulmonary fibrosis by bibliometrics and bioinformatics.Front Med (Lausanne). 2024 Aug 6;11:1356825. doi: 10.3389/fmed.2024.1356825. eCollection 2024. Front Med (Lausanne). 2024. PMID: 39165378 Free PMC article. Review.
-
Bioinformatics and machine learning approaches reveal key genes and underlying molecular mechanisms of atherosclerosis: A review.Medicine (Baltimore). 2024 Aug 2;103(31):e38744. doi: 10.1097/MD.0000000000038744. Medicine (Baltimore). 2024. PMID: 39093811 Free PMC article. Review.
Cited by
-
Genetically determined gut microbiota associates with pulmonary arterial hypertension: a Mendelian randomization study.BMC Pulm Med. 2024 May 14;24(1):235. doi: 10.1186/s12890-024-02877-2. BMC Pulm Med. 2024. PMID: 38745167 Free PMC article.
-
Integrated bioinformatics analysis and experimental validation on malignant progression and immune cell infiltration of LTBP2 in gliomas.BMC Cancer. 2024 Oct 10;24(1):1252. doi: 10.1186/s12885-024-12976-2. BMC Cancer. 2024. PMID: 39390437 Free PMC article.
References
-
- Boucly A, Savale L, Jaïs X, Bauer F, Bergot E, Bertoletti L, Beurnier A, Bourdin A, Bouvaist H, Bulifon S, et al. Association between initial treatment strategy and long-term survival in pulmonary arterial hypertension. Am J Respir Crit Care Med. 2021;204(7):842–854. doi: 10.1164/rccm.202009-3698OC. - DOI - PubMed
MeSH terms
Substances
Grants and funding
LinkOut - more resources
Full Text Sources
Research Materials
Miscellaneous
