. 2023 Aug 15;14(1):4906.
doi: 10.1038/s41467-023-40469-6.

mRNA 3'UTR lengthening by alternative polyadenylation attenuates inflammatory responses and correlates with virulence of Influenza A virus

Affiliations

mRNA 3'UTR lengthening by alternative polyadenylation attenuates inflammatory responses and correlates with virulence of Influenza A virus

Valter Bergant et al. Nat Commun. .

Abstract

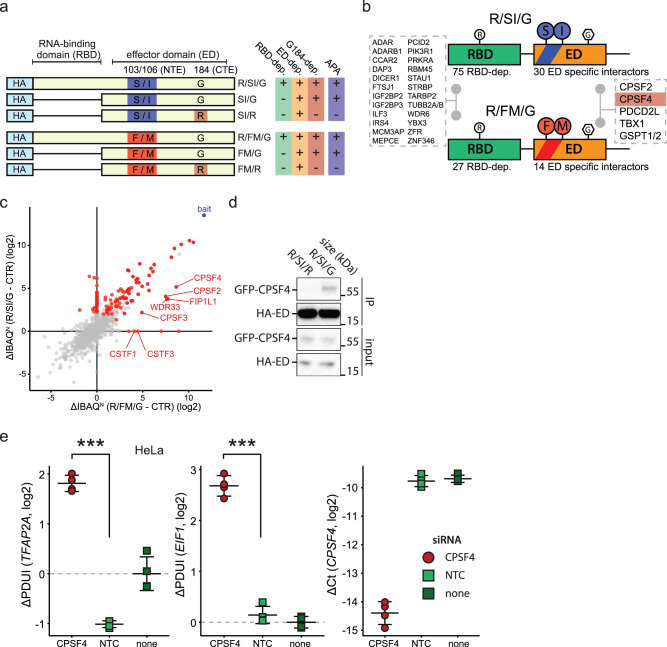
Changes of mRNA 3'UTRs by alternative polyadenylation (APA) have been associated to numerous pathologies, but the mechanisms and consequences often remain enigmatic. By combining transcriptomics, proteomics and recombinant viruses we show that all tested strains of IAV, including A/PR/8/34(H1N1) (PR8) and A/Cal/07/2009 (H1N1) (Cal09), cause APA. We mapped the effect to the highly conserved glycine residue at position 184 (G184) of the viral non-structural protein 1 (NS1). Unbiased mass spectrometry-based analyses indicate that NS1 causes APA by perturbing the function of CPSF4 and that this function is unrelated to virus-induced transcriptional shutoff. Accordingly, IAV strain PR8, expressing an NS1 variant with weak CPSF binding, does not induce host shutoff but only APA. However, recombinant IAV (PR8) expressing NS1(G184R) lacks binding to CPSF4 and thereby also the ability to cause APA. Functionally, the impaired ability to induce APA leads to an increased inflammatory cytokine production and an attenuated phenotype in a mouse infection model. Investigating diverse viral infection models showed that APA induction is a frequent ability of many pathogens. Collectively, we propose that targeting of the CPSF complex, leading to widespread alternative polyadenylation of host transcripts, constitutes a general immunevasion mechanism employed by a variety of pathogenic viruses.


Conflict of interest statement

The authors declare no competing interests.

Figures

Fig. 1
Fig. 1. Influenza A causes widespread alternative polyadenylation of host transcripts.
a Overview of transcriptional and post-transcriptional deregulation of host-transcripts, induced by infection of A549 cells with IAV strain PR8 for 24 h at MOI 3. Numbers of significant events are shown; related data is presented in Supplementary Fig. 1a, b. b Schematic read coverage across an exemplar alternatively polyadenylated human gene EIF1 with location of RT-qPCR primers used for quantification of APA shown. Calculation of PDUI and ΔPDUI from Ct values is also depicted. Further examples are shown in Supplementary Fig. 1d, e. c A549 cells were infected with indicated strains of IAV at MOI 3 or left uninfected (mock) and harvested at indicated times post infection. PDUI and ΔPDUI are shown as a measure of APA alongside means for 2 separately infected wells. Dashed line corresponds to uninfected polyadenylation status. Additional related data is presented in Supplementary Fig. 2a. The presented data is representative of 2 independent repeats. d A549 cells were infected with indicated strains of IAV at MOI 3 or left uninfected for 24 h and subjected to nucleocytoplasmic fractionation (Supplementary Fig. 2b–d). Fractioned RNA was reverse transcribed using (dT)18 and used for RT-qPCR based quantification of APA. PDUI as a measure of APA status is shown alongside mean +/− sd for 3 separately infected wells and is representative of 2 independent repeats. Statistics refer to comparisons between indicated samples and fraction-matched mock controls. e Human tracheobronchial airway epithelial cells (hTAECs) were infected with indicated strains of IAV (10e5 pfu (PR8) or 10e5 TCID50 (Cal09) per 24-well) for 72 h and used for RT-qPCR based quantification of APA of selected genes alongside measurement of NS1 mRNA levels. ΔPDUI as a measure of APA status is shown alongside mean +/− sd for 3 (4 mock) separately infected wells. Statistics refer to comparisons between indicated samples and gene-matched mock controls. Statistics were calculated using two-sided equal variance t-test. ΔCt values were calculated relative to the housekeeping gene RPLP0. *p < 0.05, **p < 0.01, ***p < 0.001. pUTR proximal UTR, dUTR distal UTR, fraction T total, C cytoplasmic, N nuclear.
Fig. 2
Fig. 2. Alternative polyadenylation of host transcripts is mediated by viral protein NS1 irrespective of amino-acids at positions 103/106 and abrogated by G184R mutation.
a Depicted viral proteins were transiently expressed in HEK293T cells via expression plasmid transfection (or transfection reagent only, vehicle), followed by quantification of APA of selected genes. ΔPDUI as a measure of APA status (left) and transgene transcript abundances (right) for 2 separately transfected wells are shown. b Schematic representation of previously described naming convention used in respect to NS1 mutants used in this study. c Transient expression of full length NS1 (NS1-wt, aa 1–230), NS1 effector domain (ED, aa 74–230), NS1 RNA-binding domain (RBD, aa 1–113) or transfection reagent only (vehicle) via expression plasmid transfection, followed by quantification of expression levels and APA of selected genes. ΔPDUI as a measure of APA status and NS1 transcript abundances are shown alongside mean for 2 separately transfected wells. d Amino acid sequences of IAV NS1 proteins (N = 35,326, NCBI Influenza virus database)), were aligned using Clustal Omega algorithm. Normalized entropy (22-letter) as a measure of positional variation at indicated positions is depicted alongside sequence logos. e Indicated NS1 mutant proteins or controls (CTR – Thogotovirus M, vehicle – transfection reagent only) were transiently expressed in HEK293T cells via expression plasmid transfection, followed by quantification of transgene expression levels and APA of selected genes. ΔPDUI as a measure of APA status and transgene transcript abundances are shown alongside mean +/− sd for 3 separately transfected wells. Statistics refer to comparisons between indicated samples and gene-matched vehicle controls. f A549 cells were infected with indicated strains of IAV (based on PR8 background, MOI 3) for 24 h, followed by quantification of NS1 expression levels and APA of selected genes. ΔPDUI as a measure of APA status and NS1 transcript abundances are shown alongside mean +/− sd for 4 separately infected wells. Statistics refer to comparisons between indicated samples and gene-matched mock controls. Statistics were calculated using two-sided equal variance t-test. n.s. p > 0.05, *p < 0.05, **p < 0.01, ***p < 0.001. ΔCt values were calculated relative to the housekeeping gene RPLP0.
Fig. 3
Fig. 3. Interaction between NS1 and the CPSF complex is diminished by variation of amino acids at positions 103/106, but only completely abrogated by variation at position 184.
a Schematic representation of HA-tagged constructs used in AP-MS experiments. b Schematic representation of RBD- and ED-dependent interaction partners of NS1 proteins depending on amino acids at positions 103/106. c Normalized IBAQ-based log2 enrichment (ΔIBAQN) of depicted preys in comparison between R/SI/G (y-axis) and R/FG/G (x-axis) with control bait (CTR – ThoV M). Red dots show all significant interactors of the two proteins, with components of CPSF complex further highlighted. Further related data is presented in Supplementary Fig. 3a, b. d Western blot depicting detection of indicated proteins upon immunoprecipitation of HA-tagged R/SI/G or R/SI/R from RNase and DNase treated lysates of cells transiently expressing baits and GFP-tagged CPSF4. Depicted data are representative of 3 independent repeats. e HeLa cells were transfected with siRNA targeting CPSF4, non-targeting control siRNA (NTC) or transfection vehicle only (no-siRNA). 48 h post-transfection, RT-qPCR was used for quantification of expression levels of CPSF4 and APA of selected genes. ΔPDUI as a measure of APA status is shown alongside mean +/− sd for 4 separately processed wells. ΔCt values were calculated relative to the housekeeping gene RPLP0. Statistics were calculated using two-sided equal variance t-test. n.s. p > 0.05, *p < 0.05, **p < 0.01, ***p < 0.001.
Fig. 4
Fig. 4. Amino acid positions 103 and 106 dictate the occurrence of host shutoff effect but not APA.
ag A549 cells were infected with indicated strains of IAV (MOI 3) for 24 h and used for proteome quantification using LC-MS/MS. a 2-dimensional representation of sample similarity, depicted through the use of uniform manifold approximation and projection (UMAP). b Heatmap depicting mean abundances of viral proteins upon infection with indicated viruses. c Plot depicting numbers of significantly up- and down-regulated proteins in comparison between indicated conditions. d Volcano plots showing log2 fold-changes and associated unadjusted p-values between indicated conditions. Statistically significant up- (orange) and down-regulated (blue) proteins (absolute log2 fold-change > 0.75, FDR-adjusted p-value < 0.01) are further highlighted. e Cumulative density function (CDF) of log2 fold-changes (displayed for clarity in limited range between −1.5 and 1.5) in comparison between indicated conditions. Statistical analysis was performed using two-sample one-sided Kolmogorov-Smirnov test comparing log2 fold-changes between individual indicated conditions with mock (e.g. R/SI/G – mock and R/SI/R – mock). f Plots depict scaled densities of log2 fold changes between indicated conditions for proteins belonging to the GO-term defense response to virus (GOBP:0051607). g Plots depict densities of protein changes between indicated conditions for all proteins (gray), proteins encoded by genes included in APA analysis (Supplementary Fig. 1b, Supplementary Data 2) (orange), and protein encoded by genes that are significantly APA in IAV infection (pink).
Fig. 5
Fig. 5. IAV-induced APA of host transcripts inversely correlates with secretion of pro-inflammatory cytokines and interferons.
a C57BL/6J mice were infected with IAV strains R/SI/G or R/SI/R (10e5 pfu) or left uninfected. 3 days post infection we quantified secreted cytokines in BALF (left, Supplementary Data 6) and virus lung titers from lung homogenate supernatant (right). Selected significantly changing cytokines are shown alongside the virus titer; measurements from N = 8 (4 for mock-infection) mice are shown alongside mean +/− sd. Other significantly changing cytokines are shown in Supplementary Fig. 4a. b Mice were treated as in a, with FFPE lung samples used for histopathology evaluation. Representative images from N = 5 animals per condition. c Bronchiolitis and pneumonia scores in samples according to b (N = 5 animals per condition, shown alongside mean +/− sd). d N = 8 mice per condition were infected with indicated IAV strains and their weight followed up to day 9 post infection (mean +/− sd shown). Statistics were performed using logrank test. In a and c, statistics were calculated using two-sided equal variance t-test. n.s. p > 0.05, *p < 0.05, **p < 0.01, ***p < 0.001.
Fig. 6
Fig. 6. APA-deficient IAV strain induced IL-6 secretion is RIG-I and MAVS dependent and can be circumvented by concomitant CPSF4 knock-down.
a Mouse embryonic fibroblasts (MEFs) were infected with indicated strains of IAV at various MOIs (x-axis) for 24 h, followed by quantification of (left) secreted IL-6 by ELISA, IL-6 mRNA (middle) and viral transcripts M and NS1 (right) by RT-qPCR for two separately infected wells. The presented data is representative of 2 independent repeats and shown alongside mean. ΔCt values were calculated relative to the housekeeping gene ACTB. b A549 cells were infected with indicated strains of IAV at MOI 3 for 24 h, followed by quantification of secreted IL-6 by ELISA for three separately infected wells, shown here alongside mean +/− sd. The presented data is representative of 3 independent repeats. c MEFs (3 independent wells) were transfected with shRNA targeting Cpsf4 or Hnrnpc (CTR) 1 day prior to infection with R/SI/R at MOI 3. 24 h post infection, secreted IL-6 was quantified by ELISA (left) and viral transcript M abundance by RT-qPCR, shown here alongside mean +/− sd. Further related data is presented in Supplementary Fig. 4b. The presented data is representative of 2 independent repeats. ΔCt values were calculated relative to the housekeeping gene ACTB. d RIG-I (left), MAVS (middle) and STING (right) KOs were used alongside respective wt controls and either infected with indicated IAV strains (MOI 3) or treated with indicated stimuli (IVT4 in vitro transcript 4, RIG-I ligand, LPS lipopolysaccharide, TLR4 ligand, dsDNA double-stranded DNA, STING ligand). 24-h post infection/treatment, secreted IL-6 was quantified by ELISA for 3 independently processed wells and shown alongside mean +/− sd. The presented data is representative of 2 independent repeats. Statistics were calculated using two-sided equal variance t-test. n.s. p > 0.05, *p < 0.05, **p < 0.01, ***p < 0.001.
Fig. 7
Fig. 7. Host transcriptional and in particular polyadenylation machinery is a common target point of pathogenic viruses.
a A549 cells were infected with indicated viruses at MOI 1 for 24 h, followed by quantification of APA of depicted host transcripts. ΔPDUI as a measure of APA status is shown alongside mean for 2 separately infected wells. Further related data is shown in Supplementary Fig. 5a. SFV Semliki Forest Virus, HSV1 Herpes Simplex Virus 1, LACV La Crosse encephalitis Virus, RVFV Rift Valley Fever Virus, THOV Thogotovirus, VACV Vaccinia virus, VSV Vesicular Stomatitis Virus, ZIKV Zika Virus. b THP-1 cells were left uninfected or infected with SFV at MOI 1 for 24 h, followed by LC-MS/MS based quantification of protein abundances. Protein abundance changes between infected and uninfected conditions for selected transcription-related complex components is depicted. Further related data is presented in Supplementary Fig. 5b, c. c Schematic representation of viral targeting strategies centered on the host transcriptional machinery and its interface with the complexes involved in cleavage and polyadenylation.

References

    1. García-Sastre A, et al. Influenza A virus lacking the NS1 gene replicates in interferon-deficient systems. Virology. 1998;252:324–330. doi: 10.1006/viro.1998.9508. - DOI - PubMed
    1. Hale BG, Randall RE, Ortín J, Jackson D. The multifunctional NS1 protein of influenza A viruses. J. Gen. Virol. 2008;89:2359–2376. doi: 10.1099/vir.0.2008/004606-0. - DOI - PubMed
    1. Rajsbaum R, et al. Species-specific inhibition of RIG-I ubiquitination and IFN induction by the influenza A virus NS1 protein. PLoS Pathog. 2012;8:e1003059. doi: 10.1371/journal.ppat.1003059. - DOI - PMC - PubMed
    1. Kochs G, García-Sastre A, Martínez-Sobrido L. Multiple anti-interferon actions of the influenza A virus NS1 protein. J. Virol. 2007;81:7011–7021. doi: 10.1128/JVI.02581-06. - DOI - PMC - PubMed
    1. Steidle S, et al. Glycine 184 in nonstructural protein NS1 determines the virulence of influenza A virus strain PR8 without affecting the host interferon response. J. Virol. 2010;84:12761–12770. doi: 10.1128/JVI.00701-10. - DOI - PMC - PubMed

Publication types

MeSH terms

Substances