. 2023 Aug 15;14(1):4937.
doi: 10.1038/s41467-023-40484-7.

A sex-specific thermogenic neurocircuit induced by predator smell recruiting cholecystokinin neurons in the dorsomedial hypothalamus

Affiliations

A sex-specific thermogenic neurocircuit induced by predator smell recruiting cholecystokinin neurons in the dorsomedial hypothalamus

Predrag Jovanovic et al. Nat Commun. .

Abstract

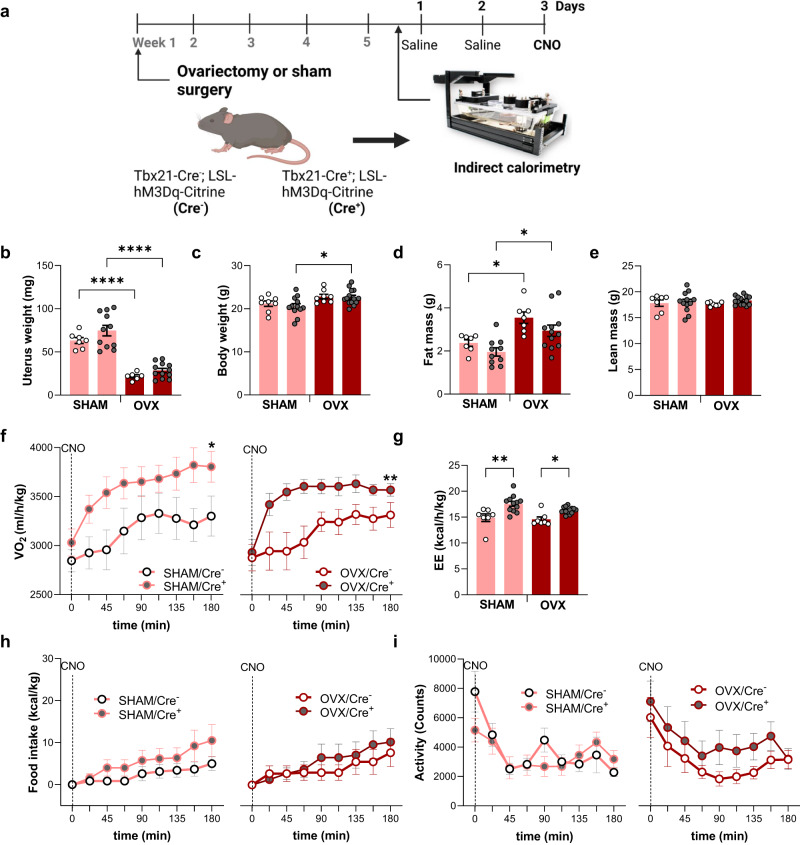
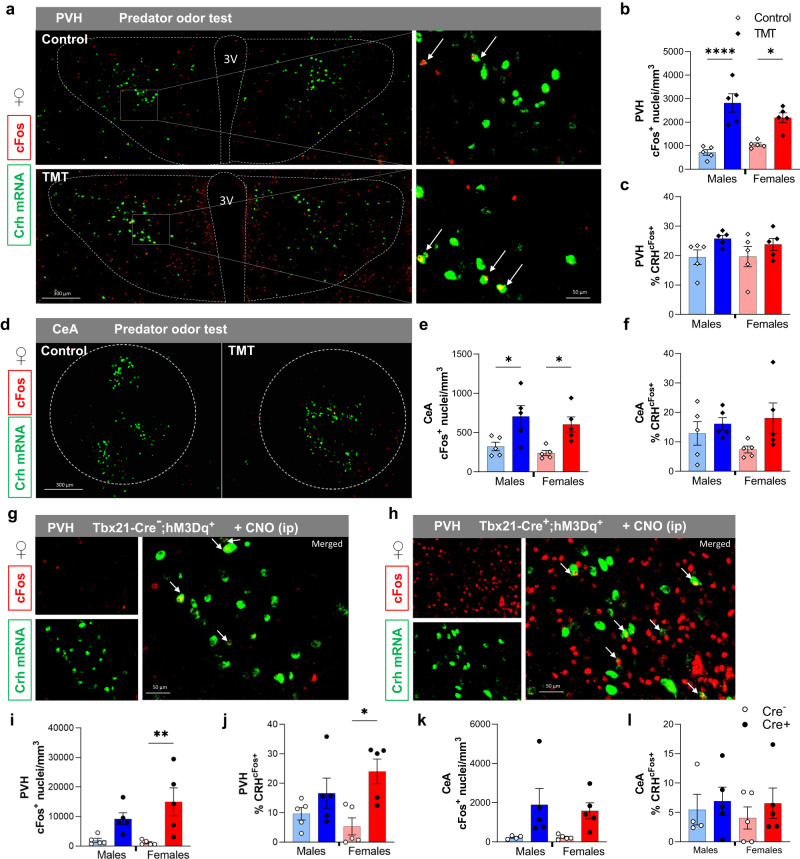
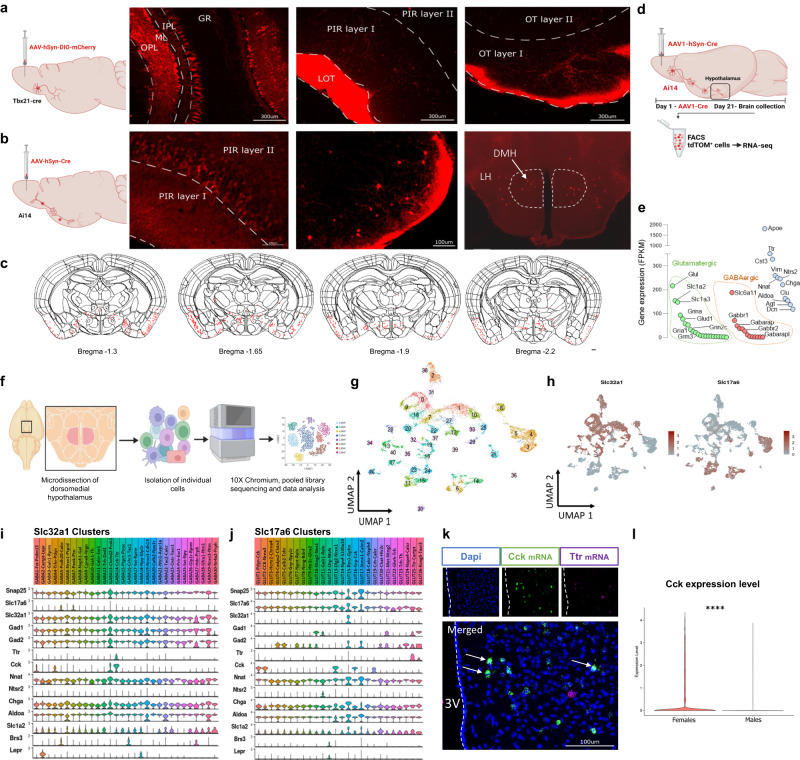
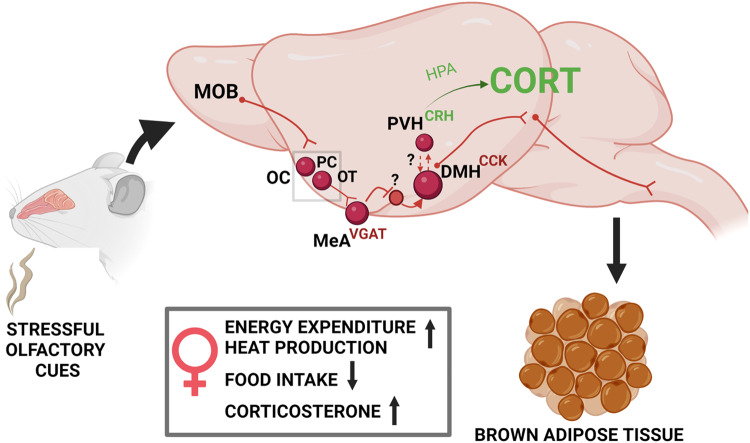
Olfactory cues are vital for prey animals like rodents to perceive and evade predators. Stress-induced hyperthermia, via brown adipose tissue (BAT) thermogenesis, boosts physical performance and facilitates escape. However, many aspects of this response, including thermogenic control and sex-specific effects, remain enigmatic. Our study unveils that the predator odor trimethylthiazoline (TMT) elicits BAT thermogenesis, suppresses feeding, and drives glucocorticoid release in female mice. Chemogenetic stimulation of olfactory bulb (OB) mitral cells recapitulates the thermogenic output of this response and associated stress hormone corticosterone release in female mice. Neuronal projections from OB to medial amygdala (MeA) and dorsomedial hypothalamus (DMH) exhibit female-specific cFos activity toward odors. Cell sorting and single-cell RNA-sequencing of DMH identify cholecystokinin (CCK)-expressing neurons as recipients of predator odor cues. Chemogenetic manipulation and neuronal silencing of DMHCCK neurons further implicate these neurons in the propagation of predator odor-associated thermogenesis and food intake suppression, highlighting their role in female stress-induced hyperthermia.


Conflict of interest statement

The authors declare no competing interests.

Figures

Fig. 1
Fig. 1. Effect of predator smell on energy metabolism and mediobasal hypothalamus activity.
a Experimental design. Mice given TMT odor or control swab were assessed by indirect calorimetry. b CORT levels measured 90 min following TMT or control odor stimulus, males (light blue/blue) and females (pink/red),males, N = 12/control and N = 14/TMT, females, N = 12 per group, Two-way Anova with Tukey’s post hoc comparison. c, d VO2 post-exposure to TMT, N = 16 per group, Two-way Anova with Sidak’s post hoc comparison. e, f Activity 3 h post-exposure to TMT, males, N = 16 per group, Two-way Anova with Sidak’s post hoc comparison. g, h Food intake 3 h post-exposure to TMT, males, N = 11 per group, females, N = 12/control and N = 10/TMT. I, j Brown adipose tissue temperature 3 h post-exposure to TMT, males, N = 11 per group, females, N = 11 per group, Two-way Anova with Sidak’s post hoc comparison. k, l Food intake after an overnight fast in male and female mice exposed to TMT or control scent, males, N = 9 control group and N = 10 TMT group females, N = 10 per group, Two-way Anova with Sidak’s post hoc comparison. m Schematic of the experiment. Mice given an odor were monitored for changes in brain cFos expression. n, o cFos expression after odor exposure in ARC and quantification, N = 5 per group, Two-way Anova with Dunnett’s post hoc comparison. p, q cFos expression after odor exposure in DMH and quantification, N = 5 per group, Two-way Anova with Dunnett’s post hoc comparison. All bar graphs are presented as mean values ± SEM. Table S1 contains the detailed results of the statistical analysis. *p < 0.05, **p < 0.01, ***p < 0.001. Source data are provided as a Source Data file. corticosterone (CORT), arcuate nucleus of the hypothalamus (ARC), dorsomedial hypothalamus (DMH), 2,4,5-trimethylthiazoline (TMT). Scale bar 100 µm.
Fig. 2
Fig. 2. Chemogenetic stimulation of olfactory mitral and tufted cells modulates energy expenditure in a sex-specific manner.
a Schematic of the experiment. Mice were either treated with CNO prior to behavior testing or received saline prior to CNO in indirect calorimetry assays. b Immunostaining of MOB from Tbx21-Cre+-hM3Dq+ animal (Cre+), citrine (green) and cFos (red), scale 300 µm, Two independent experiments, N = 6. c Analysis of cFos positive cells in MOB, males (light blue/blue) and females (pink/red), males, N = 7 per group, females, N = 8/Cre and N = 6/Cre+, Two-way Anova with Tukey’s post hoc comparison. d Buried pellet test 20 min following CNO injection, males, N = 11/Cre- and N = 6/Cre + , females, N = 9 per group, Two-way Anova with Tukey’s post hoc comparison. e Open field test 20 min following CNO injection, N = 11 per group, Two-way Anova with Tukey’s post hoc comparison. f Levels of corticosterone measured 90 min after CNO injection, males, N = 8 per group, females, N = 7 per group. g, h VO2 for 3 h post-CNO Injection, males, N = 14 per group, females, N = 13 per group, Two-way Anova with Sidak’s post hoc comparison. i, j Food intake for 3 h post-CNO Injection, males, N = 14 per group, females, N = 13 per group. k, l Total activity for 3 h post-CNO Injection, males, N = 14/per group, females, N = 13 p. m, n Refeeding after overnight fasting post-CNO Injection, males, N = 15/Cre− and N = 17/Cre + , females, N = 12/Cre− and N = 10/Cre + . oq Representative infrared images of ROI selected to measure BAT temperature and analysis of BAT temperature upon CNO injection, males, N = 8/Cre− and N = 11/Cre + , females, N = 9/Cre− and N = 12/Cre + , Three-way Anova. r Plasma free fatty acid levels in mice collected 90 min post CNO delivery, males, N = 8 per group, females, N = 7 per group, Two-way Anova with Tukey’s post hoc comparison. All bar graphs are presented as mean values ± SEM. Table S2 contains the detailed results of the statistical analysis. *p < 0.05, **p < 0.01, ***p < 0.001. Source data are provided as a Source Data file. corticosterone (CORT), Clozapine-N-Oxide (CNO), Brown adipose tissue (BAT).
Fig. 3
Fig. 3. Effect of sex hormones on female energy expenditure driven by chemogenetic activation of olfactory mitral and tufted cells.
a Experimental design, Tbx21-Cre+-hM3Dq+ and control mice received ovariectomy (OVX) or sham surgery (SHAM) 5 weeks prior to indirect calorimetry. b Uterus weight at the end of the experiment, pink (SHAM), brown (OVX), SHAM, N = 7/Cre and N = 11/Cre+, OVX, N = 6/Cre and N = 10/Cre+, Two-way Anova with Tukey’s post hoc comparison. c Body weight at week 5 post ovariectomy, SHAM, N = 8/Cre and N = 12/Cre+, OVX, N = 8/Cre and N = 14/Cre+, Two-way Anova with Tukey’s post hoc comparison. d,e Fat and lean mass at week 5 after ovariectomy, N = 7–12/group, Two-way Anova with Tukey’s post hoc comparison. f VO2 post-CNO injection in SHAM (left) and OVX (right), SHAM, N = 7/Cre and N = 12/Cre+, OVX, N = 8/Cre and N = 13/Cre+, Mixed-effects model. g Energy expenditure (EE) post-CNO, SHAM, N = 7/Cre and N = 12/Cre+, OVX, N = 8/Cre and N = 13/Cre+, Two-way Anova with Tukey’s post hoc comparison. h Food intake post-CNO injection in SHAM (left) and OVX (right), SHAM, N = 7/Cre and N = 12/Cre+, OVX, N = 8/Cre and N = 13/Cre+. i Activity post-CNO injection in SHAM (left) and OVX (right), SHAM, N = 7/Cre and N = 12/Cre+, OVX, N = 8/Cre and N = 13/Cre+. All bar graphs are presented as mean values ± SEM. Table S3 contains the detailed results of the statistical analysis. *p < 0.05, **p < 0.01, ****p < 0.0001. Source data are provided as a Source Data file.
Fig. 4
Fig. 4. Mediobasal hypothalamus and medial amygdala neuronal activity in response to chemogenetic stimulation of olfactory mitral and tufted cells.
ad cFos Immunostaining (green, scale 100 µm) and quantification in posterior medial amygdala (MeAp), ARC, LH, DMH of Tbx21-Cre+-hM3Dq+ male and female mice, for MeAp, LH, DMH, males, N = 7 per group, females, N = 8/Cre− and N = 6/Cre + , for ARC, males, N = 6 per group, females, N = 8/Cre− and N = 6/Cre + , Two-way Anova with Tukey’s post hoc comparison. e Representative image of immunohistochemical and in situ hybridization co-staining in female dDMH for Vgat (green), Vglut2 (blue) and cFos protein (red), yellow cells express Vgat/cFos (top), magenta cells express cFos/Vglut (bottom), scale 50 µm. f Representative image of immunohistochemical and in situ hybridization co-staining in DMH for Lepr (green) and cFos protein (red), arrows point to colocalization of signal in neurons, scale 100 µm. g MeA immunohistochemical and in situ hybridization co-staining of Vgat (green), Vglut2 (blue) and cFos protein (red), yellow cells express Vgat/cFos, magenta cells express cFos/Vglut, scale 100 µm. h Quantification of DMH colocalization between cFos/Vgat and cFos/Vglut2 in male and female mice, N = 5 per group (left), and quantification of DMH cFos/Lepr colocalization, N = 5 per group (right). i Quantification of MeA cFos expression in inhibitory neurons (upper panel) and excitatory neurons (lower panel), N = 5 per group, Unpaired t-test,Two-tailed. All bar graphs are presented as mean values ± SEM. Table S4 contains the detailed results of the statistical analysis. *p < 0.05, ***p < 0.001. Source data are provided as a Source Data file. arcuate nucleus of the hypothalamus (ARC), dorsomedial hypothalamus (DMH), lateral hypothalamus (LH) and posterior medial amygdala (MeAp).
Fig. 5
Fig. 5. Effect of predator odor exposure and chemogenetic activation of olfaction on activity of CRH-expressing neurons in PVH and CeA.
a Immunohistochemical and in situ hybridization co-staining of Crh (green) and cFos protein (red) in PVH of female mice after exposure to TMT, yellow cells express Crh/cFos, scale 50 µm and 100 µm. b Quantification of neuronal activity in PVH after exposure to TMT, males (light blue/blue) and females (pink/red), N = 5 per group, Two-way Anova with Tukey’s post hoc comparison. c Quantification of the percentage of activated Crh-positive cells in PVH after TMT exposure, N = 5 per group. d Immunohistochemical and in situ hybridization co-staining of Crh (green) and cFos protein (red) in CeA of female mice after exposure to TMT, yellow cells express Crh/cFos, scale 300 µm. e Quantification of neuronal activity in CeA after exposure to TMT, N = 5 per group, Two-way Anova with Tukey’s post hoc comparison. f Quantification of the percentage of activated Crh-positive cells in CeA after TMT exposure, N = 5 per group. g, h Immunohistochemical and in situ hybridization co-staining of Crh (green) and cFos protein (red) in PVH of Tbx21-Cre and Cre-+-hM3Dq+ female mice after CNO injection, yellow cells express Crh/cFos, scale 50 µm. i, j Quantification of cFos-positive cells in PVH and CeA post CNO injection, N = 5 per group, Two-way Anova with Tukey’s post hoc comparison. k, l Quantification of the percentage of activated Crh-positive cells in PVH and CeA, males, N = 4/Cre- and N = 5/Cre + , females, N = 5 per group. All bar graphs are presented as mean values ± SEM. Table S5 contains the detailed results of the statistical analysis. *p < 0.05, **p < 0.01, ****p < 0.0001. Source data are provided as a Source Data file. 2,4,5-trimethylthiazoline (TMT), paraventricular hypothalamus (PVH), central amygdala (CeA).
Fig. 6
Fig. 6. Indirect synaptic connections allow neuronal communication between MOB and DMH nuclei.
a Approach to identify direct synaptic connections with MOB using the presynaptic tracer AAV-hSyn-DIO-mCherry delivered to the MOB of Tbx21-Cre+ mice. mCherry positive cells were solely present in olfactory processing centers, Two independent experiments, N = 6. b Approach to identify indirect synaptic connections with MOB using the polysynaptic tracer AAV-hSyn-Cre injected into MOB of Ai14 mice (tdTomato reporter) and identification of projection neurons in DMH and LH, Two independent experiments, N = 5. c Summary of tdTomato signal localization in brain sections using QuckNII alignment (Allen Brain Atlas reference), Two independent experiments, N = 5. d Cartoon representation of cell sorting analysis to collect hypothalamic TdTomato-positive neurons and RNA-sequencing. e tdTomato+ hypothalamic neurons transcriptome levels of GABAergic, glutamatergic and other enriched genes, Two independent experiments, N = 14. f Experimental design to isolate single cells from microdissected DMH and scRNA-seq. g Uniform Manifold Approximation and Projection (UMAP) clustering of neuronal populations in the DMH identified by single cell RNA sequencing (10, 028 neurons, 6 pooled mice, 41 clusters). h UMAP highlighting GABAergic (Slc32a1) and glutamatergic (Slc17a6) neuronal clusters. i,j Subclustering into inhibitory and excitatory clusters revealed cluster GABA 14 as one coexpressing Ttr and Cck, color scheme of clusters corresponds to color scheme of UMAPs in Supplementary Fig. 7k Immunohistochemical and in situ hybridization co-staining of Cck (green) and Ttr mRNA (magenta) in DMH, white represent Cck/Ttr co-expression, scale 100 µm. l Violin plot of Cck expression in DMH neurons, Model-based Analysis of Single-cell Transcriptomics (MAST) analysis. Table S6 contains the detailed results of the statistical analysis. ****p < 0.0001. Source data are provided as a Source Data file. main olfactory bulb (MOB), dorsomedial hypothalamus (DMH), lateral hypothalamus (LH).
Fig. 7
Fig. 7. Activation of CCK-expressing neurons in DMH upon chemogenetic stimulation of olfaction or predator odor exposure.
a Representative image of immunohistochemical and in situ hybridization of co-staining for Cck (green) and cFos protein (red) in dDMH and cDMH post-CNO injection, scale 100 µm and 300 µm. b Quantification of the percentage of cFos-positive cells that co-express CCK in dDMH (left) and cDMH (right) post-CNO injection, N = 6 per group, Unpaired t-test,Two-tailed. c Representative image of immunohistochemical and in situ hybridization of co-staining for Cck (green) and cFos protein (red) in dDMH and cDMH after TMT exposure, scale 50 µm and 100 µm. d Quantification of the percentage of cFos-positive cells that co-express CCK in dDMH (left) and cDMH (right) after TMT exposure, N = 4 per group, Unpaired t-test,Two-tailed. Source data are provided as a Source Data file. dorsal dorsomedial hypothalamus (dDMH) and compact dorsomedial hypothalamus (cDMH), clozapine-N-Oxide (CNO), 2,4,5-trimethylthiazoline (TMT).
Fig. 8
Fig. 8. Chemogenetic activation and tetanus toxin-mediated synaptic silencing of CCK-expressing neurons in DMH.
a Experimental design for chemogenetic manipulation of CCK-expressing neurons in the DMH. b Bilateral stereotaxic targeting of DMH neurons using AAV-DIO-hM3D-mCherry shows robust mCherry signal in the d/cDMH overlapping with cFos after CNO injection, Two independent experiments, N = 15. c Oxygen consumption in CCK-IRES-Cre+ mice after CNO injection, males, N = 4 per group, females, N = 3/mCherry and N = 4/hM3D. d Average VO2 in CCK-IRES-Cre+ measured for 3 h post-CNO injection, males, N = 4 per group, females, N = 3/mCherry and N = 4/hM3D, Unpaired t-test,Two-tailed. e Total activity in CCK-IRES-Cre+ mice after CNO injection, males, N = 4 per group, females, N = 3/mCherry and N = 4/hM3D. f Food intake measured after overnight fasting and upon CNO injection, males, N = 4 per group, females, N = 3/mCherry and N = 4/hM3D, Two-way Anova with Sidak’s post hoc comparison. g CORT levels post-CNO injection, N = 4 per group. h Experimental design for tetanus toxin-mediated synaptic silencing of CCK-expressing neurons in the DMH. i eGFP positive cells in cDMH after stereotaxic AAV injection, Two independent experiments, N = 16. j VO2 measured upon TMT or control swab exposure, N = 8 per group, Three-way Anova. k VO2 before the stimulus (t = 0 min) and after exposure to the stimulus (t = 22.5 min), N = 8 per group, Two-way Anova with Tukey’s post hoc comparison. l Activity measured upon TMT or control swab exposure, N = 8 per group, Three-way Anova. m Activity before the stimulus (t = 0 min) and after exposure to the stimulus (t = 22.5 min), N = 8 per group, Two-way Anova with Tukey’s post hoc comparison. n Food intake measured after overnight fasting and upon TMT or control swab exposure, eGFP, N = 7/No odor and N = 6/TMT, TeNT, N = 8/No odor and N = 7/TMT, Three-way Anova. o Cumulative food intake after 6 h of refeeding under TMT or control swab exposure, eGFP, N = 7/No odor and N = 6/TMT, TeNT, N = 8/No odor and N = 7/TMT, Two-way Anova with Tukey’s post hoc comparison. All bar graphs are presented as mean values ± SEM. Table S7 contains the detailed results of the statistical analysis. *p < 0.05, **p < 0.01, ****p  < 0.0001. Source data are provided as a Source Data file. Clozapine-N-Oxide (CNO), 2,4,5-trimethylthiazoline (TMT), corticosterone (CORT), compact dorsomedial hypothalamus (cDMH), Adeno-associated viruses (AAV).
Fig. 9
Fig. 9. Model for the stress-induced recruitment of thermogenesis by olfactory cues in the female brain.
Stressful cues are detected by olfactory pathways and integrated by the MeA, where increased GABAergic activity in the female brain leads to recruitment of CCK neurons from the DMH and stress-induced thermogenesis through BAT activation and suppression of food intake. Recruitment of CRH neurons in the PVH drives CORT release through HPA axis stimulation, in a process that might depend on the activation of CCK neurons. Cholecystokinin (CCK), corticotropin-releasing hormone (CRH), corticosterone (CORT), dorsomedial hypothalamus (DMH), hypothalamic-pituitary-adrenal (HPA) axis, main olfactory bulb (MOB), medial amygdala (MeA), olfactory cortex (OC), olfactory tubercula (OT), paraventricular nucleus of the hypothalamus (PVH), piriform cortex (PC).

References

    1. Kim JS, Han SY, Iremonger KJ. Stress experience and hormone feedback tune distinct components of hypothalamic CRH neuron activity. Nat. Commun. 2019;10:5696. - PMC - PubMed
    1. Füzesi T, Daviu N, Wamsteeker Cusulin JI, Bonin RP, Bains JS. Hypothalamic CRH neurons orchestrate complex behaviours after stress. Nat. Commun. 2016;7:11937. - PMC - PubMed
    1. Evans AN, Liu Y, MacGregor R, Huang V, Aguilera G. Regulation of Hypothalamic Corticotropin-Releasing Hormone Transcription by Elevated Glucocorticoids. Mol. Endocrinol. 2013;27:1796–1807. - PMC - PubMed
    1. Kim J, et al. Rapid, biphasic CRF neuronal responses encode positive and negative valence. Nat. Neurosci. 2019;22:576–585. - PMC - PubMed
    1. Rabasa C, Dickson SL. Impact of stress on metabolism and energy balance. Curr Opin. Behav. Sci. 2016;9:71–77.

Publication types

Substances

LinkOut - more resources